Star-Forming AGN Host Galaxies
Abstract
The symbiosis of nuclear activity and star-formation in galaxies, as manifested in their spectral energy distributions (SEDs) is reviewed. Attention is drawn to an Hertzsprung-Russell diagram-equivalent for such objects, as well as to the importance of the SEDs in cosmological context.
keywords:
galaxies: active , galaxies: starburst , quasars: infrared1 Introduction
Let me start this review (the first paper at this workshop) by showing you a picture of good-old IRAS. It is fair to say that IRAS added a new dimension to the parameter space of galaxies: dust emission. This dimension is the very reason for our get-together! Not only has the highly diverse dust content of normal and active galaxies become apparent, but a new class of very dusty galaxies has also emerged: the UltraLuminous Infrared Galaxies (ULIRGs). This review will primarily discuss the active galaxies among the former group, but also deal with the latter group, in their relation to the former.
A key issue in contemporary astrophysics is the cosmologically evolving star-formation activity. Nuclear activity, taken here to mean accretion driven energy generation, and circumnuclear star-formation activity in galaxies, are sometimes seen to go hand in hand (e.g., NGC 1068: Schinnerer et al. 2000; Mkn 231: Taylor et al. 1999). The question arises whether the resemblance of the cosmic star-formation history diagram (Madau et al. 1996) and the plot of evolving QSO space density (in particular the peak; e.g., Shaver et al. 1996) is purely coincidental. In this review I wish to convey the message that AGN host galaxies offer excellent opportunities to study the history of star-formation over a substantial cosmic time span, and I will describe the usefulness and the unique character of the global Spectral Energy Distribution (SED) of these objects in such studies. Indeed, as judged from these SEDs, a substantial fraction of (nearby) QSO host galaxies display vigorous star-formation. I will draw attention to a far-infrared AGN Hertzsprung-Russell diagram that may prove useful in the study of the interconnection between active galaxies and ULIRGs.
2 Dust in normal and active galaxies
The FIR SED of a normal galaxy is commonly believed to consist of a cold (T15 K) component and a warmer (T20–60 K) component (e.g., Helou 2000). The former is the well known large scale cirrus component, being energized by the diffuse interstellar radiation field of the, primarily, old stellar population. The latter originates from dust in star-forming regions, i.e., regions containing massive young stars which provide a strong, dust-heating UV photon field (and moreover, yield supernovae). Depending on the relative strength of these two components a galaxy will display a cold, intermediate temperature, or warm FIR SED. While passively evolving spirals have a steeply rising SED from 60 m to 100 m, with111 adopted average (or equivalently log (60)/(100) ) and average , starburst galaxies such as M 82 and Arp 220 are warmer, having (and in the range to ). The strength of the warm dust component is correlated with the optically thin synchrotron radio emission – this is the well known radio-FIR correlation (e.g., Condon 1992).
Active galaxies display still warmer dust, drawing additional heating input from the hard continuum radiation of the active nucleus. Seyfert galaxies for instance display warm FIR SEDs, and the FIR warmth as quantified by the index indeed appears to be a useful AGN selection criterion: De Grijp et al. (1985) found a high fraction of Seyferts among galaxies having flatter than . Early on in the IRAS survey the nearby broad-line radio galaxy 3C 390.3 was suspected to have even warmer dust: Miley et al. (1984) reported a pronounced 25 m peak in this object. Van Bemmel (these Proceedings) deals with the far-infrared SEDs of the BLRG class, suggesting that in fact there is not an excess of hot dust but a deficit of cool dust in these 25 m peakers.
While ground-breaking work on FIR SEDs in galaxies was carried out by IRAS, ISO has put this research on a more quantitative basis. For instance, Rodríguez Espinosa et al. (1996) and Pérez García et al. (1998) used ISO data to further constrain the multi-temperature dust model for Seyfert galaxies. From detailed measurements of the FIR SEDs they infer the presence of warm dust (T150 K), presumably heated by AGN, and cooler dust (T45 K), presumably heated by young stars. Also, the cold cirrus component could be identified in a number of cases. Subsequent optical imaging (Rodríguez Espinosa & Pérez García 1997) demonstrated that indeed, the warm and cool dust are respectively AGN and host galaxy related. Bimodal dust temperature distributions were also measured in the interacting Antennae galaxies NGC 4038, 39 and the ultraluminous infrared galaxies NGC 6240 and Arp 220 (Klaas et al. 1997). In these objects the warm dust is believed to be powered by starburst activity, the relative strength of the warm component w.r.t. the cool component being governed by extinction within the system.
While the star-formation related dust cannot be easily linked to the color and luminosity of the host galaxy (e.g., Helou 2000), such an astrophysical connection must be present. Bregman et al. (1998) for instance found that FIR-bright early type galaxies are more luminous in H, H I and CO lines as compared to their normal counterparts. In the same vein, Clements (2000) showed that among radio-quiet QSOs the ones having cool colors (hence substantial cool dust besides the AGN related hot dust) stood out with a higher FIR luminosity and higher incidence of distorted optical host morphology. The latter is generally taken to imply enhanced star-formation (e.g., Mazzarella et al. 1991).
3 Dust in quasars and radio galaxies
As for the more powerful AGN in the distant universe, it should be first noted that IRAS detected primarily radio-loud objects, with a dominant contribution from flat (radio-)spectrum objects. This calls for a careful examination of the SEDs of radio-loud quasars and radio galaxies, taking their detailed radio characteristics into account. The optical–FIR–radio SED of the well known radio galaxy Cygnus A (3C 405), as compiled by Ilse van Bemmel, is shown in Fig. 1, together with a model fit of optically thin black bodies. The infrared spectral indices of Cyg A are: and .
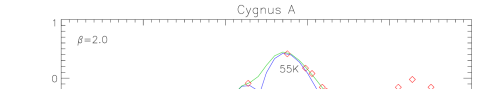
Consistent with the FIR SEDs of normal and Seyfert galaxies, we see cold, cool and warm dust in Cyg A. The pronounced cool (T=55 K) dust luminosity suggests a substantial level of star-formation in the Cyg A host galaxy. The fact that the ratio of FIR and radio luminosity for Cyg A is substantially different from the general radio galaxy population is nevertheless attributed to the anomalously high radio luminosity of the object (Barthel & Arnaud 1996). As can be readily seen, non-thermal FIR radiation, i.e., the short wavelength tail of the nuclear continuum, has an almost negligible strength. Combining clear detections at about ten wavelengths, no other radio galaxy or quasar has its infrared SED so well determined.
As for the quasars measured by IRAS, very few distant radio-quiet QSOs and only a handful of steep-spectrum 3CR QSRs were detected (Neugebauer et al. 1986). Early on, QSR 3C 48 was recognized as an extraordinary luminous FIR emitter (Neugebauer et al. 1985). QSR 3C 446 was also found to be infrared luminous, but as nicely illustrated by its IRAS measured variability (Neugebauer et al. 1986), nonthermal radiation must be dominating the 3C 446 SED, in line with its identification as a Blazar. Blazars were soon recognized as a class of their own, with smooth albeit variable radio–FIR–optical continua (Edelson & Malkan 1987, Impey & Neugebauer 1988, Brown et al. 1989). The IRAS radio galaxy study by Golombek et al. (1988) yielded a couple dozen detections but only two objects beyond . However, despite the limitations of these data, some interesting trends emerged for various classes of powerful AGN. For instance, Golombek et al. found that the radio galaxy FIR strength reflected their emission line strength. Heckman et al. (1992, 1994), employing improved IRAS data analysis routines, compiled infrared SEDs for ensembles of AGN. They reported that FR1 (edge-darkened) radio sources were about a factor of four less luminous in the FIR as compared to FR2 (edge-brightened, hotspot) sources, and they confirmed the presence of a hot 25 m dust component in the class of broad-line radio galaxies. They also reported subtle differences in FIR output between FR2 radio galaxies and QSRs, discordant with predictions of the simple orientation-based unification model.
The work of Hes et al. (1995) increased the detection rate of distant 3C objects and provided a clear picture of the mechanisms involved. They confirmed the Heckman et al. finding that quasars are somewhat brighter in the far-infrared than radio galaxies, but pointed out that beamed non-thermal radiation might be (at least in part) responsible for this difference. The 60 m strength being correlated with the radio core strength, it is unlikely that the Rowan-Robinson (1995) two-component dust model applies to radio-loud objects: the AGN strength is probably also reflected in the long wavelength FIR emission. Hoekstra et al. (1997) modeled FIR beaming, and quantified its effect on the FIR SED, as a function of radio beaming. Hes et al. (1995) also discovered that the probability of detecting a radio galaxy in the far-infrared is enhanced by optical N-type morphology, in connection with either broad lines or the combination of compact radio structure and blue optical colors. The latter fact was clearly underlined by Willott et al. (2000), who discovered that the redshift of the IRAS detected compact radio galaxy 3C 318 is 1.5 rather than 0.7: 3C 318 is the most distant 3C source detected by IRAS, harbouring a dust luminosity of approximately . The high FIR luminosity of the QSR 3C 48 could be understood along similar lines. The subgalactic size radio source is hosted by a galaxy merger displaying luminous young star clusters and HII regions (Kirhakos et al. 1999, Canalizo & Stockton 2000b) as well as bright molecular gas emission (Wink et al. 1997). The FIR luminosity of 3C 48 must be connected to ongoing star-formation.
Combining IRAS with cm and mm data, Van Bemmel et al. (1998) further quantified the level of FIR beaming in double-lobed quasars: they found its magnitude to be modest, and not sufficient to explain the difference with radio galaxies. Using the PHOT instrument on board ISO Haas et al. (1998) confirmed and refined the picture as drawn by IRAS. In particular, the contributions of beamed non-thermal and presumed aspect-independent thermal FIR emission could be isolated in the SED of blazar 3C 279, and the multicomponent nature of its dust emission became apparent. It will by now be clear why I started my examination of the AGN FIR SED components with the radio-loud subclass: these offer the advantage that their jet orientation w.r.t. the observer is known so that orientation dependence can be taken into account. Focussing on the unification issue, such was again done by Van Bemmel et al. (2000), examining ISO photometry of samples of quasars and radio galaxies. Apparent disagreement with predictions of the unification scheme may be attributed to small anisotropy effects (but see also Müller et al. in these Proceedings).
Polletta et al. (2000) examined ISOPHOT measurements of the FIR SEDs of quasars, dealing with various classes of radio-loud and radio-quiet objects. They present average quasar SEDs and conclude that AGN powered far-infrared emission dominates the SED, but that it is supplemented by starburst powered FIR emission. The latter is observed in radio-loud and radio-quiet QSOs, at comparable strength in both classes. Haas et al. (2000; see also Haas’ contribution in these Proceedings) describe ISO measurements of the FIR SEDs of PG QSOs. The SEDs suggest strong dust emission, drawing power from both the AGN and starburst activity.
While in the case of radio-loud quasars and radio galaxies radio images at arcsecond and milliarcsecond resolution irrefutably demonstrate that the activity originates in a subparsec sized volume, such is not readily apparent in radio-quiet objects. Given the fact that radio-quiet QSOs appear to follow the radio-FIR correlation for star-forming systems (which include 30 Doradus, irregular galaxies, spiral galaxies and ultraluminous infrared galaxies) it has been proposed that QSOs may be powered by starburst activity as well (e.g., Sopp & Alexander 1991). Analyses by Rush et al. (1996) and Giuricin et al. (1996) have in the meantime shown that excess radio emission is present in Seyfert galaxies, calling for a non-thermal AGN. The issue for the more distant and powerful QSOs remains controversial. I will return to this issue later.
In summary, the FIR SEDs of active galaxies are composed of cold ISM dust emission, cool star-formation dust, warm AGN heated dust and possibly a beamed nonthermal component. Describing the FIR SEDS in terms of discrete temperature components (besides the smooth synchrotron continuum) is obviously a naive simplification, but so far seems to work reasonably well.
4 Dust and gas in ULIRGs and QSOs
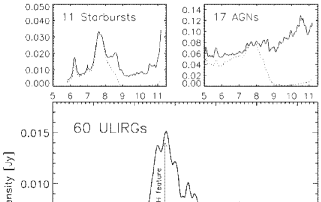
We have seen in the previous sections that both AGN heated and star-formation heated dust can be recognized in AGN FIR SEDs. Prime examples of systems undergoing vigorous star-formation are the ULIRGs (e.g., Sanders & Mirabel 1996). Also given the fact that radio-quiet QSOs and ULIRGs obey the same radio-FIR correlation (see for instance Figures 3 and 4 in Colina & Pérez-Olea 1995), the question as to the interconnection between AGN and starbursting ULIRGs is a long standing one – e.g., Sanders et al. (1988). At least for nearby objects, ISO spectroscopy has indicated that the ionization stages of AGN and ULIRGs are different: high ionization lines ([O IV], [Ne V]) appear in the mid-infrared spectra of the former but not the latter class (Lutz et al. 1996, Lutz et al. 1999). Also the relative strength of the PAH features appears to be a useful diagnostic – see Fig. 2, taken from Lutz et al. (1998), which shows this PAH/continuum ratio for the average AGN, starburst galaxy and ULIRG. Spoon et al. (2000) has recently pointed out a caveat when using this diagnostic, and it should also be noted that these diagnostics have not yet been applied to luminous QSOs.

Section 2 already addressed the relative strength of warm and cool dust, and specifically the FIR SED spectral slope , to isolate AGN among star-forming galaxies. The usefulness of this index is nicely illustrated by Fig. 3, a compilation of SEDs of relatively warm ultraluminous infrared sources, taken from Sanders et al. (1988): a range of spectral slopes is seen, from fairly steep to flat/inverted. Fig. 4 combines with data, for IRAS detected QSOs and ULIRGs. QSOs cluster in the area . Well-known star-forming QSOs (e.g., Canalizo & Stockton 2000a) occupy the area close to the ULIRGs in this FIR color-color diagram. Indeed appears a good discriminator: in fact some strongly star-forming QSOs (genuine PG QSOs!) are too ‘cool’ to classify as AGN under the De Grijp et al. (1985) criterion. Such ‘cool’ QSOs were addressed by Clements (2000 – see Section 2) and are also under study by Stockton and collaborators, Sanders and collaborators, and by our group – the next section describes this work.
5 The starburst–AGN symbiosis: source evolution?
As we have seen in the previous section, the far-infrared spectral index broadly speaking allows to address the relative importance of AGN-activity and starburst-activity in – at least not too distant – galaxies. Attempts have also been made to combine an infrared spectral index with the relative PAH strength (e.g., Lutz et al. 1998) and with line ratio’s (e.g., Kewley et al. 2001) in such assessments. A Groningen-lead study (in a collaborative effort with researchers in Hawaii, Socorro, Cambridge (UK) and Hertfordshire) has shown that the FIR SEDs indeed present a powerful tool, particularly 25 and 60 m photometry in combination with sensitive high-resolution radio imaging.
Our group has obtained and analysed deep radio (VLA), optical/nearIR (ESO; La Palma, including Carlsberg Meridian Circle astrometry), as well as improved IRAS data for a sample of 16 Seyfert galaxies having , and 27 radio-quiet PG QSOs having . These complementary sets of active galaxies span a wide range (3.5 orders of magnitude) of luminosities. These are expressed as m), and hence predominantly reflect the AGN strength (e.g., Spinoglio & Malkan 1989). The radio-imaging, reaching noise levels of Jy, combined with the optical astrometry yields AGN positions to a 3 accuracy of arcsec. This allows assessment of the star-formation driven radio emission. The radio data of these – I stress – radio-quiet active galaxies are being combined with far-infrared photometry, yielding -parameters log (see e.g., Condon & Broderick 1988), which permit the determination of the relative contributions of nuclear activity and star-formation. Most Seyfert galaxies have infrared detections (at 25 and 60 m), in contrast to about half of the PG QSOs. Also the ratios of the 60 m and blue flux densities were compiled.
Figure 5 shows as function of the -parameter. Normal star-forming spirals, obeying the radio-FIR correlation, have values in the range 2.4–3.0. It is seen that the more powerful (radio-quiet but not radio-silent) QSOs have flatter indices than the Seyferts, and that excess nuclear radio emission (i.e., ) leads to warmer dust for both classes.
In order to quantify the heating effect of the AGN luminosity, I plot in Figure 6 the FIR spectral index as function of the 12 m luminosity. The trend of warmer dust with increasing AGN luminosity is clearly seen. Examination of the -parameters results in the distributions as marked with light and dark shading. Light shading indicates objects having , having excess nuclear radio emission. Their ratios are low. Dark shading indicates objects with merely diffuse radio emission, and ratios typically a factor 5 – 10 higher. Note that particularly for the QSOs the -band magnitude measures the AGN strength.
On the basis of these measurements I conclude that star-formation plays a stronger role in the lower half of the diagonal strip than it does in the upper half. Could this be an evolutionary effect, during the lifetime of the active galaxy? Figure 7 is the same plot as Figure 6, but with the well-known (U)LIRGs Arp 220, NGC 6240, Mkn 231 and star-forming Seyfert galaxies NGC 1808, NGC 7469, NGC 7552 added. These strongly star-forming systems indeed appear in and below the lower part of the diagonal strip, in line with the picture where the AGN phase is preceded by a gradually weakening starburst phase. Note that for the six star-formers (open symbols) the 12 m luminosity is probably not the optimal indicator of their FIR luminosity. Their actual luminosity points may lie more to the right. When rotated by , figure 7 displays luminosity vs. temperature, and can thus be considered as the active galaxy equivalent of the classical Hertzsprung-Russell diagram. Larger samples and detailed analysis of the star-formation histories (e.g., Canalizo & Stockton 2000a, Canalizo 2000) may permit to draw evolutionary tracks. JCMT observations of the molecular gas in QSO hosts are currently being analyzed by our group to test the evolutionary scenario. Given that roughly half of the AGN occupy the strip where star-formation is important, the similarity of the cosmic star-formation history and the quasar space density history referred to in the introductory section may indeed not be coincidental.
6 Summary
The 60 m luminosity, when normalized with the 25 m (or the 12 m), the blue or the radio luminosity, permits one to assess the absolute and relative strength of star-formation and nuclear activity in active galaxies and quasars. The FIR temperature can be combined with measures of the bolometric luminosity to yield an intriguing AGN Hertzsprung-Russell diagram, which among other things suggests that star-formation plays an important role. These photometric ratios can be obtained in a straightforward manner for the faint distant objects to be measured in large quantities with upcoming space-infrared missions, such as SIRTF, ASTRO-F and FIRST/Herschel.
7 Acknowledgements
Thanks are due to Dieter Lutz, David Sanders and Ilse van Bemmel, who allowed me to reproduce figures, and to Jim Higdon who read the manuscript. I acknowledge a long collaborative effort with Bob Argyle, Jeroen Gerritsen, Magiel Janson, Johan Knapen, David Sanders and Dick Sramek.
References
- Barthel and Arnaud (1996) Barthel P.D., Arnaud K., 1996, M.N.R.A.S. 283, L45
- Bregman et al. (1999) Bregman J.N., Snider B.A., Grego L., Cox C.V., 1998, ApJ 499, 670
- Brown et al. (1989) Brown L.M.J., Robson E.I., Gear W.K., et al., 1989, ApJ 340, 129
- Canalizo (2000) Canalizo G., 2000, PhD Thesis (University of Hawaii)
- Canalizo and Stockton (2000a) Canalizo G., Stockton A., 2000a, AJ 120, 1750
- Canalizo and Stockton (2000b) Canalizo G., Stockton A., 2000b, ApJ 528, 201
- Clements (2000) Clements D.L., 2000, M.N.R.A.S. 311, 833
- Colina and PerezOlea (1995) Colina L., Pérez-Olea D.E., 1995, M.N.R.A.S. 277, 845
- Condon (1992) Condon J.J., 1992, ARAA 30, 575
- Condon and Broderick (1988) Condon J.J., Broderick J.J., 1988, AJ 96, 30
- DeGrijp et al. (1985) De Grijp M.H.K., Miley G.K., Lub J., De Jong T., 1985, Nature 314, 240
- Edelson and Malkan (1987) Edelson R. A., Malkan, M. A., 1987, ApJ 323, 516
- Giuricin et al. (1996) Giuricin G., Fadda D. Mezzeti M., 1996, ApJ 468, 475
- Golombek et al. (1988) Golombek D., Miley G.K., Neugebauer G., 1988, AJ 95, 26
- Haas et al. (1998) Haas M., Chini R., Meisenheimer K., et al., 1998, ApJ 503, L109
- Haas et al. (2000) Haas M., Müller S.A.H., Chini R., et al., 2000, A&A 354, 453
- Helou (2000) Helou G., in Infrared Astronomy: Today and Tomorrow, Les Houches Summer School (eds. F. Casoli and J. Lequeux), 2000, astro-ph/0005198
- Heckman et al. (1992) Heckman T.M., Chambers K.C., Postman M., 1992, ApJ 391, 39
- Heckman et al. (1994) Heckman T.M., O’Dea C.P., Baum S.A., Laurikainen E., 1994, ApJ 428, 65
- Hes et al. (1995) Hes R., Barthel P.D., Hoekstra H., 1995, A&A 303, 8
- Hoekstra et al. (1997) Hoekstra H., Barthel P.D., Hes R., 1997, A&A 319, 757
- Impey and Neugebauer (1988) Impey C.D., Neugebauer G., 1988, AJ 95, 307
- Kewley et al. (2001) Kewley L.J., Heisler C.A., Dopita M.A., Lumsden, S., 2001, ApJS 132, 37
- Kirhakos et al. (1999) Kirhakos S., Bahcall J.N., Schneider D.P., Kristian J., 1999, ApJ 520, 67
- Klaas et al. (1997) Klaas U., Haas M., Heinrichsen I., Schulz B., 1997, A&A 325, L21
- Lutz et al. (1996) Lutz D., Genzel R., Sternberg A., et al. 1996, A&A 315, L137
- Lutz et al. (1998) Lutz D., Spoon H.W.W., Rigopoulou D., Moorwood A.F.M., Genzel R., 1998, ApJ 505, L103
- Lutz et al. (1999) Lutz D., Veilleux S., Genzel R., 1999, ApJ 517, L13
- Madau et al. (1996) Madau P., Ferguson H.C., Dickinson M.E., et al., 1996, MNRAS 283, 1388
- Mazzarella et al. (1988) Mazzarella J.M., Bothun G.D., Boroson T.A. 1991, AJ 101, 2034
- Miley et al. (1984) Miley G., Neugebauer G., Clegg P.E., et al. 1984, ApJ 278, L79
- Neugebauer et al. (1985) Neugebauer G., Soifer B.T., Miley G.K., 1985, ApJ 295, L27
- Neugebauer et al. (1986) Neugebauer G., Miley G.K., Soifer B.T., Clegg P.E., 1986, ApJ 308, 815
- Perez Garcia et al. (1998) Pérez García A.M., Rodríguez Espinosa J.M., Santolaya Rey A.E., 1998, ApJ 500, 685
- Polletta et al. (2000) Polletta M., Courvoisier T.J.-L., Hooper E.J., Wilkes B.J., 2000, A&A 362, 75
- Rodriguez Espinosa et al. (1996) Rodríguez Espinosa J.M., Pérez García A.M., Lemke D., Meisenheimer K., 1996, A&A 315, L129
- Rodriguez and Perez Garcia (1997) Rodríguez Espinosa J.M. & Pérez García A.M., 1997, ApJ 487, L33
- Rowan-Robinson (1995) Rowan-Robinson M., 1995, M.N.R.A.S. 272, 737
- Rush et al. (1996) Rush B., Malkan M.A., Edelson R.A., 1996, ApJ 473, 130
- Sanders and Mirabel (1996) Sanders D.B. & Mirabel I.F., 1996, ARAA 34, 749
- Sanders et al. (1988) Sanders D.B., Soifer B.T., Elias J.H., Neugebauer G., Matthews K., 1988, ApJ 328, L35
- Schinnerer et al. (2000) Schinnerer E., Eckart A., Tacconi L. J., Genzel R., Downes D., 2000, ApJ 533, 850
- Shaver et al. (1996) Shaver P.A., Wall J.V., Kellermann K.I., Jackson C.A., Hawkins M.R.S., 1996, Nature 384, 439
- Sopp and Alexander (1991) Sopp H.M. & Alexander P., 1991, M.N.R.A.S. 251, 14P
- Spinoglio and Malkan (1989) Spinoglio L. & Malkan M.A., 1989, ApJ 342, 83
- Spoon et al. (2000) Spoon H.W.W., Keane J.V., Tielens A.G.G.M., Luz D., Moorwood A.F.M., 2000, A&A 365, L353
- Taylor et al. (1999) Taylor G.B., Silver C.S., Ulvestad J.S., Carilli, C.L., 1999, ApJ 519, 185
- van Bemmel et al. (1998) Van Bemmel I.M., Barthel P.D., Yun, M.S., 1998, A&A 334, 799
- van Bemmel et al. (2000) Van Bemmel I.M., Barthel P.D., de Graauw M.W.M., 2000, A&A 359, 523
- Willott et al. (2000) Willott C.J., Rawlings S., Jarvis M.J., 2000, M.N.R.A.S. 313, 237
- Wink et al. (1997) Wink J.E., Guilloteau S., Wilson T.L., 1997, A&A 322, 427