A Targeted Survey for H I Clouds in Galaxy Groups
Abstract
Five galaxy groups with properties similar to those of the Local Group have been surveyed for H i clouds with the Arecibo Telescope. In total 300 pointings have been observed on grids of approximately Mpc centred on the groups. The 4.5 detection limit on the minimal detectable H i masses is approximately (). All detections could be attributed to optical galaxies; no significant detections of H i clouds have been made. This null result leads to the conclusion that the total H i mass of intragroup clouds must be less than 10 per cent of the total H i mass of galaxy groups and less than 0.05 per cent of the dynamical mass. The recent hypothesis that Galactic high velocity clouds are Local Group satellite galaxies is highly inconsistent with these observations.
keywords:
ISM: clouds – intergalactic medium – Local Group – galaxies: luminosity function, mass function – radio lines: ISM1 Introduction
Groups of galaxies have been the subject of many H i studies. Famous H i maps of, for example, the M81 group (van der Hulst 1979, Appleton, Davies & Stephenson 1981, Yun, Ho & Lo 1994) show that these groups often host tidal H i features (see also e.g., van Driel et al. 1992, Li & Seaquist 1994, Rand 1994, and Haynes, Giovanelli & Chincarini 1984 for a review). The incidence of H i features was quantified by Haynes (1981) who found that six galaxy groups from a sample of 15 show H i appendages from at least one member galaxy. These data might suggest that H i filaments and intragroup clouds are commonplace throughout galaxy groups, but such a conclusion could be misleading since H i surveys are normally concentrated on the inner parts of galaxy groups and often on interacting pairs within the groups. Systematic searches throughout the volumes occupied by the groups are rare because the projected sizes of groups on the sky are too large to be covered by aperture synthesis instruments. A notable exception is the survey described by Lo & Sargent (1979) who systematically searched for H i clouds throughout the volumes around the M81, CVnI and NGC 1023 groups. No clouds were detected to the H i mass limit of , although several new dwarf galaxies were discovered.
Lo & Sargent (1979) discussed their null-result in the context of Galactic High Velocity Clouds (HVCs). They concluded that HVCs are unlikely to be intergalactic gas clouds in the Local Group (LG) because they should have detected an equivalent population in the external groups. Similar conclusions were reached by Giovanelli (1981) and Wakker & van Woerden (1997). However, the idea that the HVCs instead of being small clouds close to the Milky Way galaxy, are clouds of primordial composition at LG distances has recently seen a revival. Originally proposed by Oort (1966), subsequently discussed by Verschuur (1969) and Hulsbosch (1975), the idea has been refined by Blitz et al. (1999, hereafter BSTHB), who added a dark matter component to the clouds. The problem with earlier considerations of the extragalactic origin of HVCs was their derived distance. Hulsbosch (1975) concluded on the basis of the virial theorem that typical distances would be approximately 10 Mpc, which places the clouds outside the LG. BSTHB show that if the HVCs are built from the same material that galaxies are made of (typical baryon content of 10 per cent), their distances would reduce to Mpc. Moreover, they show that the clouds’ distribution on the sky resembles that of LG dwarfs, and their kinematics as an ensemble can be well modelled if they are distributed throughout the LG. Braun & Burton (1999, hereafter BB) define a subsample of 65 compact HVCs and come to essentially the same conclusions about their subsample. Note that the BSTHB and BB models do not apply to the HVCs associated with the Magellanic Stream, which are likely the result of tidal interactions between the Milky Way and the Magellanic Clouds (Putman et al. 1998)
Placed at LG distances, the HVCs have H i masses of and typical diameters of 30 kpc. In this picture, approximately 500 to 1000 clouds are distributed throughout the LG, together adding approximately to the LG H i mass. Interestingly, this number of HVCs is in reasonable agreement with the number of mini halos that are predicted by numerical simulations of the hierarchical LG formation (Klypin et al. 1999; Moore et al. 1999). Corrected for incompleteness, the BB sample comprises clouds. Using the updated average distance of 650 kpc (Braun & Burton 2000), the total H i mass in their clouds would be approximately .
Charlton, Churchill & Rigby (2000) show that the statistics of Mgii and Lyman limit absorbers in the spectra of quasars is in conflict with the hypothesis that the HVCs are intragroup material (see also Zwaan 2000). For analogous HVC populations to exist around intervening galaxies as well as in the LG, the typical distances would need to be less than 200 kpc from the LG barycenter. A very similar conclusion has been reached by Zwaan & Briggs (2000) who show that existing H i surveys impose strong constraints on the existence of extragalactic HVCs. If H i clouds exist in other groups or around galaxies, with properties similar to those proposed for the LG, several instances should already have been detected in large H i surveys such as the Arecibo survey discussed by Zwaan et al. (1997).
In this paper we present additional evidence by means of a targeted survey of five galaxy groups with the Arecibo telescope. The selection of the targets is discussed in § 2 and the data acquisition and analysis is summarised in § 3. In § 4 the detections are presented, and in § 5 we discuss the implications on the existence of intragroup H i clouds. To enable direct comparison between the surveyed groups and the LG, we adopt distances to the groups based on their redshift velocities and a Hubble constant of .
2 Sample selection
In order to make the targeted survey for H i clouds most efficient, we have selected the galaxy groups according to the following criteria: 1) The distance to the groups must be such that the expected H i cloud diameters match the projected extent of the Arecibo beam. BSTHB estimate that the cloud diameters are approximately 30 kpc. The beam of the Arecibo Telescope subtends kpc at a distance Mpc. The optimal group distance at which the clouds fill the beam is therefore 30 Mpc. We have selected groups with radial velocities in the range to . 2) The declination must be in the range 10∘ to 30∘ so that the groups are accessible to the Arecibo Telescope and can be tracked for at least one hour. 3) To enable comparison with the LG, the global properties of the groups, such as the integral H i mass, luminosity, and dynamical mass, must be comparable to those of the LG.
The list of galaxy groups compiled by Garcia (1993) was found to be the most successful in meeting the above listed criteria. This catalogue was compiled from the LEDA111We have made use of the Lyon-Meudon Extragalactic Database (LEDA) supplied by the LEDA team at the CRAL-Observatoire de Lyon (France). galaxy sample, and is basically a cross section of groups found via a percolation method (Huchra & Geller 1982) and groups identified via the hierarchical clustering method (Materne 1978). Table 1 gives the measured and derived properties of the selected groups. The groups are named after their brightest member.
| (1) | (2) | (3) | (4) | (5) | (6) | (7) | (8) | (9) | (10) |
|---|---|---|---|---|---|---|---|---|---|
| Name | |||||||||
| (h m) | (∘ ′) | () | () | () | () | () | () | ||
| NGC 5798 | 14 56 | 30 21 | 3 | 1773 | 40 | 9.9 | 9.5 | 12.0 | 0.9 |
| NGC 5962 | 15 35 | 15 26 | 5 | 1872 | 126 | 10.8 | 10.0 | 13.0 | 1.9 |
| NGC 5970 | 15 37 | 12 14 | 4 | 1887 | 58 | 10.7 | 10.1 | 12.3 | 1.2 |
| NGC 6278 | 17 00 | 23 02 | 3 | 2911 | 104 | 10.5 | 9.6 | 12.8 | 1.7 |
| NGC 6500 | 17 53 | 18 16 | 6 | 2994 | 105 | 11.0 | 10.2 | 13.3 | 2.3 |
| NGC 6574 | 18 12 | 13 37 | 4 | 2279 | 28 | 10.9 | 10.2 | 12.2 | 1.1 |
| Local Group | 3 | 61 | 10.6 | 10.1 | 12.4 | 1.2 |
(1) Most luminous member, (2) and (3) Unweighted average RA and declination, (4) Number of known member with measured redshifts, (5) Unweighted average radial velocity, (6) Radial velocity dispersion. The uncertainty on this is approximately , (7) Integral -band luminosity, (8) Integral H i mass, (9) Rough estimate of dynamical projected mass (see text), (10) Estimate of the ‘zero-velocity radius’ (see text).
a Number of LG members included in the Garcia (1993) catalogue if the LG were to be at a distance of 30 Mpc, b Taken from Courteau & van den Bergh (1999), c Taken from van den Bergh (2000), d Dwarfs from Mateo (1998) and giants from van den Bergh (2000).
We have made crude estimates of the groups’ dynamical masses by applying the ‘projected mass estimator’ which is discussed by Heisler, Tremaine & Bahcall (1985) and is defined as
| (1) |
where is the number of members, is the radial velocity of member with respect to the group mean velocity, and is the projected distance of member from the centre of the group. Since the groups have only 3 to 6 identified members, the errors on the mass estimates are large (approximately ). The radius of the zero-velocity surface, , beyond which galaxies participate in the Hubble expansion, can be calculated via (Sandage 1986)
| (2) |
where is the age of the group. We take the ages of all groups to be 14 Gyr.
For comparison, we also give in Table 1 the most recent published properties of the LG, taken from Mateo (1998), Courteau & van den Bergh (1999), and van den Bergh (2000). For the LG, the dynamical mass is estimated using the virial theorem, but it has been shown by Heisler et al. (1985) that the virial theorem and the ‘projected mass estimator’ give very similar results. It is evident from the table that the selected groups have properties not very dissimilar from those of the LG: the selected groups are on average equally gas rich, luminous, and massive and have a similar radial extent as the LG. Note that the centres of the NGC 5962 and NGC 5970 groups are only apart and that their formal zero velocity radii are overlapping. Their difference in is only 15 . It is suggestive that these two groups actually form one gravitationally bound system. If we assume that they form one group, its dynamical mass would become , and its zero velocity radius would be . In the remainder of this paper we regard the NGC 5962/5970 group as one group.
3 Observational strategy
Observations were carried out with the refurbished Arecibo222The Arecibo Observatory is part of the National Astronomy and Ionosphere Center, which is operated by Cornell University under a cooperative agreement with the National Science Foundation. Telescope during five nights in the period from April 18 until 24, 1999 and on June 8 and 9, 1999. The data were taken with the L-narrow Gregorian receiver which has a measured system temperature of 32 K, and a gain of . Spectra of 2048 channels were recorded for two polarisations over a bandwidth of 12.5 MHz, centred on the frequency of the 21cm line redshifted to the mean velocity of each galaxy group. This setting results in a total velocity coverage of and a velocity resolution of 1.3 before Hanning smoothing. Spectra were dumped every 60 seconds.
The pointings were arranged in rectangular grids centred on the galaxy groups. The grids were built from several series of five pointings on lines of constant declination, where each pointing was separated by 5 minutes in hour angle. The integration time per pointing was 4 minutes and integrations were separated exactly 5 minutes in time. The remaining minute was used to slew the telescope back. This strategy insures that the same path on the telescope dish was traced during each of the five pointing in a series. No separate OFF scans were taken, but for each scan a synthetic OFF scan was computed by averaging the other four scans in the same series. This synthetic OFF scan can be written as
| (3) |
where is the number of pointings in an array, is an individual scan and is the average of all scans in one series.
For this type of observation, this observing technique is superior in its efficiency compared to a traditional observing scheme where separate ON/OFF pairs are taken for each pointing. For this ON/OFF scheme the total noise depends on integration time as . Normally, the integration times for the ON and the OFF scans are taken to be equal so that , where is the total integration time needed for each pointing. For our strategy, where we make composite OFF scans from other scans in the array, the noise , where is the number of pointings in one series and is the time spend on each pointing. From this we can derive
| (4) |
This shows that in our case, where , the technique is a factor of 3.2 faster than traditional ON/OFF procedures. In other words, in the same amount of time a factor 1.8 higher signal to noise can be achieved.
Fig. 1 shows a schematic view of the pointings that were observed, together with the positions of the group galaxies. The circles indicate the sizes of the groups characterised by the zero-gravity radius . The grids of pointings sparsely sample rectangular areas of approximately Mpc.

Calibration of the data was performed by observing continuum sources with known flux densities. Separate scans and polarisations were averaged and Hanning smoothed. Polynomials were fitted to regions free from obvious signals, and subtracted from the spectra in order to obtain flat baselines. A first order polynomial (linear baseline) was generally found to be sufficient. Each spectrum was then Gaussian smoothed to resolutions 5, 10, 25 and 50 . The resulting noise level was on average 0.75 mJy at 10 resolution, which corresponds to a minimal detectable H i column density level of (). The lowest detectable H i mass at 30 Mpc was for a 10 broad signal. The H i mass limit increases to for signals 50 wide.
All spectra were checked for peaks in the full resolution and the smoothed spectra. The list of 4.5 peaks was first checked for false positives due to RFI by re-analysing the separate 60 second scans for both polarisations. All peaks that could not unambiguously be attributed to RFI were re-observed for confirmation on 8 and 9 June 1999. The new observations were conducted following an ON/OFF fashion, spending 8 minutes ON and 8 minutes OFF on each position. The resulting noise level for these observations was therefore a factor lower than for the original observations carried out in April 1999.
4 The detections
Three pointings were deliberately aimed at the positions of known galaxies. This was done to check the positional accuracy of the pointing method, and to obtain a confirmation of the flux calibration. The left three panels of Fig. 2 show the spectra of NGC 5789, UGC 11168 and NGC 6500. The latter one shows a secondary peak at . This turns out to be part of the H i filament in the galaxy pair NGC 6500/6501, that has been mapped with the WSRT by van Driel, Davies & Appleton (1988). The authors describe the H i structure as a ‘classical bridge and tail configuration of a double galaxy interaction’. This is obviously of tidal origin, and not a primordial H i cloud.
The right panels of Fig. 2 show the three other confirmed detections. The first one is due to UGC 11037. This galaxy was not intentionally pointed at, but one of the pointings happened to fall very close () to this galaxy. There is a similar explanation for the detection in the spectrum in the central right panel. This pointing was only separated from the centre of NGC 6574. The redshift of the signal agrees very well with the measured redshift of NGC 6574.
Finally, the lower right spectrum shows a detection at , in the direction of the NGC 5962/5970 group. There is no catalogued galaxy at this position, but there is an obvious optical galaxy visible on the DSS, only to the north. The observed H i redshift is consistent with membership in the NGC 5962/5970 group. From the DSS we estimate the brightness of the galaxy to be (assuming ). The number density of galaxies brighter that is approximately 4.0 per square degree (Metcalfe et al. 1995). The probability of encountering a galaxy of such brightness within a radius is therefore approximately 3 per cent. Furthermore, the velocity width of the signal is , a factor of larger than the typical width of the HVCs in the Wakker & van Woerden (1991) catalogue, and broader than any known HVC. We therefore conclude that this H i signal is very likely associated with the optical galaxy. Additional 21cm observations on this field are required to confirm this.

In summary, no H i clouds of the type predicted by the BSTHB scenario have been found. Two detections were made that could not unambiguously be identified as known optical galaxies. One is a known tidal H i filament in the NGC 6500/6501 pair, similar to the Magellanic Stream seen in the Local Group (Putman et al. 1998). The other detection is very likely the result of a uncataloged member of the NGC 5970 group.
5 Space density of H I clouds
We now use the null-result of the Arecibo group survey to derive upper limits to the space density of H i clouds in galaxy groups and discuss the cosmological significance of intragroup H i clouds.
5.1 HVCs as intragroup clouds
An explanation for Galactic HVCs that is of widespread current interest is provided by BSTHB who suggest that most of the HVCs are actually distributed throughout the LG and each cloud contains a few of H i. We perform Monte Carlo simulations to test this scenario by filling the five observed galaxy groups with synthetic populations of clouds following a recipe outlined by BSTHB. For the cloud properties we use the measured solid angles , velocity widths , and average brightness temperatures for Galactic HVCs from Wakker & van Woerden (1991). Virial distances are calculated for each cloud individually. The values of are directly proportional to the assumed ratio of baryon to total mass . If is 0.1, the virial distances are found to be approximately 1 Mpc. At those distances, the distribution of HVCs is in agreement with the kinematics of the LG, which was one of the main motivations of BSTHB to propose the extragalactic HVC scenario.
Within the groups, the clouds are placed at from the group’s barycenter, in a random direction. This situation would resemble that in the LG, except that the substructure that BSTHB attribute to LG dynamics is not simulated in the models of the external groups. The radial column density distribution for each cloud is first assumed to be flat. The average column density is calculated by taking , where is the cloud H i mass based on its value of and its observed flux, and is the cloud radius, calculated from its measured solid angle and . For each model, a number clouds per group is drawn randomly from the Galactic HVC parent population.
The synthetic cloud ensembles are ‘observed’ with patterns of beams following the observational strategy of our survey. A detection is counted if the fraction of the flux of a cloud within the beam exceeds the detection threshold. The simulations are run with velocity resolutions of 5, 10, 25 and 50 , similar to the searching of the real data. The same simulation is run 100 times for each group in order to obtain reliable error estimates on the expected number of detections.
First, we assume that the number of clouds per group, , is invariant over the different groups. If , which is substantially lower than the number of HVCs observed around the Milky Way Galaxy, the expected total number of detections is , where the error indicates the variation around the mean. Note that in the BSTHB scenario and in the BB scenario. The expected number of detections increases linearly with increasing . Next, we drop the restriction that all groups contain an equal number of clouds and instead scale with the dynamical mass of the group. This seems like a more logical thing to do since the H i mass and luminosity are also observed to scale in direct proportion to the dynamical mass. However, could of course be dependent on the dynamical state of the groups. In groups that have formed more recently, the primordial clouds are likely to have been less efficient in merging than in older groups. We have no detailed information on the dynamical state of the groups, and therefore simply assume that scales proportional to . We find that the expected total number of detections rises under this assumption: clouds are expected if the number of clouds in a group with LG mass is . The reason for this increase is that the average for the external groups is slightly higher than that for the LG.
The conclusion from this exercise is that the hypothesis set forward by BSTHB that HVCs are in-falling gas clouds in the LG is highly inconsistent with the observations, unless the LG is an unusual group. If the LG is a representative group and the five surveyed external groups are similar to the LG, our survey should have detected at least 30 clouds (assuming ).
5.2 Constraints on intragroup H I cloud properties
A graphical representation of the constraints on intragroup H i clouds is presented in Fig. 3. This figure shows the combined constraints on the mean H i mass of clouds, and the number of clouds in each group. The lines show 68, 90, 95, and 99 per cent confidence levels at which the existence of a cloud population can be excluded. Again we have made use of the observed parameters of Galactic HVCs to model cloud populations in the external groups and the number of clouds is again scaled with . For reference, the cloud populations proposed by BSTHB and BB are indicated by hatched boxes, the size of which reflects the uncertainty in the number and average H i mass. The horizontal arrow indicates the effect of changing the mean distance of the BB clouds from 1 Mpc to 650 kpc from the Local Group barycenter. This latter value is preferred by Braun & Burton (2000) after they have estimated the distance to one HVC by comparing the measured H i column density and the angular size of the cool core. Both the BSTHB and the BB populations are inconsistent with the observations at the per cent confidence level.
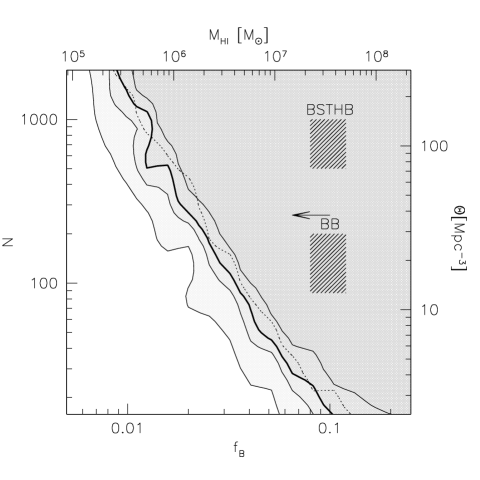
The distribution of H i column densities in HVCs often show a core-halo structure (Wakker & van Woerden 1997). Braun & Burton (2000) present high resolution WSRT imaging of six compact HVCs and show that the morphology can be described by a diffuse halo that encompasses one or more compact cores. We test the influence of this morphology on the detection efficiency in our survey by designing clouds with cores which account for 50 per cent of the total flux and have a radius . The remaining 50 per cent of the flux is distributed over a halo with a flat H i column density distribution. The 95 per cent confidence level on this population is indicated by a dashed line. It is clear that the detection efficiency is not significantly changed by this modification of the cloud structure.
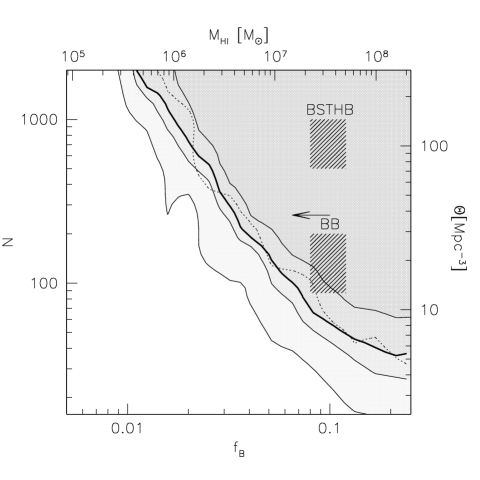
Fig. 4 is similar to Fig. 3, but here the number of clouds per group is non-variant. Again in this case, neither proposed population of clouds can be reconciled with our observations.
5.3 Significance of intragroup clouds
How do these upper limits compare to the hierarchical formation scenarios of galaxy groups? Klypin et al. (1999) and Moore et al. (1999) show that in numerical simulations of a hierarchical universe the relative amount of dark matter substructure halos is scale-invariant. The predicted relative number of dark matter halos is similar in clusters, groups and galaxies. However, only in clusters does the predicted number of clumps agree with observed luminosity functions; on galaxy and group scale the simulations predict an excess over the observed number of satellites by a factor of 10, especially for halos with circular velocities .
One of the proposed solutions for this problem of missing satellites is provided by the BSTHB hypothesis. However, the evidence presented in this paper, by Charlton et al. (2000) and by Zwaan & Briggs (2000) seem to rule out this solution. Only a very limited number of clouds with could exist in galaxy groups. A similar conclusion has been reached by Verheijen et al. (2000), who systematically survey a region of the Ursa Major cluster of galaxies and find no H i clouds to a limit of .
From Fig. 3 we conclude that the intragroup H i clouds contribute a maximum of of H i to the total group mass. This implies that no more than 10 per cent of all the H i in groups can reside in clouds with masses greater than . The H i mass in clouds must be less than 0.05 per cent of the total dynamical mass of the groups. In the non-variant case, these numbers rise to 20 and 0.1 per cent. The dynamical mass of a cloud population that is still permitted by the observations is more difficult to constrain. If we assume that the cold gas (H i and He i) is the only baryonic component in the clouds, and the baryon fraction (a factor normally observed in galaxies and clusters, Fukugita, Hogan & Peebles 1998), then the total contribution of the clouds to the dynamical mass of the groups must be less than 1 per cent. Note that Klypin et al. (1999) estimate that the total mass in the predicted dark matter satellites amounts to approximately 5 per cent of the total group mass. Such a high prediction can only be brought into agreement with our survey results if the clouds’ is lowered to 0.02. However, the median distance of the clouds from the groups’ barycentres would then reduce to kpc. It is not clear whether this is still consistent with the hierarchical model predictions in which the dark matter satellites are distributed throughout the groups.
A solution to the problem of missing satellites might be that the cold neutral gas is only a minor contributor to the total baryonic content of the clouds making the H i so insignificant that it can not be detected in 21cm surveys. This situation could occur if a large fraction of the gas reservoirs in the satellites are ionised by the intergalactic background. Klypin et al. (1999) and Moore et al. (1999) discuss gas ejection by early generation supernova-driven winds and inhibiting gas cooling and star formation by photo-evaporation as possible explanation of the absence of cold gas and stars in the satellites.
Solutions of a different kind can be found by changing the predicted number of clouds instead of modifying the baryons within the clouds. This can be achieved by suppressing of the primordial density fluctuation spectrum on small scales (Kamionkowski & Liddle 1999). Self-interacting dark matter (e.g., Spergel & Steinhardt 1999) and other dark-matter flavours (fluid dark matter, repulsive dark matter) have been suggested as possible explanations for a less efficient formation of small mass halos.
6 Summary
The conclusion reached by Lo & Sargent (1979) that Galactic HVCs are unlikely to be intergalactic gas in the Local Group (LG) remains sound and intact under scrutiny of a new 21cm survey with the refurbished Arecibo Telescope. This new survey consists of 300 pointings in five nearby galaxy groups and is sensitive to H i masses of approximately , depending on the velocity spread and distance of the signals. Two detections have been made that are not unambiguously caused by known optically selected galaxies. One is a known tidal H i filament in the NGC 6500/6501 pair, comparable to the Magellanic Stream (Putman et al. 1998). The other detection very likely originates in an uncataloged member of the NGC 5970 group. We therefore conclude that we have made no significant detections of H i clouds in galaxy groups.
We use this null-result to estimate constraints on the proposed population of H i clouds in groups, suggested by Blitz et al. (1999) and Braun & Burton (1999). These authors present a scenario in which the Galactic high velocity clouds (HVCs) are actually distributed throughout the LG at typical distances of a few hundred kpc to 1.5 Mpc. Fig. 3 shows the combined upper limits on the number of clouds per galaxy group, and the average H i mass on such clouds. The Blitz et al. (1999) scenario can be ruled out with per cent confidence levels, assuming that the LG is typical of the five groups studied here. The integral amount of H i in intragroup clouds is typically less than 10 per cent of the groups’ total H i mass, and less than 0.05 per cent of the total dynamical mass of the groups.
The absence of clouds in groups seems to present a problem for hierarchical structure formation scenarios that predict many satellites within groups. At present it remains unclear whether the solution to this problem lies in modifying the descriptions of hierarchical formation so that the predicted number of satellites drops, or that the baryons in the clouds are simply hiding from detection.
acknowledgements
I thank F. Briggs and the referee, V. Kilborn, for useful comments and discussion and K. O’Neil for doing part of the observing for this project.
References
- [] Appleton, P. N., Davies, R. D., Stephenson, R. J., 1981, MNRAS 195, 327
- [] Blitz, L., Spergel, D. N., Teuben, P. J., Hartmann, D., Burton, W. B., 1999, ApJ, 514, 818
- [] Braun, R., Burton, W. B., 1999, A&A, 341, 437
- [] Braun, R., Burton, W. B., 2000, A&A, 354, 853
- [] Charlton, J. C., Churchill, C. W., Rigby, J. R., 2000, astro-ph/0002001
- [] Courteau, S., van den Bergh, S., 1999, AJ, 118, 337
- [] Fukugita, M., Hogan, C. J., Peebles, P. J. E., 1998, ApJ, 503, 518
- [] Garcia, A. M., 1993, A&AS, 100, 47
- [] Giovanelli, R., 1981, AJ, 86, 1468
- [] Haynes, M. P., 1981, AJ, 86, 1126
- [] Haynes, M. P., Giovanelli, R., & Chincarini, G. L., 1994, ARA&A, 22, 445
- [] Heisler, J., Tremaine, S., Bahcall, J. N., 1985, ApJ, 298, 8
- [] Huchra, J. P., Geller, M. J., 1982, ApJ, 257, 423
- [] Hulsbosch, A. N. M., 1975, A&A, 40, 1
- [] Kamionkowski, M., Liddle, A. R., 1999, astro-ph/9911103
- [] Klypin, A. A., Kravtsov, A. V., Valenzuela, O., Prada, F., 1999, ApJ, 522, 82
- [] Li, J. G., Seaquist, E. R., 1994, AJ, 107, 1953
- [] Lo, K. Y., Sargent, W. L. W., 1979, ApJ, 227, 756
- [] Metcalfe, N., Shanks, T., Fong, R., Roche, N., 1995, MNRAS, 273, 257
- [] Mateo, M. L., 1998, A&AR, 36, 435
- [] Materne, J., 1978, A&A, 63, 401
- [] Moore, B., Ghigna, F., Governato, F., Lake, G., Stadel J., Tozzi, P., 1999, ApJ, 524, L19
- [] Oort, J. H., Bull. Astr. Inst. Neth., 1966, 18, 421
- [] Putman, M. E. et al., 1998, Nat, 394, 752
- [] Rand, R., 1994, A&A, 285, 833
- [] Sandage, A., 1986, ApJ, 307, 1
- [] Spergel, D. N. Steinhardt, P. J., 1999, astro-ph/9909386
- [] van den Bergh, S., 2000, PASP, 112, 529
- [] van der Hulst, J. M., 1979, A&A, 75, 97
- [] van Driel, W., Davies, R. D., Appleton, P. N., 1988, A&A, 199, 41
- [] van Driel, W., Augarde, R., Bottinelli, L., Gouguenheim, L., Hamabe, M., Maehara, H., Baan, W. A., Goudfrooij, P., Groenewegen, M. A. T., 1992, A&A, 259, 71
- [] Verheijen, M. A. W., Trentham, N., Tully, R. B., & Zwaan, M. A., 2000, astro-ph/0006122
- [] Verschuur, G. L., 1969, ApJ, 156, 771
- [] Wakker, B. P., van Woerden, H., 1991, A&A, 250, 509
- [] Wakker, B. P., van Woerden, H., 1997, A&AR, 35, 217
- [] Yun, M. S., Ho, P. T.P., Lo, K. Y., 1994, Nat, 372, 530
- [] Zwaan, M. A., 2000, Ph.D. Thesis, University of Groningen
- [] Zwaan, M. A., Briggs, F. H., 2000, ApJ, 530, L61
- [] Zwaan, M. A., Briggs, F. H., Sprayberry, D., Sorar, E., 1997, ApJ, 490, 173