Interstellar Medium Surrounding the WO Star in the Galaxy IC 1613: New Optical and Radio Observations††thanks: Astronomy Reports, Vol. 45 , No 6, 2001, Translated from Astronomicheskii Zhurnal, Vol. 78, No. 6. Translated by D. Gabuzda
Abstract
Observations of the nebula S3 associated with the WO star in the galaxy IC 1613 and of an extended region surrounding S3 are reported. The star and bright core of the nebula were observed with a multipupil fiber spectrograph mounted on the 6-m telescope of the Special Astrophysical Observatory of the Russian Academy of Sciences. Images in the principle spectral lines and integrated spectra of the star and three compact clumps were obtained, and the radial-velocity field constructed. An extended region of the galaxy was observed with the Very Large Array at 21 cm. A giant ring or H I shell enclosing a large fraction of the stellar population in IC 1613 was discovered. The WO star and associated bipolar nebula, which we discovered earlier, lies at the inner edge of the H I ring. A local H I deficiency and two arc-like H I ridges were also detected for the first time, and probably represent the neutral component of the bipolar shell surrounding the WO star. The two arc-like ridges may also have been produced by the collective stellar wind (and supernova explosions?) in OB association No. 9 from the list of Hodge. A scenario for the formation of the extended bipolar feature is discussed, based on the new data.
1 Introduction
Only six WR stars of more than five hundred such objects in the Local Group of galaxies belong to the rare WO class, which represents a very brief final evolutionary stage of massive stars approaching the naked CO-core stage (see Barlow & Hummer (1982), Kingsburg et al. (1995) and references therein). WO stars are characterized by powerful stellar winds with terminal velocities reaching ( Barlow & Hummer,1982; Torres et al., 1986; Dopita et al., 1990; Potcaro et al., 1992 ) and their effective temperatures can be as high as K (Dopita et al, 1990; Maeder & Meynet, 1989; Melnik & Heydari-Malayeri, 1991; Polcaro et al., 1991). One of these six stars was discovered by D’Odorico & Rosa (1982) (see also Davidson & Kinman 1982; Armandroff & Massey, 1985) in the dwarf irregular galaxy IC 1613. The star was identified by the specific wide bands it produces in the spectrum of the core of the bright emission nebula S3 from the list of Sandage (1971) – a giant pc) H II region. Throughout this paper, we adopt the distance 660 kpc for IC 1613, as derived by Saha et al. (1992). The central region of S3 shows bright He II 4686Å emission (D’Odorico & Rosa, 1982; Smith (1995), Garnett et al., 1991). A detailed spectral analysis of the nebula and a discussion of its chemical composition are presented by Garnett et al.(1991) and Kingsburgh & Barlow (1995) – hereafter KB95. The nebula S3 was found to be a source of thermal radio emission (Goss & Lozinskaya, 1995); the full size at half-maximum intensity of the radio source () corresponds to a bright region of the optical nebula visible on deep H images taken by Hodge et al. (1990) and Hunter et al. (1993).
| Date | Size of | Field of view | Wavelenth | Exposure | Seeing | |
|---|---|---|---|---|---|---|
| micropupil | interval | s | ||||
| 29.XI.99 | Å | 8Å | 7200 | |||
| 30.XI.99 | Å | 8Å | 7200 |
Our observations made with a scanning Fabry-Perot interferometer mounted on the 6-m telescope of the Special Astrophysical Observatory (SAO) and narrow-band H and [O III] images taken with the 4-m telescope of the Kitt Peak National Observatory resulted in the discovery of a faint external bipolar feature (hereafter called the bipolar shell) extending far beyond the bright nebula S3 (Lozinskaya, 1997; Afanasiev et al., 2000 – Paper I). The sizes of the two external components–the southeastern and northwestern shells–are pc) and pc), respectively. Radial-velocity measurements at the maximum and the H line halfwidths provide evidence for expansion of the bipolar shell, with lower limits to the expansion velocities of the southeastern and northwestern shells being 50 and at least , respectively.
In Paper I we proposed a scenario for the formation of the unique bipolar feature by the stellar wind of the WO star, which is embedded in a dense layer at the boundary of a supercavity in the galaxy’s H I distribution. We identified this supercavity by analyzing the H I column density distribution in IC 1613 published by Lake and Skillman (1989). At that time, we hypothesized the presence of a dense shell surrounding the supercavity and a physical association with the WO star, but were not able to prove that this was the case.
In the current paper, we report the results of new observations of the nebula associated with the WO star in the galaxy IC 1613. We observed the bright core of the nebula S3 using the MPFS multipupil fiber spectrograph mounted on the SAO 6-m telescope (Section 2). We obtained integrated spectra of individual compact clumps in the central bright region, and reconstructed the radial-velocity field from our H and [O III] 5007Å measurements. We also obtained observations of a large sector of IC 1613 at 21 cm with the Very Large Array (VLA; Section 3). We derived a detailed image of the neutral-gas distribution, which revealed a giant dense ring or H I shell surrounding the supercavity, and showed that the WO star does indeed reside in this dense ring and is physically interacting with it. We also found a local H I deficiency and two extended features, testifying to the presence of a neutral gas component associated with the ionized bipolar shell. In Section 4, we discuss the results of the observations and analyze a possible scenario for the formation of the extended bipolar feature.
2 Spectroscopic observations of the WO star and nebula S3
2.1 Observations and Data Reduction
The spectroscopic observations were made on November 29 and 30, 1999
using the new integral-field spectrograph MPFS (multipupil fiber
spectrograph) mounted at
the primary focus of the SAO 6-m telescope. A description of the
spectrograph can be found at the web-page
http://www.sao.ru/~gafan/devices.htm
Compared to the earlier version of the Afanasiev et al.(1990), the new spectrograph has a larger field of view, wider spectral range, and higher quantum efficiency. The spectrograph uses a CCD as a detector and allows a set of spectra to be taken simultaneously from 240 spatial elements (‘micropupils’) forming a array in the plane of the sky. The angular size of an image element can be varied from 05 to . A spectrum of the sky background 45 from the center of the field of view is taken simultaneously. Table 1 gives a log of the MPFS observations.
These observations were reduced using IDL-based software developed by the SAO Laboratory for Spectroscopy and Photometry of Extragalactic Objects. The preliminary data reduction included bias-frame subtraction, flat-field correction, cosmic-hits removal, extraction of individual spectra from the CCD images, and wavelength calibration using the spectrum of a He-Ne-Ar lamp. We then subtracted the night-sky spectrum from the linearized spectra and used a number of spectrophotometric standards observed at the same zenith angle as IC 1613 to convert the observed fluxes to an absolute energy scale. We used the same standards to derive the seeing estimates given in Table 1.
Analysis of the observations showed that the data obtained on November 29 and 30, 1999 yielded consistent values for the main parameters measured (line fluxes and velocities). Therefore, we will consider further only the November 30, 1999 data, since they had higher angular resolution.
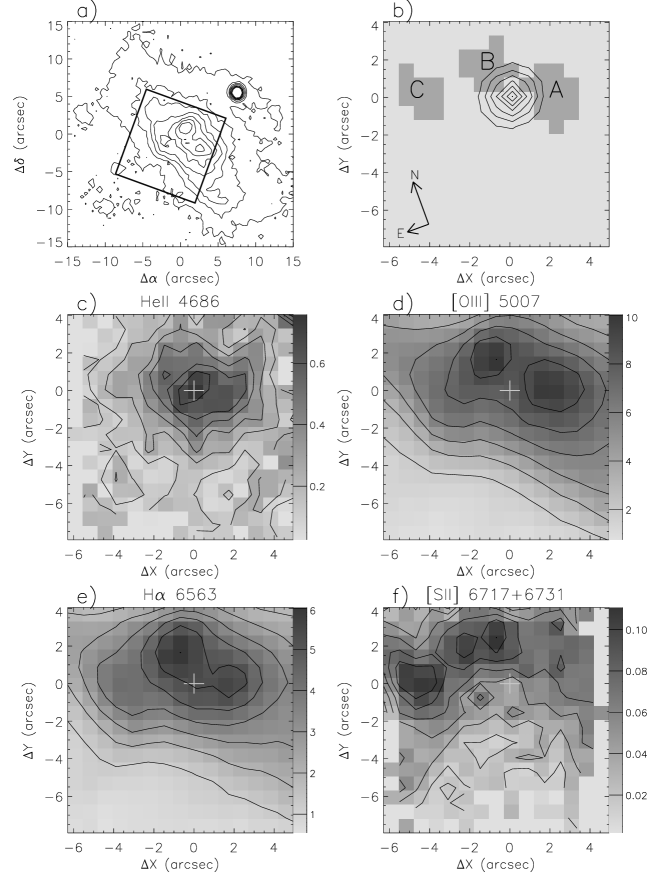
Figure 1a shows an [O III] line image of the central region of the nebula S3 surrounding the WO star from the data of Paper I, together with the boundaries of the field of view of our new MPFS observations.
2.2 The WO star.
We obtained the integrated spectrum of the WO star by co-adding 24 individual spectra, which exhibited the broad emission bands characteristic of Wolf-Rayet stars.
During the flux measurements, we fitted the emission lines using superpositions of two to six Gaussians; the resulting flux and equivalent-width estimates are summarized in Table 2. Note that the errors quoted in this table do not include uncertainty in the continuum level, which could contribute systematic errors to the equivalent widths. For comparison, this table also gives the fluxes and equivalent widths of the corresponding lines from KB95.
We observed a narrower spectral interval than KB96; it is clear from Table 2 that the two sets of observations do not show significant discrepancies. The differences between the equivalent widths are due primarily to the different methods used to determine the continuum level (unlike KB95, we did not take into account the nebular continuum component). Our flux estimates are higher than those of KB95 for most of the lines. This is likely due to the fact that our panoramic detector collected all the light from the star, whereas a long slit whose width () was comparable to or smaller than the image size was used in KB95. To test this hypothesis, we integrated the spectra of the star only over the lenses lying within a rectangle aligned along , i.e., in the direction of the slit used in KB95. The resulting WO-star line fluxes, indeed, proved to be a factor of 1.5–2 lower, on average, than the fluxes listed in Table 2. Moreover, as we show below, the emission-line brightness peak in the nebula does not coincide with the position of the star. This could have led to an offset during the positioning of the narrow slit on the star in KB95, resulting in further underestimation of the line fluxes.
We constructed images in the C IV+He II 4659Å, O V 5590Å, and C IV 5801Å emission lines by integrating the spectra over the intervals , , and Å, after subtraction of narrow nebular line components blended with the WO-star lines. The centroids of all the images agree to within , and also agree with the centroid of a continuum image made in the vicinity of 6100Å. We estimate the FWHM of these emission-line images of the WO star to be , , and , respectively, consistent with the seeing estimate of 18 obtained for the standard star (Table 1). Note that, due to certain specific features of the spectrograph, the images constructed from the micropupil array are slightly elongated (1:1.15) along the Y axis (Fig. 1b). Therefore, all our FWHM estimates are based on measurements in the X direction.
The continuum image of the WO star was somewhat more extended (FWHM = ) and exhibited a faint base. (This could indicate the presence of a compact cluster made up of several stars, but firm conclusions require further observations).
2.3 Structure and emission spectrum of S3
We constructed an entire series of monochromatic images of the bright core of the nebula in the He II 4686Å, [O III] 5007Å, [S II] 6717+6731Å, and H lines by obtaining Gaussian fits to the emission lines. The results are shown in Figs. 1c–1f. All the line profiles are fit well by single Gaussians, and do not show any systematic deviations. Note, however, that the expected relative gas velocities (up to in the bright core Paper I) are appreciably lower than the spectral resolution of our data ().

It is evident from Fig. 1 that the morphology of the nebula is appreciably different in different lines. For example, the He II brightness peak is coincident with the position of the WO star; the He II brightness decreases with distance from the star, and the full size of the emission region is . The situation is quite different in the brighter [O III] and H lines, and also in the [S II] lines: the corresponding images exhibit several bright clumps from the star (Fig. 1). The [O III] and H images show two well-defined bright clumps north and northwest of the star (marked A and B, respectively, in Fig. 1b), and a more extended clump northeast of the star (clump C). This extended clump is especially prominent in the [S II] images, where clump A cannot be seen at all.
We discovered the clumpy structure of the S3 core in our earlier study in Paper I, based on uncalibrated [O III] and H images of the region. However, having no emission spectra for the clumps, we mistook the WO star for a clump (clump No. 2 in Paper I). Clumps A and B from our new observations correspond to clumps 3 and 1, respectively, from Paper I; clump C, which can be confidently identified only in the [S II] lines, was not discovered earlier in the [O III] and H images.
We obtained the integrated spectra of clumps A, B, and C; the positions of the image elements whose spectra were co-added in each clump are shown in Fig. 1b. Table 3 gives the relative line intensities for the three clumps, corrected for selective extinction. We assumed c(H) = 0.1 and E(B–V)=0.069, in accordance with KB95. For comparison, Table 3 also presents the data of KB95 for the integrated spectrum of the central region of S3.
2.4 Ionized Gas Velocities in the Core of S3
We used the resulting spectra to construct the radial-velocity field for the central part of the nebula S3. We determined the velocity fields from measurements made in the main spectral lines from Gaussian fits to the corresponding line profiles. Analysis of the night-sky spectrum showed that, after linearization of the spectra, there remained systematic velocity variations in the night-sky lines across the field of channels, i.e., about . We corrected our emission-line velocity fields for this systematic offset; Fig. 2 shows the results.
We used the resulting velocity fields to estimate the mean velocities in various lines for clumps A, B, and C and for the nebula region projected onto the WO star. In this last case, we used the same set of lenses used when co-adding the spectrum of the star (see Section 2.2.). The results are summarized in Table 4, where the quoted errors correspond to the velocity dispersion within individual spatial elements.
| line | F | EW (Å) | |||
|---|---|---|---|---|---|
| (Å) | This paper | KB95 | This paper | KB95 | |
| 4659 | C IV+He II | ||||
| 5290 | O VI | ||||
| 5411 | He II+C IV | ||||
| 5470 | C IV | ||||
| 5590 | O V | ||||
| 5801 | C IV | ||||
| Line | |||||
| (Å) | A | B | C | KB95 | |
| 4686 | He II | 23.1 | |||
| 4711 | [Ar IV] | 4.5 | |||
| 4740 | [Ar IV] | 5.62 | |||
| 4861 | 100.0 | ||||
| 4959 | [O III] | 188 | |||
| 5007 | [O III] | – | |||
| 5876 | He I | 7.1 | |||
| 6542 | [N II] | – | |||
| 6563 | 276 | ||||
| 6583 | [N II] | 6.4 | |||
| 6717 | [S II] | 8.73 | |||
| 6731 | [S II] | 5.78 | |||
The resulting mean clump velocities are consistent with the mean velocity of the nebula S3 as a whole derived from our Fabry-Perot interferometric measurements (, Paper I, taking into account possible systematic absolute calibration errors of for the interferometric observations), and are in full agreement with the measurements of Tomita et al. (1993), based on a single spectrogram of S3: to . We show below (see Section 3) that the velocities of the densest H I clouds in the vicinity of S3 are or differ from this value by less than .
Two cone-shaped regions where the velocities are systematically different from the mean are immediately apparent in Fig. 2. Our [O III] line measurements enable identification of the region where the velocities differ from the mean value by . Both deviations from the mean velocity agree with the velocity variations in the central part of the bright nebula S3 presented in Paper I, based on interferometric H measurements. Note that the cone-shaped regions originate at the position of the star, a pattern that, generally speaking, might indicate an asymmetric stellar wind. However, firm conclusions require further observational evidence, since such velocity variations could also be a consequence of the inhomogeneous structure of the interstellar medium in the near environment of the star.
| Lines | ||||
|---|---|---|---|---|
| A | B | C | WO | |
| HeII 4686 | ||||
| [OIII]4959 | ||||
| [OIII]5007 | ||||
| [SII] 6717 | ||||
3 Radio observations in the 21-cm line
3.1 Observations and Data Reduction
We constructed a high angular resolution VLA H I map covering an extended region of the galaxy IC 1613, including the WO star and the associated bipolar shell (this was part of a large project to investigate the neutral-gas structure and kinematics in IC 1613 by Wilcots et al., in press). The maps shown below were constructed from combined B, C, and D-array VLA observations with a velocity resolution of . The data were Hanning smoothed, subjected to the usual calibration procedure, and made into maps using the AIPS package. The results are represented in the form of a data cube with angular resolution , which corresponds to a linear resolution of 23 pc.
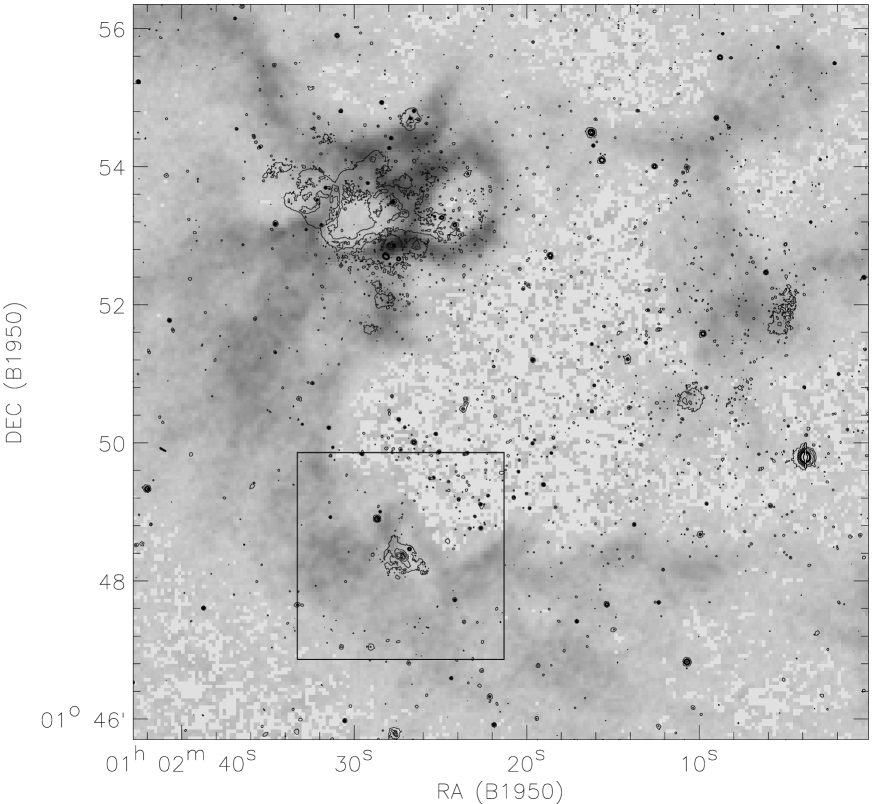
Figure 3 shows the H I distribution for the eastern sector of the galaxy constructed using these data. A well-defined giant cavity (supercavity) surrounding a large fraction of the stellar population of IC 1613 is immediately apparent. This giant, low surface brightness region of 21-cm emission is also visible on the map of Lake & Skillman (1989). Earlier Paper I, we suggested that this region was deficient in neutral gas because it had been swept out, implying that the supercavity should be surrounded by a dense, wind-blown shell. Figure 3 shows that such a shell or ring of neutral gas does, indeed, exist, and that the WO star resides in a dense gas layer near its inner edge.
The angular size of the supercavity is about , corresponding to a linear size of 1 kpc. The characteristic thickness of the shell is , or 200–350 pc.
A sketch of the bipolar ionized shell surrounding the WO star and its relative position with respect to the H I supercavity are shown on an enlarged scale in Fig. 4, which presents the southeastern sector of the H I ring. This figure shows that the core of the ionized bipolar shell (previously known as S3) and its bright southeastern component are located in a dense region of the ring, whereas the extended, faint northwestern component is in the low-density medium inside the supercavity.
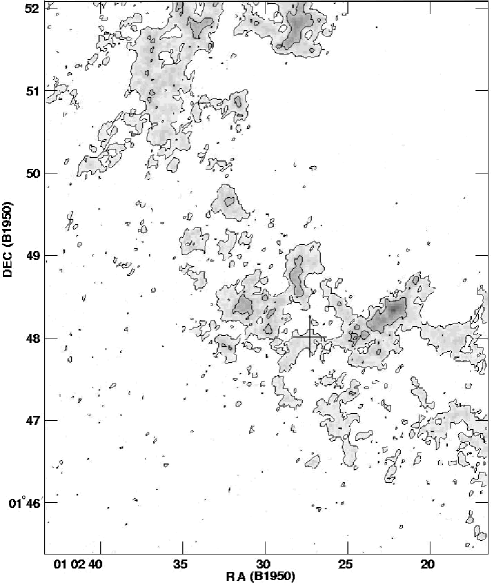
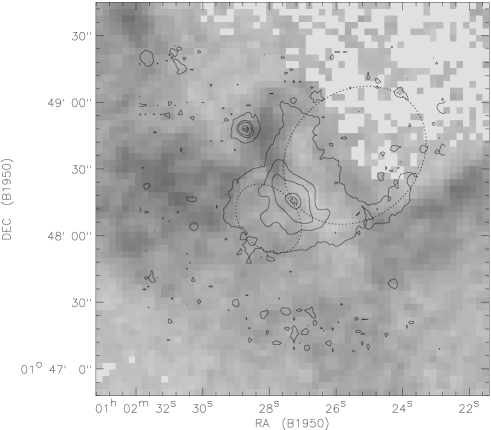
Figure 4 clearly shows a local decrease in the 21-cm brightness, filled by the ionized gas of the core and southeastern component. We can also see two prominent, extended H I features just on the outside of the two sides of the northwestern component of the ionized shell, which reproduce the shape of the shell. This structure probably provides evidence for a local neutral shell surrounding the bipolar shell.
The parameters of the most prominent H I clouds forming the local neutral shell surrounding the ionized bipolar feature are summarized in Table 5, which presents the central coordinates, total mass, and maximum column density of each cloud.
| Clouds | RA(B1950) | Dec(B1950) | N(HI), | |
|---|---|---|---|---|
| a | 1 02 28 | 1 47 55 | ||
| b | 1 02 31.5 | 1 48 20 | ||
| c | 1 02 21-24 | 1 48 08 | ||
| d | 1 02 26 | 1 48 20 | ||
| e | 1 02 28 | 1 48 30-60 |
3.2 Neutral Gas Velocities
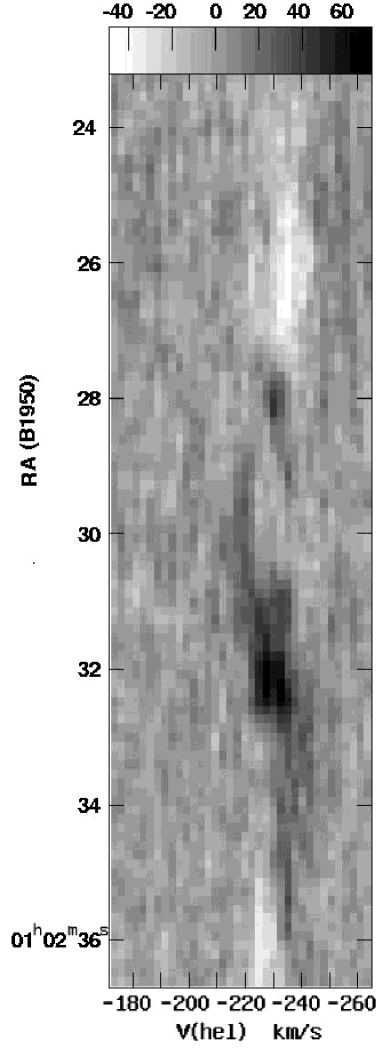
In order to reveal the possible effect of the expansion of the local neutral shell, we constructed the radial-velocity distribution within a right-ascension band passing through the WO star (Fig. 5). The band is wide and therefore includes all clouds making up the local shell. This distribution clearly demonstrates velocity variations with distance from the star that are typical of an expanding shell (the so-called ‘velocity ellipse’) at right ascensions from to . This region corresponds to the part of the local H I shell that is east of the WO star; the characteristic radius of this ‘half-shell’ is 100–140 pc. The velocity difference between the two sides of the neutral shell is , suggesting an expansion velocity of . The velocities of the densest ‘unaccelerated’ H I clouds in a large region surrounding the WO star are V.
4 Discussion
The results of spectroscopic observations of the WO star and the central region of the nebula S3 reported in this paper are in full agreement with earlier observations, within the errors, when the different slit locations are taken into account. The spectra of the compact clumps identified in this paper do not differ significantly from the those of the nebula S3 (see Garnett et al. (1991), KB95 and references therein). The relative line intensities listed in Table 3 are suggestive of a typical H II region ionized by a star with high effective temperature. The observed differences between the spectra of the three clumps could be due to different excitation conditions: distance from the exciting star and electron density. No shock signatures were found either in the emission spectra (the [N II] and [S II] lines are weak) or in the mean velocities of the bright clumps. The ionized gas velocities of the clumps in the central core of the nebula agree with velocity measurements of neutral gas clouds in the vicinity of the bipolar shell.
4.1 Electron density and He abundance in the nebula core.
The relative intensities of the [S II] doublet can be used to estimate the electron density in the three bright clumps identified in this paper. We determined the electron densities in clumps A, B, and C using formulas adopted from De Robertis et al.(1987), assuming that the electron temperature of the nebula is K (as determined in KB95 from [O III] 4959/4363Å line intensities). The resulting values are listed in Table 6.
We derived the He abundance in the nebula from He I and He II line intensities of individual clumps using the diagnostic relations and recombination coefficients for hydrogen and helium from Kholtygin (1997),. We determined the relative helium abundances N(He+)/N(H) and N(He++)/N(H) and the total helium abundances N(He)/N(H) (in number) of the clumps. The results are given in Table 6, which also lists data adopted from KB95. We can see that our abundances coincide with those of KB95, and are in good agreement with the estimate of Davidson& Kinman (1982): N(He)/N(H) = . (In both Davidson & Kinman (1982) and KB95, the He abundances were obtained from the spectrum of the entire bright core of the nebula without subdividing it into individual clumps).
4.2 Velocity of the stellar wind of the WO star.
One of the major parameters determining the structure and kinematics of the interstellar medium at large distances from WR stars is the stellar-wind velocity. Kingsburgh et al.(1995) have shown (see also KB95) that the halfwidth of the C IV 5801Å line at zero intensity is a good estimator of the terminal wind velocities of WR stars. The C IV line halfwidth at zero intensity measured from our spectra for the WO star yields a terminal wind velocity of , which is virtually coincident with the value obtained in KB95, given that the accuracy of our measurements is determined by the width of the spectral channel (). We thus confirm the conclusion of KB95 that the terminal wind velocity of the WO star in IC 1613 is the lowest among the six objects of this class currently known in the Local-Group galaxies.
4.3 Large-scale Structure of the Interstellar Medium.
In principle, the giant H I ring shown in Fig. 3 could be the projection onto the plane of the sky of a shell or torus. A torus could be the result of the wind-blown supercavity breaking out of the gaseous disk of the galaxy. In both cases, the neutral gas ring surrounding the supercavity displays a characteristic filamentary structure. The filamentary system making up the H I ring bifurcates at its southeastern end. A system of arc-like filaments with characteristic lengths of , or 200–300 pc, is also apparent. This filamentary pattern undoubtedly testifies to the action of dynamically active processes that are responsible for the formation of the supercavity and the surrounding dense ring or shell. This large-scale structure apparently formed as the result of a burst of star formation in the region. However, determining the nature of this burst is a separate problem, which lies beyond the scope of this paper. Of interest to us here is the very existence of such a dense shell or torus surrounding the supercavity, since we consider this large-scale mass distribution to be responsible for the unique bipolar structure of the extended ionized shell associated with the WO star.
| A | B | C | KB95 | |
|---|---|---|---|---|
| 170 | 80 | 100 | ||
| N(He+)/N(H) | 0.051 | 0.057 | 0.067 | 0.057 |
| N(He++)/N(H) | 0.028 | 0.025 | 0.011 | 0.025 |
| N(He)/N(H) | 0.079 | 0.082 | 0.078 | 0.082 |
Lozinskaya (1997) suggested that the bipolar structure of the ionized shell surrounding the WO star might be the result of a strong stellar wind breaking out of the dense gas layer. Earlier Paper I, we associated this dense layer with a hypothetical wind-blown shell, which we suggested should surround the giant H I-deficient region in IC 1613 seen on the map of Lake & Skillman(1989). However, only in this paper have we finally been able to provide some evidence supporting this hypothesis. The following factors form our principal arguments.
-
1.
One piece of evidence is the relative orientation of the bipolar ionized shell with respect to the H I supercavity. It is clear from Fig. 4 that the bright core of the nebula is extended along the boundary of the dense H I ring; the smaller southeastern component of the ionized bipolar shell lies inside a dense neutral gas layer, and the extended northwestern component lies in the low-density medium inside the supercavity.
-
2.
Afanas’ev et al. (2000) showed that the southeastern component is brighter than the northwestern component, and also has a lower expansion velocity.
-
3.
The local cavity and extended H I features whose discovery is reported in this paper testify to the presence of a neutral shell surrounding the ionized bipolar shell, providing direct evidence for a physical association of the WO star and the ionized bipolar shell with the supercavity and dense H I ring (the only alternative being a chance projection).
The gas density in the clouds making up the local H I shell surrounding the bright central and southeastern components of the ionized nebula can be derived from our maximum column density and total mass estimates, assuming that the clouds have the same sizes in the line-of-sight and transverse directions. The clouds that make up the local neutral H I shell have irregular structures. Clouds a, b, and e in Table 5, which make up the expanding part of the H I half-shell, have lengths in the plane of the sky ranging from 40 to 120 pc. For a column density of cm-2, this yields a characteristic density of cm-3.
For comparison, we present estimates of the average density of ionized gas in this nebula: Davidson & Kinman (1982) found cm-3 based on the H emission of the central of the nebula S3; Kenicutt (1984) reports cm-3 based on a study of the integrated H emission of the bright nebula; and Goss & Lozinskaya (1995) found cm-3 from their analysis of its thermal radio emission.
If the H I clouds surrounding the bright central and southeastern components of the bipolar ionized shell are, indeed, parts of a shell of neutral gas blown out by the stellar wind, the radius and expansion velocity of the expanding section east of the WO star should be pc and about , respectively (see Section 3.2). In the standard model (Castro et al.,1975; Weaver et al.,1975), we find the kinematic age of the wind-blown neutral shell to be yr. (Note that this estimate depends neither on the stellar wind power nor on the density of the surrounding gas). This age substantially exceeds the duration of the final WO stage, and corresponds to the main-sequence lifetime of a massive star (). We thus conclude that the local neutral shell surrounding the bright southeastern and central components of the ionized nebula could have been produced by the stellar wind of the WR progenitor when it was still a main-sequence star. Note that, earlier Paper I, we concluded that the ionized bipolar shell was blown out by the successive action of the stellar wind from the central star, first at the WR and then at the WO stage.
Our estimates indicate that the terminal velocity of the stellar wind of the WO star reaches (see Section 4.2); a mass-loss rate of /yr was derived in KB95 based on the relation between the He II line luminosities and mass-loss rates for two WO stars. Accordingly, the power of the stellar wind of the WO star in IC 1613 is erg/s. In all likelihood, the wind power was a factor of two to three lower during the earlier WR stage (WR stars have typically terminal velocities of ), but the duration of the WR stage ( yr) is at least an order of magnitude longer than that of the WO stage. The power of the stellar wind of the main-sequence progenitor could have been two orders of magnitude lower than at the final Wolf-Rayet stage, however, the main-sequence lifetime was at least an order of magnitude longer than the Wolf-Rayet stage.
The formation of the wind-blown shell is determined by the standard relation:
, where is the power of the stellar wind in units of erg/s, the density of the surrounding gas, the radius in pc, and the time in units of yr (Castro et al.,1975; Weaver et al.,1975). We can easily see that, although the mechanical energy inputs from the massive star during the WR and WO stages are comparable, the stellar wind produced during the main-sequence stage is capable of creating a larger shell than the powerful but short-lived stellar wind at the final stage. Therefore, this latter wind serves as an additional source of mechanical energy in an already formed, slowly expanding shell.
Our results for the two extended arc-like H I clouds surrounding the northwestern component of the ionized shell are much less conclusive. On the one hand, these formations could be the result of the stellar wind of the WO star and its progenitor breaking into the tenuous gas inside the supercavity. Our measurements, indeed, indicate that the H I surface density inside the supercavity is at least an order of magnitude lower than in the clouds listed in Table 5. The thickness of the emitting gas layer can be taken to be twice that of the supershell in the plane of the sky; i.e., about (600–700 pc), according to Fig. 3. Accordingly, we find the mean gas density in the supercavity to be cm-3. If the observed ring-shaped H I distribution is the projection of a thick torus rather than a shell, the size of the emission region should be even larger, so that the above estimate should be considered an upper limit to the gas density inside the supercavity. The same standard relation yields a radius of pc for a shell blown out in the tenuous medium of the estimated density over the time yr found above. This agrees with the observed size of the northwestern part of the local shell outlind by two extended arc-like H I clouds in Fig. 4.
On the other hand, the formation of such an arc-like structure outlined by these extended H I clouds could be the result of the collective stellar winds (and possible supernova explosions) from association No. 9 of the list of Hodge (1978), which is adjacent to and inside the supercavity. (This association is the largest in size and the richest in the galaxy). In this case, the stellar wind and ionizing radiation of the WO star act inside this already formed arclike feature.
We plan a detailed analysis of the kinematics of the ionized and neutral gas components in this region, and a comparison with the stellar population. This study should lead to unambiguous conclusions about the nature of the arclike formation and the possible genetic relation between the WO star and the association.
5 Conclusions
We have observed the central part of the nebula S3 surrounding the WO star (field spectroscopy with the 6-m telescope) and an extended surrounding region more than one kpc in size (21-cm VLA observations). We have mapped the brightness of the central nebula in the main spectral lines and constructed the radial-velocity distribution based on H and [O III] 5007Å line measurements.
We identified three compact clumps, and determined their integrated spectra, mean velocities, and electron densities. Our spectroscopic data for both the WO star and the central region of S3 are in agreement with previous observations (see Garnett et al.(1991), KB95 and references therein). The relative line intensities in the spectrum of the nebula are indicative of pure recombination emission from a highly excitated H II region.
We analyzed the structure and kinematics of the neutral gas in an extended region around IC 1613 that includes the WO star and the associated ionized bipolar shell. A giant, dense shell or toroidal formation of neutral gas about 1.5 kpc in size surrounds the H I supercavity. This giant structure was very likely produced by a burst of star formation in this region.
We also discovered for the first time a local deficiency in the brightness of the 21-cm line and two extended H I features, providing evidence that the extended ionized bipolar shell associated with the WO star (Lozinskaya, 1997 and Paper I) is, in turn, surrounded by a local shell of neutral gas. The mass and expansion velocity of this shell indicate that it was blown out by the stellar wind of the WO progenitor when it was still a main-sequence star.
Our new observations support a scenario in which the extended bipolar structure was produced by the stellar wind of the WO star residing in the dense ‘wall’ of the supercavity. The arclike structure of the extended H I clouds just outside the faint northwestern component of the ionized shell might have been shaped by the collective stellar wind (and supernova explosions?) of Hodge’s (1978) association no. 9. In this case, the wind and ionizing radiation of the WO star act inside this previously formed arclike structure.
-
Acknowledgements.
This work was supported by the Russian Foundation for Basic Reearch (project code 98-02-16032) and the Astronomy State Science and Technology Program (project no. 1.3.1.2). The National Radio Astronomy Observatory is a facility of the National Science Foundation operated under cooperative agreement with Associated Universities, Inc. We are grateful to E. Blanton for sharing the H line image of IC 1613 taken at Kitt Peak National Observatory, E. E. Gerasimenko for supporting the observations at the 6-m telescope of the Special Astrophysical Observatory of the Russian Academy of Sciences, and the Program Committee of the 6-m telescope for providing the observing time for this project.
References
-
[1]
Afanasiev, V.L., Lozinskaya, T.A., Moiseev, A.V., Blanton, E., 2000, Astronomy Letters, 26, 153,
(astro-ph/0011385), Paper I -
[2]
Afanasiev, V.L., Vlasyuk, V.V., Dodonov, S.N.,
Sil’chenko, O.K., 1990, preprint of SAO RAS, 54, 1990 - [3] Armandroff, T.E., & Massey, P., 1985, ApJ, 291, 685
- [4] Barlow, M.J., & Hummer, D.C.,1982, in ”Wolf-Rayet Stars: Observations, Physics, and Evolution”, IAU Symp. 99, ed. by C. W. H. de Loore and A. J. Willis (Reidel, Dordrecht), 387
- [5] Castor, J., McCray, R., Weaver, R., 1975, ApJ, 200, L107
- [6] D’Odorico, S., & Rosa, M.,1982, A&A, 105, 410
- [7] Davidson, K., & Kinman, T.D., 1982, PASP, 94, 634
- [8] De Robertis, M.M., Dofour R.J., Hunt R.W., 1987, J.Roy. Astron.Soc.Can., 81, 195
- [9] Dopita, M.A., McGregor, P.J., Lozinskaya, T.A., Rawlings, S.J.,1990, ApJ, 351, 563.
- [10] Garnett, D.R., Kennicutt, R.C., Chu, Y.-H., Skillman, E. D., 1991, ApJ, 373, 458
- [11] Goss, W. M., Lozinskaya, T.A., 1995, ApJ, 439, 637
- [12] Hodge, P., Lee, M.G., Gurwell, M., 1990, PASP, 102, 1245
- [13] Hodge, P.W., 1978, ApJS, 37, 145
- [14] Hunter, D.A., Hawley, W.N., Gallagher, J.S., 1993, AJ, 106, 1797
- [15] Kennicutt, R.C., 1984, ApJ, 287, 116
- [16] Kholtygin A.F., 1997, Astron. Asroph.Transact., 12, 85
- [17] Kingsburg, R.L., Barlow, M.J., Storey, P.J., 1995, A&A, 295, 75
- [18] Kingsburgh, R.L., Barlow, M.J., Storey, P.J., 1995, A&A, 295, 75
- [19] Kinsburgh R. L., & Barlow M.J., 1995, A&A, 295, 171 , KB95
- [20] Lake, G., Skillman, E.D., 1989, AJ, 98, 1274
- [21] Lozinskaya, T.A., 1997, Astrophysics. Space Sci., 252, 199
- [22] Maeder, A., & Meynet, G., 1989, A&A, 210, 155
- [23] Melnik, J., & Heydari-Malayeri M., 1991, in ”WR Stars and Interrelations with Other Massive Stars in Galaxies”, IAU Symp. 143, ed. by K. A. Van der Hucht and B. Hidayat (Kluwer, Dordrecht), 409
- [24] Polcaro, V.F., Viotti, R., Rossi,C., Norci,L., 1992, A&A, 265,563
- [25] Polcaro, V.F., Giovanelli, F., Manchanda, R.K., et al., 1991, A&A, 252, 590
- [26] Saha, A., Freedman, W.L., Hoessel, J.G., Mossman, A.E. 1992, AJ, 104, 1072
- [27] Sandage, A.R., 1971, ApJ, 166, 13
- [28] Smith, H.E., 1995, ApJ, 199, 591
- [29] Tomita, A., Ohta, K., Saito, M., 1993, PASJ, 45, 693
- [30] Torres, A.V., Conti, P.S., Massey, P.,1986, ApJ, 300, 379
- [31] Weaver, R., McCray, R., Castor, J. et al., 1977, ApJ, 218, 377