The Clustering of AGN and Galaxies at Intermediate Redshift
Abstract
Galaxies in the environments of 69 selected AGN have been imaged to . By applying photometric redshifts and color selection criteria to the galaxy catalogue, the AGN-galaxy cross-correlation function has been measured as a function of galaxy type. The spatial cross-correlation of AGN with red (early-type) galaxies is comparable to the autocorrelation function of elliptical galaxies at low redshift. In contrast, the cross-correlation of AGN with blue (late-type) galaxies is weak and has been detected with low significance. As blue galaxies dominate galaxy catalogues, the cross-correlation of selected AGN with all galaxies is weak at intermediate redshifts.
1 Introduction
The association of Active Galactic Nuclei hosts with other galaxies is well established (Bahcall et al., 1969; Yee and Green, 1987; Hall and Green, 1998; Laurikaninen and Salo, 1995; Smith et al., 1995, 2000) and provides constraints on the models for the formation and fueling of AGN. In addition, as QSOs can be used to trace large-scale-structure at (Boyle et al., 1999), estimates of the QSO environments are required to estimate their bias with respect to galaxies which are used to trace large-scale-structure at .
Several previous studies of AGN environments are summarized in Table 1. Radio-loud AGN are typically found in environments comparable to galaxy clusters (Yee and Green, 1987; Hall and Green, 1998; Wold et al, 2000) while radio-quiet AGN appear to be associated with poorer environments similar to field galaxies (Laurikaninen and Salo, 1995; Smith et al., 1995; De Robertis et al., 1998). While the radio-quiet AGN-galaxy cross-correlation function is comparable to the clustering of field galaxies (Smith et al., 2000), it has only been detected with significance (Ellingson et al., 1991; Teplitz et al., 1999; Smith et al., 2000) and no detailed information is available on the strength or evolution of galaxy clustering around radio-quiet AGN at these redshifts.
Previous studies of AGN environments have typically used galaxy catalogues derived from single band imaging. Galaxy evolution and corrections result in a changing morphological mix of galaxies as a function of redshift and depth. As galaxy clustering is correlated with morphology and color, the clustering properties of galaxies are also a function of redshift and the observer’s bandpass. It is therefore plausible that estimates of AGN environments at have been biased by the changing properties of the galaxy catalogues selected from single band imaging. By using color selection, it is possible to select the same galaxy type as a function of redshift. By measuring the cross-correlation function of AGN with early and late-type galaxies, it is possible to determine if radio-quiet AGN are in unusual environments.
2 Data
2.1 The Galaxy Sample
The galaxy sample has been previously used by Brown et al. (2000) to measure the clustering of galaxies as a function of color and a more detailed description of the catalogue is provided by Brown et al. (2000) and Brown (2000). The image data consists of images of the South Galactic Pole (SGP) and UK Schmidt field 855 (F855). The images were produced by stacking SuperCOSMOS scans of UK Schmidt photographic plates in , , and bands. Object detection, instrumental photometry and faint object star-galaxy classifications were determined with SExtractor Bertin and Arnouts (1996). Photometric calibration of the data was determined with CCD images and published photometry. To prevent dust extinction introducing spurious large-scale-structure, magnitude estimates are corrected with the extinction estimates of Schlegel et al. (1998). The final galaxy catalogues are complete to and contain galaxies per field.
2.2 The AGN Sample
The AGN sample consists of 69 selected broad emission line AGN from La Franca et al. (1999). The survey area is the SGP field and while the catalogue does not have homogeneous sky coverage, it is not strongly concentrated in any one part of the field. As the F855 field only contains 7 AGN with published positions (Veron-Cetty and Veron, 2000), the F855 field has not been used to measure AGN-galaxy clustering. AGN positions were determined by selecting objects in the stacked SuperCOSMOS scans within of the published positions. The resulting catalogue of AGN contained 69 objects with colors. The absolute magnitudes and redshifts of the AGN are plotted in Figure 1. The catalogue contains 36 QSOs ( where ) and 33 Seyfert 1 galaxies. Five of the AGN are within of sources detected by the NVSS (Condon et al., 1998) but all have fluxes less than and luminosities less than .
2.3 Photometric Redshifts
Approximately galaxy redshifts in the SGP and F855 fields are available from the NED database. Spectroscopic redshifts are available for galaxies as faint as so it possible to use multicolor photometry and spectroscopic redshifts of galaxies in the SGP and F855 fields to calibrate the photometric redshifts. The relationship between the multicolor photometry and the galaxy redshift was determined by fitting quadratic functions to the data (Connolly et al., 1995). The relationship was determined for , , and photometry as only a small fraction of the catalogue is detected in all 4 bands. Figure 2 shows a comparison photometric redshifts and the spectroscopic redshifts for galaxies in the two fields. While photometric redshifts are poorer than photometric redshifts derived in 3 or more bands, they do place useful constraints on the redshifts. Error estimates for the photometric redshifts have been determined by the measuring the rms of the residuals as a function of photometric redshift and color. The accuracy of the photometric redshifts is a function of galaxy color and, as shown in Figure 3, red galaxies have comparatively small errors.
2.4 Color Selection
A significant bias present in most studies of the AGN environment is that they have relied on small samples or single band imaging. Galaxy evolution and corrections result in a changing morphological mix of galaxies as a function of limiting magnitude with single band imaging. Galaxy catalogues in bands bluer than are dominated by weakly clustered (blue) late-type galaxies at magnitudes fainter than (Efstathiou et al., 1991).
Multicolor imaging provides significant advantages for the study of the AGN host environment. Colors and photometric redshifts can be used to select particular galaxy types at faint magnitudes. As galaxy clustering is strongly correlated with color (Brown et al., 2000) and morphology (Davis and Geller, 1976; Loveday et al., 1995), studying the cross-correlation of AGN with particular galaxy types should help determine if AGN hosts are in unusual galaxy environments.
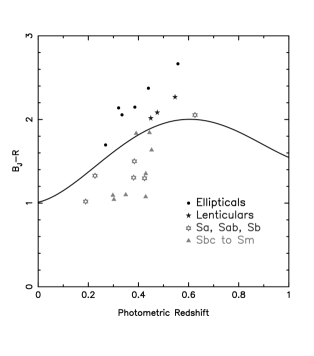
The color criteria applied to the galaxy catalogue select galaxies redder or bluer than a non-evolving Sbc in where the color as a function of redshift is determined with corrections from Coleman et al. (1980). The use of rather than shallower or allows the selection of early-type galaxies at . As the selection criteria are a function of redshift, photometric redshifts are used to determine the correct value of when selecting galaxies. For the remainder of this paper, the early and late subsamples will refer to galaxies redder and bluer than the selection criteria. Figure 4, a plot of the colors and photometric redshifts of galaxies in the SGP with HST morphologies (Abraham et al., 1996; Smail et al., 1997), shows that the color selection criteria are capable of selecting different types of galaxies.
3 The Angular and Spatial Correlation Functions
The angular correlation function estimates the fractional excess of object pairs at a given angular separation compared with what would be expected for a random distribution of objects. The estimators of the angular correlation function used in this paper require random object catalogues which are produced by making copies of the galaxy catalogue and randomly repositioning the copied galaxies across the field.
The angular autocorrelation function of galaxies is estimated with
| (1) |
(Landy and Szalay, 1993) where , and are the number of galaxy-galaxy, galaxy-random and random-random pairs at angular separation . The Landy and Szalay (1993) estimator is only applicable to the autocorrelation function so the AGN-galaxy (and early-late) cross-correlation function is determined with
| (2) |
where and are the number of AGN-galaxy and AGN-random pairs at angular separation . The random errors of , and are reduced by taking the average of multiple estimates of each parameter where each estimate has been determined with a different random object catalogue. Both estimators of the angular correlation function satisfy the integral constraint,
| (3) |
(Groth and Peebles, 1977), resulting in an underestimate of the angular correlation function. To remove this bias from the correlation function, the term
| (4) |
is added to the estimate of the correlation function. The term does require an assumption of the form of the correlation function to correctly estimate the value of correlation function.
Galaxy angular correlation functions are typically approximated by power-laws where
| (5) |
where is a constant and . The corresponding spatial correlation function is given by
| (6) |
where is the separation of the galaxies in physical coordinates and and are constants. For and , the clustering properties are fixed in physical and comoving coordinates respectively. The relationship between the angular and spatial correlation functions is given by Limber’s equation (Limber, 1954). If when , then Limber’s equation is given by
| (7) | |||||
(Phillipps et al., 1978) where and are the redshift distributions of each set of objects (e.g. the early and late subsamples) and is the distance between two objects at and separated by angle on the sky. For the AGN-galaxy correlation function, the redshifts of each AGN are known so Limber’s equation can be written as
| (8) | |||||
where is the number of AGN, is the number of galaxies per unit redshift and is the distance in physical coordinates between an AGN at redshift and a galaxy at redshift separated by angle on the sky.
4 The Clustering of Faint Galaxies
Estimates of the clustering of galaxies are required if the environment of AGN hosts is to be compared to the “normal” galaxy environment. To make the comparison valid, the same galaxy selection criteria are applied to the study of galaxy-galaxy clustering as AGN-galaxy clustering. The early and late subsample autocorrelation functions and the early-late cross-correlation functions have been determined in the SGP and F855 fields. Plots of the angular correlation functions are shown in Figure 5. The amplitudes and values of the as a function of magnitude are summarized in Tables 2 to 4. The value of and the amplitude of the clustering strongly depend on color (Brown et al., 2000). The observed clustering in the SGP is consistently stronger than the observed clustering in F855 at bright magnitudes. However, at fainter magnitudes the difference between the clustering properties in the two fields is significantly reduced and the late subsample autocorrelation functions are comparable. At faint magnitudes, the estimates of for the early-late cross-correlation function in the SGP and F855 fields differ by . It is possible that this is due to the cross-correlation function estimator having larger errors than predicted by the Poisson estimate (Landy and Szalay, 1993). Also, at faint magnitudes in the F855 field, the early-late cross-correlation function is comparable to the expected variations in the galaxy number counts introduced by errors in the dust extinction estimates.
To determine the spatial correlation function, an estimate of the redshift distribution is required. Estimates of the redshift distribution derived from luminosity functions, corrections and evolution models are subject to uncertainties as a range of models can reproduce the observed number counts. Models which assume a shape for the redshift distribution (Baugh and Efstathiou, 1993) are useful for single band imaging of low redshift galaxies but are not as effective for multicolor selected samples at higher redshifts where the selection criteria and corrections skew the redshift distribution.
Photometric redshifts contain information on the redshift distribution but assume that galaxies with the same colors and magnitudes are at the same redshifts. If the errors of the photometric redshifts are dominated by the redshift distribution of galaxies with the same multicolor photometry, it should be possible to derive a redshift distribution using the measured errors of the photometric redshifts. The redshift distribution has been estimated by smoothing the photometric redshift distribution with a Gaussian where the of the Gaussian is given by the rms of the errors of the redshift estimates. At the redshift distribution has been multiplied by to prevent an infinite density of galaxies at . Figure 6 shows the observed redshift distribution of galaxies from Glazebrook et al. (1995) detected in the stacked scans and models derived from their photometric redshifts. There is reasonable agreement between the measured and model distributions, though the galaxy number counts are limited. While the exact redshift distributions have not been determined, it is unlikely that large errors dominate the model redshift distributions.
The estimated redshift distributions of the early and late subsamples are plotted in Figure 7. The photometric redshifts of blue galaxies have large error estimates and this results in the late subsample redshift distribution being significantly broader than the early subsample redshift distribution. The width of the distribution is consistent with late-type galaxies having smaller corrections and a higher fraction of dwarf galaxies than early-type galaxies. It should be noted that while the photometric redshifts are complete to for the early subsample, photometric redshifts for late subsample galaxies are incomplete and this may slightly skew the redshift distribution.
The amplitudes of the early and late autocorrelation functions and early-late cross-correlation function have been plotted in Figure 8. To allow the comparison of the amplitude at different magnitudes, has been fixed for all magnitudes to the average value of for the SGP and F855 correlation functions. Models with the clustering fixed in comoving coordinates have been fitted to the magnitude range for the SGP and F855 fields. The models have been fitted to this magnitude range as it includes a large number of galaxy-galaxy pairs while avoiding systematic errors which could be present near the magnitude limits of the data. Additional estimates of with clustering fixed in comoving and physical coordinates are provided in Table 5.
Figure 8 shows the clustering in the SGP is consistently stronger than the clustering in F855 for galaxies. Before concluding that large-scale-structure is responsible for the observed difference between the clustering in the two fields, it is useful to exclude the most plausible sources of error. Systematic errors in the colors of magnitudes in the two fields only slightly alter the observed clustering in each field and are inconsistent with galaxy number counts, color-color diagrams and published photometry. Large uniform errors in the photometry in all 4 bands can bring the clustering at bright magnitudes into agreement but are also inconsistent with galaxy number counts and published photometry. The Schlegel et al. (1998) dust maps estimate in the F855 field and errors in the dust extinction estimates could introduce systematic errors. However, errors in the dust extinction estimates should produce the largest discrepencies at faint magnitudes where the amplitude of the angular correlation function is small rather than at bright magnitudes.
It is therefore not implausible that the difference between the two fields is due to large-scale-structure. The distribution of galaxy clusters in both fields shows evidence of structures comparable to the field-of-view (Brown et al., 2000; Brown, 2000) and the SGP may contain several “sheets” of galaxies (Broadhurst et al., 1990) though it is uncertain if this is particularly unusual (Kaiser and Peacock, 1991). The effects of large-scale-structure on estimates of the correlation function should decrease with increasing survey volume and this is consistent with the observed difference between the clustering in the two fields decreasing with increasing depth. While it is unexpected to see weakly clustered late subsample galaxies showing the effects of large-scale-structure, the discrepancy between the two fields disappears for bluer galaxies selected with (Brown et al., 2000). As it is uncertain which field is more representative of the Universe, the discussion of AGN-galaxy clustering in the SGP assumes that estimates of could have systematic errors comparable to the difference between the estimates of in the SGP and F855 ().
Models for the clustering of early subsample galaxies in each field are a reasonable approximation to the observed clustering and the estimates of the spatial correlation function are comparable to the clustering of early-type galaxies in the local Universe (Loveday et al., 1995; Guzzo et al., 1997). In contrast, the observed amplitude of the late subsample autocorrelation function is an order of magnitude weaker and the models are a poor fit to the data. At the amplitude of the correlation function rapidly decreases due to the increasing number of weakly clustered faint blue galaxies (Efstathiou et al., 1991; Brown et al., 2000). The amplitude of the early-late cross-correlation function also decreases at faint magnitudes though models of the spatial correlation function are better approximations to the observed clustering. While the values of for the early-late cross-correlation function are similar to those for the late subsample autocorrelation function, the larger value of results in significantly stronger clustering on scales of .
5 AGN-Galaxy Clustering
Estimates of the cross-correlation of AGN with the early and late subsamples are summarized in Table 6. The AGN-early cross-correlation is significantly stronger on scales while on smaller scales the signal-to-noise is poor. Despite the strength of the AGN-early cross-correlation, inspection of Table 6 shows most AGN-galaxy pairs are AGN-late pairs and the cross-correlation of AGN with all galaxies will be similar to the AGN-late cross-correlation function.
The AGN-early and AGN-late angular cross-correlation functions for galaxies are shown in Figure 9. Power-laws with fixed to and have been fitted to the AGN-early and AGN-late data on angular scales . The AGN-early cross-correlation function is strong and the power-law fit is a good approximation to the observed clustering though most of the data points are from the fit. In contrast, the AGN-late cross-correlation is weak and a power-law is a poor fit to the data. From the available data, the amplitude of the AGN-late cross-correlation function can not be reliably measured.
The amplitude of the AGN-early cross-correlation function is plotted in Figure 10 along with models of the cross-correlation with evolution fixed in comoving and physical coordinates. While the amplitude of the angular cross-correlation function is typically less than the early subsample autocorrelation function, the difference between the early subsample and AGN redshift distributions results in the estimates of being significantly higher than that of the early subsample autocorrelation function.
The errors of the estimates are dominated by galaxies along the line-of-sight which are not associated with the AGN. The signal and significance of the correlation function can be improved if the number of unassociated galaxies included in the estimate of are reduced. Early-type galaxies have comparatively small photometric redshift errors so it is possible to define a narrow range of photometric redshifts which could be associated with the AGN. Figure 11 shows the AGN-early cross-correlation function for galaxies with photometric redshifts within of the AGN redshift. The inclusion of photometric redshift constraints has significantly improved the signal-to-noise and the observed correlation function is more consistent with a power-law than Figure 9. While deviations from a power-law have been seen in some estimates of AGN-galaxy correlation functions (Hall and Green, 1998; Croom and Shanks, 1999), there are no statistically significant breaks from a power-law on scales in Figure 11.
The spatial AGN-early cross-correlation can be determined by deriving the redshift distribution of galaxies with photometric redshifts within of each AGN when applying Limber’s equation. The amplitude of the AGN-early cross-correlation and models of the spatial cross-correlation are shown in Figure 12 and the fit to the data point is weaker than in Figure 10. However, the estimate of and the power-law form of the angular correlation function in Figure 11 are consistent with AGN environments being similar to the environments of strongly clustered galaxies such as the early subsample and low redshift ellipticals (Guzzo et al., 1997).
The estimates of are dependent on the assumed value of and it is possible that . If radio-quiet AGN were in spiral galaxies (Hutchings et al., 1984; Malkan et al., 1984) and had similar clustering properties to late subsample galaxies, the value of for the AGN-early cross-correlation function would be . However, when the AGN-early cross-correlation function was fitted with power-laws with , the estimates of increased to which is approximately double the estimate of for the early-late spatial cross-correlation function.
There may be a correlation between AGN luminosity and host galaxy if luminous AGN occur more frequently in early-type galaxies than Seyferts (McLure et al., 1999). If this is the case, the correlation between galaxy morphology and environment may result in a correlation between AGN luminosity and environment. Figure 13 compares the amplitudes of the Seyfert 1 () and QSO () cross-correlation functions with the early subsample. Fits to the data point show Seyfert 1s are correlated with slightly richer environments but difference between the estimates has significance.
6 Discussion
While the detection of radio-quiet AGN in environments similar to early-type galaxies may appear to contradict previous studies at similar redshifts (Yee and Green, 1987; Boyle and Couch, 1993; Croom and Shanks, 1999; Teplitz et al., 1999; Smith et al., 2000), this assumes all studies of AGN-galaxy clustering have used the same galaxy population to measure AGN environments. However, as color selection has been used to select galaxies for this study, the properties of the early and late subsamples will differ significantly from catalogues of galaxies which are selected by observed broadband flux.
Early subsample galaxies contribute of the total galaxy counts at and only of the counts at . If the AGN-late cross-correlation function is assumed to be negligible and the AGN-early cross-correlation function is a power law with , then the AGN-galaxy cross-correlation function should be a power-law with at and at . In redder bands where the early-type galaxies comprise a larger fraction of the total galaxy number counts, stronger clustering will be measured. Early subsample galaxies comprise of the total galaxy counts and the AGN-galaxy correlation function would be expected to be even though the redshift range sampled is comparable to that of galaxies. These estimates of for and limited samples are consistent with measurements of the AGN-galaxy cross-correlation function derived from single band imaging by Yee and Green (1987), Ellingson et al. (1991) and Smith et al. (1995, 2000).
While radio-quiet AGN occur in environments comparable to early-type galaxies, this should not be interpreted as a direct correlation between richness and AGN activity. As shown in Figure 13, there is no evidence for a strong correlation between AGN luminosity and environment. HST imaging of radio-quiet QSOs and X-ray selected AGN indicates of host galaxies have morphologies earlier than Sbc galaxies (McLure et al., 1999; Schade et al., 2000). It is therefore plausible that AGN activity is not significantly effected by the host environment and that the observed strength of the AGN-early cross-correlation function is due to the correlation between galaxy morphology and clustering properties.
The strength AGN-early cross-correlation function implies that it should be detectable at . Using samples of early-type galaxies obtained with CCD mosaics on 4-m class telescopes, it will be possible to measure the evolution of the AGN-early cross-correlation function at . This will provide an estimate of the bias of AGN with respect to galaxies which are used to measure large-scale-structure at lower redshifts. If the clustering properties of AGN are due to the distribution of host galaxy morphologies, the evolution of the AGN-early cross-correlation function will also place strong constraints on the properties of AGN host galaxies as a function of redshift.
7 Summary
The environments of galaxies and 69 AGN have been
measured using photometric redshifts and color criteria to
select galaxy types to . The key conclusions
are
(i) The clustering of early subsample galaxies is strong across the
observed magnitude range with and
.
(ii) The autocorrelation function of late subsample galaxies is weak
and decreases to at . This
is probably due to the increasing fraction of weakly clustered blue
galaxies at faint apparent magnitudes.
(iii) The cross-correlation function of radio-quiet AGN
with early subsample galaxies has been detected with high significance on
scales . The AGN-early spatial cross-correlation function
is stronger than the early subsample autocorrelation function and
is comparable to the clustering of elliptical galaxies at .
(iv) The AGN-late cross-correlation function is very weak and has
been detected with low significance.
As the fraction of late-type galaxies in magnitude limited
samples increases with survey depth, the cross-correlation function
of AGN with all galaxies decreases with increasing magnitude.
(v) The signal-to-noise of AGN-galaxy cross-correlation functions
is significantly improved by using photometric redshifts to
reject galaxies which can not be associated with the AGN from the
correlation function estimate.
(vi) The correlation between AGN optical luminosity and host environment is weak
and has not been detected at a significant level in this work.
8 Acknowledgments
The authors wish to thank the SuperCOSMOS unit at Royal Observatory Edinburgh for providing the digitized scans of UK Schmidt photographic plates. The authors also wish to thank Nigel Hambly, Bryn Jones and Harvey MacGillivray for productive discussions of the methods employed to coadd scans of photographic plates. This research has made use of the NASA/IPAC Extragalactic Database which is operated by the Jet Propulsion Laboratory, California Institute of Technology, under contract with the National Aeronautics and Space Administration. Michael Brown acknowledges the financial support of an Australian Postgraduate Award and the support of the National Optical Astronomy Observatory which is operated by the Association of Universities for Research in Astronomy, Inc., under a cooperative agreement with the National Science Foundation.
References
- Abraham et al. (1996) Abraham, R.G., van den Bergh, S.,Glazebrook, K., Ellis, R.S., Santiago, B.X., Surma, P., and Griffiths, R.E. 1996, ApJS, 107, 1
- Bahcall et al. (1969) Bahcall, J.N., Schmidt, M., and Gunn, J.E. 1969, ApJ, 157, L77
- Baugh and Efstathiou (1993) Baugh, C.M., and Eftstathiou, G. 1993, MNRAS, 283, 1361
- Bertin and Arnouts (1996) Bertin E., and Arnouts S. 1996, A&AS, 117, 393
- Boyle and Couch (1993) Boyle, B.J., and Couch, W.J. 1993, MNRAS, 264, 604
- Boyle et al. (1999) Boyle, B. J., Croom, S. M., Smith, R. J., Shanks, T., Miller, L., and Loaring, N. 1999, in Looking Deep in the Southern Sky, Proceedings of the ESO/Australia Workshop, ed. by R. Morganti and W. J. Couch (Springer-Verlag), 16
- Broadhurst et al. (1990) Broadhurst, T.J., Ellis, R.S., Koo, D.C., and Szalay, A.S., 1990, Nature, 343, 726
- Brown (2000) Brown, M.J.I. 2000, PhD Thesis, University of Melbourne
- Brown et al. (2000) Brown, M.J.I., Webster, R.L., and Boyle, B.J. 2000, MNRAS, 317, 782
- Coleman et al. (1980) Coleman, G.D., Wu, C.C., and Weedman, D.W. 1980, ApJS, 43, 393
- Condon et al. (1998) Condon, J.J., Cotton, W.D., Greisen, E.W., Yin, Q.F., Perley, R.A., Taylor, G.B., and Broderick, J.J. 1998, AJ, 115, 1693
- Connolly et al. (1995) Connolly, A.J., Csabai, I., Szalay, A.S., Koo, D.C., Kron, R.G., and Munn, J.A. 1995, AJ, 110, 2655
- Croom and Shanks (1999) Croom, S.M., and Shanks, T. 1999, MNRAS, 303, 411
- Davis and Geller (1976) Davis, M., and Geller, M.J., 1976, ApJ, 203, 13
- De Robertis et al. (1998) De Robertis, M.N., Yee, H.K.C., and Hayhoe, K. 1998, ApJ, 496, 93
- Efstathiou et al. (1991) Efstathiou, G., Bernstein, G., Katz, N., Tyson, J.A., and Guhathakurta, P., 1991, ApJ, 380, L47
- Ellingson et al. (1991) Ellingson, E., Yee, H.K.C., and Green, R.F. 1991, ApJ, 1991, 371, 49
- Glazebrook et al. (1995) Glazebrook, K., Ellis, R., Colless, M., Broadhurst, T., Allington-Smith, J., and Tanvir, N. 1995, MNRAS, 273, 157
- Groth and Peebles (1977) Groth, E.J., and Peebles, P.J.E., 1977, ApJ, 217, 385
- Guzzo et al. (1997) Guzzo, L., Strauss, M.A., Fisher, K.B., Giovanelli, R., and Haynes, M.P., 1997, ApJ1997, 489, 37
- Hall and Green (1998) Hall, P. B., and Green, R. F. 1998, AJ, 507, 558
- Hutchings et al. (1984) Hutchings, J.B., Crampton, D., and Campbell, B., 1984, ApJ, 280, 41
- Kaiser and Peacock (1991) Kaiser, N., and Peacock, J.A., 1991, ApJ, 379, 482
- La Franca et al. (1999) La Franca, F., Lissandrini, C., Cristiani, S., Miller, S., Hawkins, M.R.S, and MacGillivray, H.T., A&A 1999, 140, 351
- Landy and Szalay (1993) Landy S.D., and Szalay A.S. 1993, ApJ, 412, 64
- Laurikaninen and Salo (1995) Laurikainen, E., and Salo, H. 1995, A&A, 293, 683
- Limber (1954) Limber, D.N. 1954, ApJ, 119, 655
- Loveday et al. (1995) Loveday J., Maddox S.J., Efstathiou G., and Peterson B.A. 1995, ApJ, 442, 457
- Malkan et al. (1984) Malkan, M.A., Margon, B., Chanan, G.A., 1984, ApJ, 280, 66
- McLure et al. (1999) McLure, R.J., Kukula, M.J., Dunlop, J.S., Baum, S.A., O’Dea, C.P., and Hughes, D.H. 1999, MNRAS, 308, 377
- Phillipps et al. (1978) Phillipps S., Fong R., Ellis R. S., Fall S. M., and MacGillivray H. T., 1978, MNRAS, 182, 673
- Schade et al. (2000) Schade, D., Boyle, B.J., and Letawsky, M. 2000, MNRAS, 315, 498
- Schlegel et al. (1998) Schlegel, D.J., Finkbeiner D.P., and Davis M. 1998, ApJ, 500, 525
- Smail et al. (1997) Smail, I., Dressler, A., Couch, W.J., Ellis, R.S., Oemler, A., Butcher, H., and Sharples, R.M. 1997, ApJS, 110, 213
- Smith et al. (1995) Smith R. J., Boyle, B. J., and Maddox, S.J. 1995, MNRAS, 277, 270
- Smith et al. (2000) Smith R. J., Boyle, B. J., and Maddox, S.J. 2000, MNRAS, 313, 252
- Teplitz et al. (1999) Teplitz, H.I., McLean, I.S., and Malkan, M.A. 1999, ApJ, 520, 469
- Veron-Cetty and Veron (2000) Veron-Cetty, M.P., and Veron, P., 2000, ESO Scientific Report, 19, 1
- Wold et al (2000) Wold, M., Lacy, M., Lilje. P.B., and Serjeant, S., 2000, MNRAS, 316, 267
- Yee and Green (1987) Yee, H. K. C., and Green, R. F. 1987, ApJ, 319, 28


| Reference | AGN | Number | AGN | AGN | Galaxy | Correlation |
|---|---|---|---|---|---|---|
| Type | of | Redshift | Magnitudes | Magnitude | Function | |
| AGN | Range | Limit | Estimate | |||
| De Robertis et al. (1998) | Seyferts | 33 | ||||
| Laurikaninen and Salo (1995) | Seyfert 1 | 55 | ||||
| Laurikaninen and Salo (1995) | Seyfert 2 | 49 | ||||
| Yee and Green (1987) | RQ QSOs | 33 | ||||
| Smith et al. (1995) | X-ray QSOs | 169 | ||||
| Yee and Green (1987) | RQ QSOs | 7 | ||||
| Ellingson et al. (1991) | RQ QSOs | 46 | ||||
| This work (AGN-Early) | UBR AGN | 69 | ||||
| Smith et al. (2000) | X-ray QSOs | 83 | ||||
| Boyle and Couch (1993) | QSOs | 27 | No correlation | |||
| Teplitz et al. (1999) | RQ QSOs | 30 | correlation | |||
| Croom and Shanks (1999) | RQ QSOs | 150 | No correlation | |||
| Yee and Green (1987) | RL QSOs | 10 | ||||
| Yee and Green (1987) | RL QSOs | 9 | ||||
| Wold et al (2000) | RL QSOs | 21 | ||||
| Hall and Green (1998) | RL QSOs | 31 | Rich. clusters |
| Field | SGP | F855 | ||||
|---|---|---|---|---|---|---|
| Magnitude Range | ||||||
| 2206 | 2599 | |||||
| 5187 | 5553 | |||||
| 11056 | 11303 | |||||
| 21833 | 21652 | |||||
| 29290 | 27915 | |||||
| Field | SGP | F855 | ||||
|---|---|---|---|---|---|---|
| Magnitude Range | ||||||
| 3854 | 4648 | |||||
| 11952 | 13866 | |||||
| 37785 | 43047 | |||||
| 128278 | 134331 | |||||
| 207390 | 183347 | |||||
| Field | SGP | F855 | ||
|---|---|---|---|---|
| Magnitude Range | ||||
| Correlation | Galaxy Magnitude | Field | () | () | |
|---|---|---|---|---|---|
| Function Samples | Range | ||||
| Early-Early | SGP | 1.90 | |||
| Early-Early | F855 | 1.90 | |||
| Late-Late | SGP | 1.35 | |||
| Late-Late | F855 | 1.35 | |||
| Early-Late | SGP | 1.65 | |||
| Early-Late | F855 | 1.65 | |||
| Early-Early | SGP | 1.90 | |||
| Early-Early | F855 | 1.90 | |||
| Late-Late | SGP | 1.35 | |||
| Late-Late | F855 | 1.35 | |||
| Early-Late | SGP | 1.65 | |||
| Early-Late | F855 | 1.65 |
| AGN-Early | ||||
|---|---|---|---|---|
| Magnitude Range | Angle | |||
| 6 | 81 | |||
| 15 | 281 | |||
| 59 | 1026 | |||
| 272 | 4299 | |||
| 882 | 17203 | |||
| 3704 | 68428 | |||
| 10 | 132 | |||
| 28 | 520 | |||
| 114 | 1956 | |||
| 497 | 8128 | |||
| 1676 | 32371 | |||
| 6881 | 129220 | |||
| AGN-Late | ||||
|---|---|---|---|---|
| Magnitude Range | Angle | |||
| 15 | 320 | |||
| 53 | 1183 | |||
| 263 | 4680 | |||
| 949 | 19111 | |||
| 3812 | 76187 | |||
| 15602 | 303404 | |||
| 42 | 905 | |||
| 175 | 3333 | |||
| 751 | 13747 | |||
| 2805 | 55104 | |||
| 11166 | 221132 | |||
| 45032 | 880067 | |||
| Magnitude Range | Angle | |||
|---|---|---|---|---|
| 1 | 20 | |||
| 10 | 133 | |||
| 38 | 518 | |||
| 126 | 2104 | |||
| 438 | 7947 | |||
| 1704 | 31708 | |||
| 5 | 71 | |||
| 23 | 373 | |||
| 89 | 1388 | |||
| 340 | 5637 | |||
| 1172 | 21818 | |||
| 4661 | 87823 |