Testing the Unified Model with an Infrared Selected Sample of Seyfert Galaxies
Abstract
We present a series of statistical tests done to a sample of 29 Seyfert 1 and 59 Seyfert 2 galaxies selected from mostly isotropic properties, their far infrared fluxes and warm infrared colors. Such selection criteria provide a profound advantage over the criteria used by most investigators in the past, such as ultraviolet excess. These tests were done using ground based high resolution VLA A-configuration 3.6 cm radio and optical B and I imaging data. From the relative number of Seyfert 1’s and Seyfert 2’s we calculate that the torus half opening angle is 48∘. We show that, as seen in previous papers, there is a lack of edge-on Seyfert 1 galaxies, suggesting dust and gas along the host galaxy disk probably play an important role in hiding some nuclei from direct view. We find that there is no statistically significant difference in the distribution of host galaxy morphological types and radio luminosities of Seyfert 1’s and Seyfert 2’s, suggesting that previous results showing the opposite may have been due to selection effects. The average extension of the radio emission of Seyfert 1’s is smaller than that of Seyfert 2’s by a factor of , as predicted by the Unified Model. A search for galaxies around our Seyferts allows us to put a lower and an upper limit on the possible number of companions around these galaxies of 19% and 28%, respectively, with no significant difference in the number of companion galaxies between Seyfert 1’s and Seyfert 2’s. We also show that there is no preference for the radio jets to be aligned closer to the host galaxy disk axis in late type Seyferts, unlike results claimed by previous papers. These results, taken together, provide strong support for a Unified Model in which type 2 Seyferts contain a torus seen more edge-on than the torus in type 1 Seyferts.
1 Introduction
The Unified Scheme is based on the idea that the nuclear engine is surrounded by a dusty molecular torus, with orientation angle being the parameter which determines whether an AGN is perceived by observers as a Seyfert 1 or as a Seyfert 2 (Antonucci 1993; Urry & Padovani 1995, Wills 1999). This scenario is supported by several lines of evidence, like the detection of polarized broad emission lines in Seyfert 2’s (Antonucci & Miller 1985; Miller & Goodrich 1990; Tran 1995; Kay 1994), or a deficit of ionizing photon in Seyfert 2 galaxies, which indicates that the ionizing source is hidden from direct view (Neugebauer et al. 1980; Wilson, Ward & Haniff 1988; Kinney et al. 1991, Storchi-Bergmann, Wilson & Baldwin 1992; Schmitt, Storchi-Bergmann & Baldwin 1994). Another strong argument for the Unified Model is the collimated escape of radiation from the nuclear region, detected as Narrow Line Regions with conical shapes in Seyfert 2 galaxies and halo-like shapes in Seyfert 1’s (Pogge 1988a,b,1989; Schmitt & Kinney 1996; Mulchaey, Wilson & Tsvetanov 1996a,b; Ferruit, Wilson & Mulchaey 2000; Haniff, Wilson & Ward 1988; Capetti et al. 1995, 1996), as well as linear extended, jet like radio emission (Ulvestad & Wilson 1984a,b, 1989; Nagar et al. 1999; Schmitt et al. 2000).
It is now accepted that the Unified Model is correct to zeroth order, i.e. that it applies qualitatively to at least some large fraction of the objects being studied. However, there have been some observational results claiming intrinsic statistical differences between Seyfert 1’s and Seyfert 2’s considered as populations, which have been used as arguments against the Unified Model. For example, Malkan, Gorjian & Tam (1998) found that Seyfert 1’s usually reside in earlier type host galaxies compared to Seyfert 2’s. They also found that Seyfert 2’s have a higher incidence of dust lanes than Seyfert 1’s. Older papers, like Meurs & Wilson (1984) reported that in their sample Seyfert 2’s have higher radio luminosities than Seyfert 1’s, and Heckman et al. (1989) found that Seyfert 2’s have higher molecular gas masses (from CO(1-0)) than Seyfert 1’s.
Historically, the main stumbling block in testing and developing Unified Models has been the tendency to compare samples of AGN being unified which were not preselected by some isotropic property. A spectacular example of this effect can be seen in the case of samples selected by their ultraviolet excess. According to the model, we see perhaps 1% of the nuclear featureless continuum by reflection in Seyfert 2’s, whereas we see the whole thing in Seyfert 1’s. Many famous Seyferts were selected by UV excess, like the Markarian objects, and thus by this hypothesis the Seyfert 2’s were selected from two orders of magnitude higher on the luminosity function than the Seyfert 1’s. Another possibility is that these Seyfert 2’s have something else around their nuclei, like star formation, which would increase their ultraviolet emission.
We believe that the reason why some papers have been finding differences in some apparently isotropic properties of Seyfert 1’s and Seyfert 2’s is mostly due to the samples they use and not to intrinsic differences between these two populations. For example, a study done by Maiolino et al. (1997), using a larger and well defined sample than that of Heckman et al. (1989), shows that both Seyfert types have similar CO masses. Also, Rush, Malkan & Edelson (1996) showed that both types have similar radio luminosities when improved selection criteria are used.
This paper presents a series of statistical tests done to a sample of Seyfert galaxies selected from a mostly isotropic property, their far infrared flux and color. We use these tests to address several problem related to the Unified Model. The sample and data used for these tests are presented in Section 2. Section 3 presents the comparison between the inclinations of the host galaxies of Seyfert 1’s and Seyfert 2’s and their morphological types. Section 4 shows the comparison of their radio luminosities and extensions of the radio emission. Section 5 presents the study the percentage of Seyferts galaxies with companions, while Section 6 deals with the analysis of previous suggestions that the inclination of the torus relative to the host galaxy disk depends on the host galaxy morphological type. A summary is given in Section 7.
2 Sample and data
As pointed out above, in order to be able to make a fair comparison between Seyfert 1’s and Seyfert 2’s and correctly address problems related to the Unified Model, it is necessary to use a sample selected from an isotropic property, believed to be independent of the orientation of the putative torus relative to the line of sight. One of the best ways to select such a sample is based on the far infrared properties of the galaxies. According to the Pier & Krolik (1992) torus models, the circumnuclear torus radiates nearly isotropically at 60m, so a sample selected in this way should be relatively free from selection effects. Any starlight energy reprocessed to 60m should not cause a big bias as long as that 60m component is optically thin and thus isotropic.
Given these facts, one of the best samples available for our purposes is that of warm Seyfert galaxies defined by de Grijp et al. (1987, 1992). Their sample was selected based on the strength of their IRAS 25m and 60m fluxes, warm infrared colors () to exclude starbursts as much as possible, and high galactic latitude (). There has been extensive followup spectroscopy of this sample and their spectral classifications are very secure. Also, Keel et al. (1994) showed that the [OIII] and 60m luminosities of this sample have similar distributions. Since [OIII] is believed to be an isotropic quantity, because it originates outside the torus, this result indicates that the 60m luminosity is an isotropic property, and consequently this sample should be relatively unbiased.
We have to point out, however, that this sample is not complete, since any Seyfert galaxy with infrared colors cooler than our criteria or for which there is no good quality IRAS data, are missed. Aside from any possible stellar contribution, any wavelength dependent far-IR anisotropy could make an object look too cool to be selected. In fact, according to Krolik & Lepp (1989) the torus may be optically thick up to 50m, which means that the 25m flux, used in the sample selection, is not completely isotropic. This is not unlikely, with X-ray columns typically N(H)cm-2 or higher (Maiolino et al. 1998; Risaliti, Maiolino & Salvati 1999). Some encouragement here comes from evidence of a low absorption per unit column density in AGN (see Maiolino et al. 2001a,b).
The sample used here corresponds to all Seyfert galaxies with z0.031 in the de Grijp et al. (1987, 1992) catalogs, giving a total of 88 galaxies, 29 Seyfert 1’s and 59 Seyfert 2’s. It was primarily selected to study the orientation of radio jets relative to their host galaxies disks by Kinney et al. (2000), who showed that these Seyfert 1’s and Seyfert 2’s have similar 60m luminosity distributions. This indicates that neither of the Seyfert types is biased towards higher luminosities.
From the relative number of Seyfert 1’s and Seyfert 2’s in our sample we can calculate that the torus half opening angle is . This is done assuming that the galaxy is recognized as a Seyfert 1 if the observer see inside the torus, or as a Seyfert 2 otherwise. We discuss some possible complications to this scenario in Section 3. This value is between the ones obtained by Osterbrock & Martél (1993) from the relative number of Seyfert 1’s and 1.5’s () and Seyfert 1.8’s and 1.9’s () in the CfA sample. Values similar to these can be obtain using the Palomar survey (Ho, Filippenko & Sargent 1997). The de Grijp et al. (1992) classification separated the galaxies only in Seyfert 1’s and Seyfert 2’s. It is possible that Seyfert 1.8’s and 1.9’s were divided among these two classes, which would explain the fact that our torus half opening angle is in the middle of the two values obtained when using samples split into finer details.
Another important point in this study is the use of high quality radio and broad-band optical images obtained and measured in a homogeneous way. Data collected from the literature can also influence the results, since it usually is inhomogeneous, involves data of different quality, besides the fact that different authors are likely to measure the same thing using different techniques. Tables 1 and 2, for Seyfert 1’s and 2’s, respectively, present the data used in our analysis.
Using the galaxies radial velocities from Tables 1 and 2, and assuming H km s-1 Mpc-1 (which will be used throughout this paper), we found that Seyfert 1’s and Seyfert 2’s have indistinguishable distance distributions. A KS test shows that two samples drawn from the same parent population would differ this much 99.99% of the time.
We also compared if Seyfert 1’s and Seyfert 2’s have the same space distribution using the V/Vmax technique (Schmidt 1968), based on the 25m and 60m fluxes given by de Grijp et al. (1992), and the detection limits 0.1 Jy at 25m and 0.45 Jy at 60m. The average and standard deviation of V/Vmax for the 25m data is 0.1460.154 for Seyfert 1’s and 0.1110.144 for Seyfert 2’s, while for the 60m data it is 0.3270.273 and 0.2510.214, for Seyfert 1’s and Seyfert 2’s, respectively. Applying a KS test to the V/Vmax distributions obtained from the 25m data shows that Seyfert 1’s and Seyfert 2’s have similar distributions. Two samples drawn from the same parent population would differ this much 52% of the time. A similar result is obtained for the V/Vmax distributions obtained from the 60m data, with the KS test giving a 63% probability. These results show that both Seyfert types have similar space distributions, and are not biased towards one type of Seyfert being more distant than the other. One important result from this analysis is the fact that the V/Vmax distribution have values smaller than 0.5, which shows that the space distributions are skewed towards nearby objects. This result is expected, since the sample includes only galaxies with z.
The broad-band imaging data used here were presented by Schmitt & Kinney (2000). The host galaxy ellipticities () and major axis position angles (PAMA) were obtained by fitting ellipses to the images of the galaxies. Further details about these measurements are given by Kinney et al. (2000) and Schmitt & Kinney (2000). The Morphological Types used here were obtained mostly from de Vaucouleurs et al. (1993) and Malkan et al. (1998). Since these large compilations have already classified the galaxies rather homogeneously, we gave preference to them and avoided reclassifying the galaxies. The exceptions were the galaxies for which we could not find a previous classification, in which case we classified them ourselves. We also checked the galaxies smaller than 30′′, since older lower resolution images could have resulted in their misclassification as earlier type systems, but none of the previous classifications changed.
High resolution VLA A-configuration 3.6cm radio images were available for 75 galaxies in our sample, and PKS2048–57 had 3.6cm data from ATCA. Data for 36 of these galaxies was obtained by us in a snapshot survey, while for 19 other galaxies we retrieved and reduced data from the VLA archive (Schmitt et al. 2001). Only TOL1238–364 was not detected. Data for the remaining 20 galaxies were obtained from Nagar et al. (1999), who reduced and measured their data in a way similar to ours. For those galaxies with extended radio structures, their emission was decomposed into individual components by fitting gaussians to them. The position angle of the extended emission (PARAD) and the extension of the radio emission was measured between the central position of these Gaussians. For more details about the measurements, see Schmitt et al. (2001), Kinney et al. (2000) and Nagar et al. (1999).
3 Host galaxies inclinations and morphological types
Figure 1 shows the observed distribution of the ratio between the host galaxies minor to major axis lengths (b/a). The observed distribution has a deficit of Seyfert 1 galaxies with b/a0.5, while in Seyfert 2’s this does not seem to happen. The lack of galaxies with b/a0.2 is due to the thickness of the disk, which accounts for the fact that even when seen edge-on a galaxy has b/a0 (Hubble 1926). Comparing the b/a distribution for Seyfert 1’s and Seyfert 2’s using a Kolmogorov-Smirnov test (KS test) we find that they are significantly different, giving the probability that two samples drawn from the same parent population would differ this much only 4.7% of the time.
This result is similar to the one found by Keel (1980), who was the first to discover a deficiency of edge-on Seyfert 1 galaxies (see also Lawrence & Elvis 1982). This has been confirmed by more recent results from Maiolino & Rieke (1995) and Simcoe et al. (1997), based on larger samples. Also Kinney et al. (2000) showed from the modeling of the 3-dimensional distribution of jets relative to their galaxies disk, based on the observed distribution of host galaxy disk inclinations and ’s (the difference between the position angles of the radio jet and the host galaxy major axis), that there is an inconsistency in the model. This inconsistency can only be solved if one assume that Seyfert 1’s whose host galaxies are highly inclined are seen as Seyfert 2’s, regardless of the orientation of any nuclear torus. We do not expect to see ionization cones in this case.
Although this result is in principle not expected from the Unified Model, it does not necessarily contradict it. The papers cited above suggested that, in the case of edge-on Seyfert galaxies, the gas and dust along the host galaxy disk can act in the same way as a circumnuclear torus, blocking the direct view of the Broad Line Region, thus leading to a classification as a Seyfert 2 galaxy.
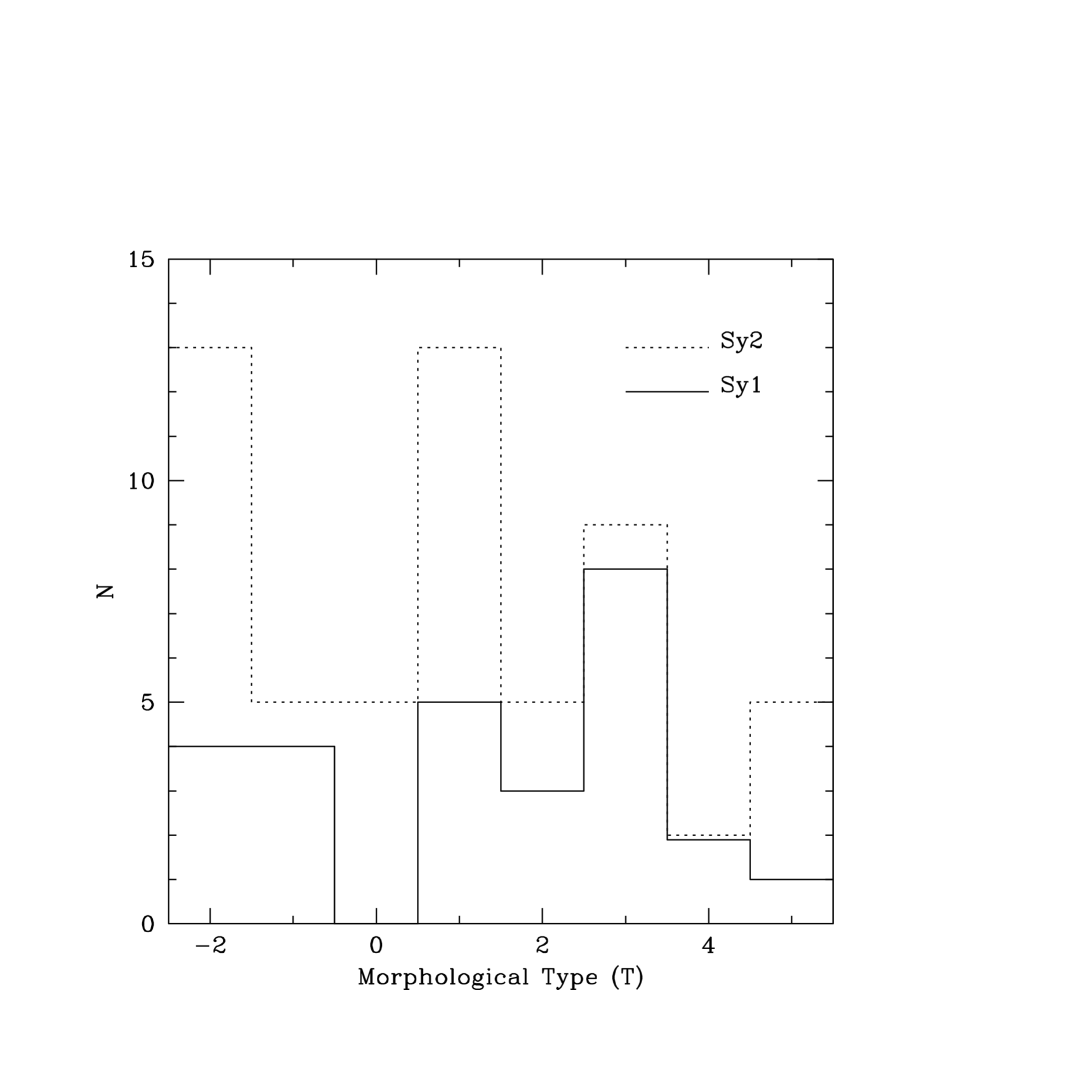
The comparison between the Morphological Types (T) of the host galaxies of Seyfert 1’s and Seyfert 2’s is presented in Figure 2, which shows that the two distributions are very similar. In fact, the KS test shows that two samples selected from the same parent population would differ this much 80% of the time. This result is in contrast to the result from Malkan et al. (1998). However, as explained in the Introduction, their result is most likely due to selection effects, since their galaxies were not selected following an isotropic criterion (Antonucci 1999).
4 Radio luminosities and extensions
Figure 3 presents the comparison between the distributions of the radio 3.6 cm luminosities of Seyfert 1’s and Seyfert 2’s. The two groups of galaxies have similar distributions, as expected from the Unified Model. The KS test shows that two samples selected from the same parent population would differ this much 11% of the time.
Figure 4 shows the distributions of the logarithm of the extension of the 3.6cm radio emission in Seyfert 1’s (top) and Seyfert 2’s (bottom). Only 9 out of 26 Seyfert 1’s (35%) show extended emission, and the rest are unresolved, as indicated by arrows in the figure. In the case of Seyfert 2’s, 28 out of 48 galaxies (58%) have extended radio emission.
Given the fact that 50% of the galaxies in our sample are unresolved, we had to use survival analysis techniques to compare the two distributions. We used the IRAF package “statistics” inside STSDAS, which contains a series of statistical tests for censored data, created based on the package ASURV (Isobe & Feigelson 1990, LaValley, Isobe & Feigelson 1992).
The mean and standard deviations of the extension of the radio emission were calculated using the Kaplan-Meier estimator, which gave 14865 pc and 34897 pc for Seyfert 1’s and Seyfert 2’s, respectively. We should point out that the Kaplan-Meier estimator only works if the censoring is random, meaning that the probability of a measurement being censored does not depend on the value of the variable. In principle this requirement seems to rule out the possibility of using this estimator, since we cannot detect emission less extended than . However, since the galaxies are at different distances, this angular size corresponds to different physical sizes for different galaxies, thus randomizing the censoring.
We also compared whether Seyfert 1’s and Seyfert 2’s have similar distributions of the extension of the radio emission, using the Gehan-Wilcoxon test. This test assumes that the censoring patterns are the same in the two samples, which is our case. We obtain a probability of 4.2% that the two samples are drawn from the same parent population.
The results obtained from these tests confirm what a visual inspection of Figure 4 suggests, that the extension of the radio emission in Seyfert 1 galaxies is smaller than that of Seyfert 2’s. The fact that Seyfert 1’s have smaller extended radio emission is not due to a distance effect, since we showed that both Seyfert types have similar distance and space distributions. We extend this analysis by applying the V/Vmax test to the extension of the radio emission. Excluding the galaxies with upper limits from the sample and applying a KS test to the V/Vmax distributions of Seyfert 1’s and Seyfert 2’s, we find that they do not differ significantly. Two samples drawn from the same parent population would differ this much 72% of the time. In the case when we consider all galaxies, assuming those with size upper limits have V/V, the two samples still have similar distributions. The KS test gives an 11% probability that two samples drawn from the same parent population would differ this much. These results confirm one of the predictions from the Unified Model, that, since the jets are seen end-on in Seyfert 1 galaxies, projection effects should make their jets look smaller than those of Seyfert 2’s which are seen more edge-on.
5 Number of companion galaxies
Two of the major concerns in the study of AGN’s are the origin of the gas which fuels the nuclear black hole and the mechanisms that make this gas move from galactic scales down to the inner 1 pc region of the galaxy. In the case of spiral galaxies, gas in their disks can be a natural source to fuel the AGN, while in ellipticals an external source seems to be necessary. Several mechanisms have been suggested to explain how it is possible to transport gas from the disk of a spiral galaxy to its nucleus, like interactions (Gunn 1979; Hernquist 1989; Hernquist & Mihos 1995), or bars (Schwartz 1981; Norman 1987; Shlosman, Frank & Begelman 1990). A review about this subject is given by Combes (2001).
The influence of interactions on the fueling of AGN has been the topic of several papers, but so far there is no consensus about this subject. Dahari (1984) was the first one to make a large compilation of possible companions around Seyferts, finding that these galaxies have an excess of companions relative to normal galaxies. The same result was obtained by Rafanelli, Violato & Baruffolo (1995), Laurikainen et al. (1994) and MacKenty (1989, 1990). On the other hand, Fuentes-Williams & Stocke (1988), Bushouse (1986) and De Robertis, Yee & Hayhoe (1998) found that there is no detectable difference in the environments of their samples of Seyfert and normal galaxies. Yet another intriguing result was obtained by Laurikainen & Salo (1995) and Dultzin-Hacyan et al. (1999), who showed that Seyfert 2’s have a larger number of companions when compared to normal galaxies, while Seyfert 1’s do not. Part of these conflicting results may be due to the way these papers selected their samples and control samples (Heckman 1990; Osterbrock 1993).
We used our broad band images, NED and the Digitized Sky Survey plates (DSS) to search for companions around the galaxies in our sample. Although we cannot do a proper comparison between the frequency of companions in these galaxies compared to normal ones, because we did not observe a control sample and cannot apply the same kind of statistical analysis done by Dahari (1984), we can at least put an upper and a lower limit on the number of galaxies with companions in our sample for each Seyfert type.
Several parameters have been used to determine if a galaxy has a possible companion or not. We adopt here the ones used by Rafanelli et al. (1995), which was determined based on catalogs of interacting and pair galaxies. A galaxy is considered a possible companion if its distance to the galaxy of interest is smaller than 3 times the diameter of that galaxy (3D) and the difference in brightness between them is smaller than 3 magnitudes ( 3 mag). These criteria alone are not enough to determine whether two galaxies actually are companions, but they can be used to at least put an upper limit on this number. The definitive criterion to consider two galaxies as companions, according to Rafanelli et al. (1995) is the difference between the radial velocities of the two components, which has to be smaller than 1000 km s-1.
Following the Rafanelli et al. (1995) criteria, we searched our images for possible companion galaxies around our Seyferts. Most of the search was conducted on the I band images of Schmitt & Kinney (2000), which were deeper than their B band images. These images are sensitive enough to ensure that all galaxies with mag were detected. The faintest galaxy in our sample has I14.46 mag, while the typical detection limit of the images is 22 mag arcsec-2, about 7 magnitudes fainter. In the case of two Seyfert 1 galaxies (MRK705 and MCG+08-11-011) we allowed the brightness difference between the two galaxies to be slightly larger than 3 mag, since they have bright nuclei, which increases their integrated magnitudes.
A small percentage of the galaxies, usually the closest ones, were large enough that the 3D region exceeded the sides of our images. In these cases we searched for companions on NED and DSS images. For the cases in which we found companions on NED, they were also confirmed on the DSS images. In these cases we had to use a mag brightness criteria rather than mag, because there was no I band information available for these galaxies. That should not affect our results, since, according to Héraudeau, Simien & Mamon (1996), spiral galaxies have a mean color B–I, with a spread of mag around this value. All the galaxies for which we used the mag criteria have 2 mag or smaller.
Although the search for possible companions involved more than one data source and was not perfectly homogeneous, all the galaxies with mag or mag were detected. Our images allowed to search for magnitude differences much fainter than mag. The searches based on NED and DSS images also allowed the detection of magnitude differences fainter than mag, since they involved only the nearest galaxies, the brightest ones (B mag).
We also used NED to search for the radial velocities of the possible companion galaxies. Some of the galaxies which satisfied the distance and brightness criteria were excluded from the list of possible interacting galaxies because their radial velocities differed by more than 1000 km s-1. Nevertheless, we could not find radial velocity information for all the galaxies.
The information about the distances and difference in radial velocities and magnitudes between the Seyfert galaxies and their possible companions is presented in Table 3. A total of 25 out of the 88 Seyfert galaxies in our sample have galaxies with or mag and closer than 3D from them, which puts an upper limit of 6% of possible interacting galaxies in this sample (the uncertainty is given by Poisson statistics). Of these 25 galaxies, 9 are Seyfert 1’s and 16 are Seyfert 2’s, which gives an upper limit of possible companions of 10% and 7% among Seyfert 1’s and Seyfert 2’s, respectively. When we consider only the galaxies which satisfy the brightness, distance and velocity criteria, we find a total of 17 Seyferts with confirmed companions in the sample. Since there is no information on the radial velocities for 8 of the possible companion galaxies, we can only assume that 17 is a lower limit, which gives that the percentage of Seyferts with companions is %. Of these 17 galaxies, 7 are Seyfert 1’s and 10 are Seyfert 2’s, which gives a lower limit on the number of companions of % and %, respectively.
The number of confirmed companions in our sample is similar to the one found by Rafanelli et al. (1995) for the CfA sample. We should also notice that there is no apparent difference in the upper and lower percentage of companion galaxies in Seyfert 1’s and Seyfert 2’s, contradicting the results obtained by Laurikainen & Salo (1995) and Dultzin-Hacyan et al. (1999). A possible explanation for the larger percentage of Seyfert 2 galaxies with companions found by these two papers may be their samples. Both papers selected their galaxies mostly from ultraviolet surveys. As discussed above, this is not a good selection criterion, given the fact that the nuclear source is hidden in Seyfert 2’s and the ultraviolet emission we see is either nuclear light reflected in our direction, or originates from a source other than the AGN, like a Starburst for example. If the ultraviolet excess observed in some Seyfert 2’s is in fact due to Starbursts, as several recent papers suggest (González-Delgado, Heckman & Leitherer 2001; Storchi-Bergmann et al. 2001; Schmitt, Storchi-Bergmann & Cid Fernandes 1999; Cid Fernandes, Storchi-Bergmann & Schmitt 1998) this would in fact explain their larger number of Seyfert 2’s with companions, since galaxy interaction can enhance star formation (Kennicutt et al. 1987; Bushouse 1987; Telesco et al. 1993).
6 Torus and host galaxy disk alignment as a function of morphological type
Based on the assumption that the extended [OIII] emission observed in some Seyfert galaxies, is a tracer of the torus axis, Wilson & Tsvetanov (1994) compared the orientation of the torus relative to the host galaxy disk major axis in 11 of these objects. Their result suggested that the torus axis could be aligned closer to the host galaxy rotation axis in late type galaxies, since these galaxies presented [OIII] emission extended preferentially perpendicular to the major axis, along the minor axis. On the other hand, their results showed that the extended [OIII] emission can have any orientation relative to the host galaxy major axis in early type systems. According to these authors, these results suggested that the gas feeding the nucleus could originate from the host galaxy disk in late type galaxies, but have an external origin in early type systems. However, as they pointed out, their results were just speculative, since their sample was too small to draw significant conclusions.
Schmitt et al. (1997) repeated the comparison done by Wilson & Tsvetanov (1994), but instead of using extended [OIII] emission to trace the torus axis, did it using extended radio emission. Their results showed that it was not possible to distinguish the observed distribution from a uniform one, implying that Wilson & Tsvetanov (1994) results were due to the small size of their sample. However, an analysis presented by Nagar & Wilson (1999), also based on the orientation of radio jets, claimed the opposite, that Seyfert galaxies in late type hosts actually have torus and accretion disk axis aligned close to the galaxy rotation axis.
Figure 5 shows the observed distribution of ’s, the difference between the position angles of the jets and the host galaxies major axis, and morphological types for the sample described in Sec. 2. This Figure is just a scatter plot, with no particular correlation between the two quantities. A KS test shows that the null hypothesis that the observed data is represented by a uniform distribution, is confirmed at the 97% significance level. In the case we consider only those galaxies with T, the KS test still gives a 76% probability that the observed distribution can be represented by a uniform distribution.
We believe that the Nagar & Wilson (1999) results may be due to a selection effect. They found that there is a tendency for Seyferts in types later than Sab (T2) to avoid close alignment of the jets with the minor axis. However, their primary sample was composed only of Seyferts with hosts earlier than Sab (T2), to which they added some later type galaxies obtained from the literature. In this way, they ended up having a very good representation of galaxies with T, but lacked galaxies with later types, which most likely influenced their results.
In order to increase the number of galaxies in this comparison, we repeated this test including all Seyfert galaxies with extended radio emission presented by Kinney et al. (2000), which were not in our sample described in Sec. 2. The versus T distribution is presented in Figure 6, which shows the same behavior as Figure 5. A KS test also gives similar results, showing that the null hypothesis that the observed data can be represented by a uniform distribution is confirmed at the 84% level, or 23% when we consider only those galaxies with T. These results are expected, since Clarke et al. (1998), Nagar & Wilson (1999) and Kinney et al. (2000) showed that there is no correlation between the orientation of the jet axis and host galaxy disk. The possible implications of this result for the structure of the accretion disk and feeding of the black hole are discussed by Kinney et al. (2000).
7 Summary
In this paper, we used high resolution radio 3.6cm and optical B and I images of a sample of Seyfert galaxies selected from their far infrared properties, which are believed to be relatively isotropic properties of these galaxies, since they are relatively unbiased. Our sample selection makes it one of the best ones to study the Unified Model, since it is unbiased towards the orientation of the accretion torus.
From the relative number of Seyfert 1’s and Seyfert 2’s we calculate that the torus half opening angle is . This value is similar to the one found by Osterbrock & Martél (1993) for the CfA sample.
Our results showed that there is a deficiency of Seyfert 1’s in edge-on galaxies. The comparison between the distribution of the ratio between the host galaxy minor to major axis lengths shows that Seyfert 1’s and Seyfert 2’s are statistically different, with the Seyfert 2’s having more edge-on galaxies. This result is in line with previous results, which suggest that dust and gas along the host galaxy disk can play an important role in hiding the nucleus from direct view in edge-on Seyferts.
The comparison of the morphological types of the host galaxies does not show a statistically significant difference between Seyfert 1’s and Seyfert 2’s. Previous results showing the opposite may have been due to selection effects. We also find that there is no significant difference in the radio 3.6cm luminosities of these two groups.
Using survival analysis techniques, we showed that the extension of the radio emission in Seyfert 1’s is smaller than that of Seyfert 2’s by a factor of 2–3. This result is in accordance with the Unified Model, which predicts that the jets are seen end-on in Seyfert 1 galaxies and therefore should be shortened by projection.
We used our images to search for possible companions around our galaxies, following the criteria described by Rafanelli et al. (1995). Although we could not compare the number we obtained with that of normal galaxies, because we did not observe a control sample, we were able to determine limits to the percentage of galaxies with companions in our sample and compare their frequency in Seyfert 1’s and Seyfert 2’s. We found that between 19% and 28% of the galaxies in our sample have companions, with no significant difference between Seyfert 1’s and Seyfert 2’s. Previous results showing that there is a higher percentage of Seyfert 2’s with companions than Seyfert 1’s, may have been due to the samples used to perform those studies.
We also showed that there is no preference for the torus axis of Seyferts in late type galaxies to be aligned preferentially close to their host galaxy rotation axis (minor axis) as shown by previous works. The observed distribution suggests that there is no correlation between the jet and the disk direction, as shown by Kinney et al. (2000).
References
- (1) Antonucci, R. R. J. 1993, ARA&A, 31, 473
- (2) Antonucci, R. 1999, in High Energy Processes in Accreting Black Holes, ASP Conference Series 161, eds. J. Poutanen & R. Svensson (San Francisco:ASP), p.193
- (3) Antonucci, R. R. J. & Miller, J. S. 1985, ApJ, 297, 621
- (4) Bushouse, H. A. 1986, AJ, 91, 255
- (5) Bushouse, H. A. 1987, ApJ, 320, 49
- (6) Capetti, A., Macchetto, F., Axon, D. J., Sparks, W. B. & Boksenberg, A. 1995, ApJ, 448, 600
- (7) Capetti, A., Axon, D. J., Macchetto, F., Sparks, W. B. & Boksenberg, A. 1996, ApJ, 466, 169
- (8) Cid Fernandes, R., Storchi-Bergmann, T. & Schmitt, H. R. 1998, MNRAS, 297, 579
- (9) Clarke, C. J., Kinney, A. L. & Pringle, J. E. 1998, ApJ, 495, 189
- (10) Combes, F. 2001, astro-ph/0010570
- (11) Dahari, O. 1984, AJ, 89, 966
- (12) de Grijp, M.H.K., Keel, W. C., Miley, G.K., Goudfrooij, P. & Lub, J. 1992, A&AS, 96, 38
- (13) de Grijp, M.H.K., Miley, G.K., & Lub, J. 1987, A&AS, 70, 95
- (14) De Robertis, M. M., Yee, H. K. C. & Hayhoe, K. 1998, ApJ, 496, 93
- (15) de Vaucouleurs, G. de Vaucouleurs, A., Corwin, H. G., Jr., Buta, R. J., Paturel, G. & Fouque, P. 1991, Third Reference Catalogue of Bright Galaxies (New York: Springer)
- (16) Dultzin-Hacyan, D., Krongold, Y., Fuentes-Guridi, I. & Marziani, P. 1999, ApJ, 513, L111
- (17) Ferruit, P., Wilson, A. S. & Mulchaey, J. 2000, ApJS, 128, 139
- (18) Fuentes-Williams, T. & Stocke, J. T. 1988, AJ, 96, 1235
- (19) González-Delgado, R. M., Heckman, T. M. & Leitherer, C. 2001, ApJ, in press
- (20) Gunn, J. 1979, in Active Galactic Nuclei, edited by C. Hazard & S. Mitton, (Cambridge University Press, Cambridge), p.213
- (21) Haniff, C. A., Wilson, A. S. & Ward, M. J. 1988, ApJ, 334, 104
- (22) Heckman, T. M. 1990, in Paired and Interacting Galaxies, IAU Colloquium No. 124, eds. J. W. Sulentic & W. C. Keel, NASA Conference Publication 3098, p.359
- (23) Heckman, T. M., Blitz, L., Wilson, A. S., Armus, L. & Miley, G. K. 1989, ApJ, 342, 735
- (24) Héraudeau, P., Simien, F. & Mamon, G. A. 1996, A&AS, 117, 417
- (25) Hernquist, L. 1989, Nature, 640, 687
- (26) Hernquist, L. & Mihos, J. C. 1995, ApJ, 448, 41
- (27) Ho, L. C., Filippenko, A. V. & Sargent, W. L. W. 1997, ApJS, 112, 315
- (28) Hubble, E. 1926, ApJ, 64, 321
- (29) Isobe, T. & Feigelson, E. D. 1990, BAAS, 22, 917
- (30) Kay, L. E. 1994, ApJ, 430, 196
- (31) Keel, W. C. 1980, AJ, 85, 198
- (32) Keel, W. C. 1996, AJ, 111, 696
- (33) Keel, W. C., de Grijp, M. H. K., Miley, G. K. & Zheng, W. 1994, A&A, 283, 791
- (34) Kennicutt, R. C., Jr., Roettiger, K. A., Keel, W. C., van der Hulst, J. M., Hummel, E. 1987, AJ, 93, 1011
- (35) Kinney, A. L., Antonucci, R. R. J., Ward, M. J., Wilson, A. S. & Whittle, M. 1991, ApJ, 377, 100
- (36) Kinney, A.L., Schmitt, H.R., Clarke C.J., Pringle, J.E., Ulvestad, J.S., & Antonucci, R.R.J. 2000, ApJ, 537, 152
- (37) Krolik, J. H. & Lepp. S. 1989, ApJ, 347, 179
- (38) Laurikainen, E. & Salo, H. 1995, A&A, 293, 683
- (39) Laurikainenn, E., Salo, H., Teerikorpi, P. & Petrov, G. 1994, A&AS, 108, 491
- (40) LaValley, M., Isobe, T. & Feigelson, E. D. 1992, Astronomical Data Analysis Software and Systems I, A.S.P. Conference Series, Vol. 25, eds. D. M. Worrall, C. Biemesderfer, and J. Barnes (San Francisco: ASP), p. 245
- (41) Lawrence, A. & Elvis, M. 1982, ApJ, 256, 410
- (42) MacKenty, J. W. 1989, ApJ, 343, 125
- (43) MacKenty, J. W. 1990, ApJS, 72, 231
- (44) Maiolino, R., Marconi, A. & Oliva, E. 2001a, A&A, in press
- (45) Maiolino, R., Marconi, A., Salvati, M., Risaliti, G., Severgnini, P., La France, F. & Vanzi, L. 2001b, A&A, in press
- (46) Maiolino, R. & Rieke, G. H. 1995, ApJ, 454, 95
- (47) Maiolino, R., Ruiz, M., Rieke, G. H. & Papadopoulos, P. 1997, ApJ, 485, 552
- (48) Maiolino, R. et al. 1998, A&A, 338, 781
- (49) Malkan, M. A., Gorjian, V. & Tam, R. 1998, ApJS, 117, 25
- (50) Meurs, E. J. A. & Wilson, A. S. 1984, A&A, 136, 206
- (51) Miller, J. S. & Goodrich, R. W. 1990, ApJ, 355, 456
- (52) Mulchaey, J. S., Wilson, A. S. & Tsvetanov, Z. I. 1996, ApJS, 102, 309
- (53) Mulchaey, J. S., Wilson, A. S. & Tsvetanov, Z. I. 1996, ApJ, 467, 197
- (54) Nagar, N.M., & Wilson, A.S. 1999, ApJ, 516, 97
- (55) Nagar, N. M., Wilson, A. S., Mulchaey, J. S. & Gallimore, J. F. 1999, ApJS, 120, 209
- (56) Neugebauer, G. et al. 1980, ApJ, 238, 502
- (57) Norman, C. 1987, in Galactic and Extragalactic star Formation, ed. R. E. Pudritz & M. Fich (Dordrecht: Kluwer), 495
- (58) Osterbork, D. E. 1993, ApJ, 404, 551
- (59) Osterbrock, D. E. & Martél, A. 1993, ApJ, 414, 552
- (60) Pier, E. A. & Krolik, J. H. 1992, ApJ, 401, 99
- (61) Pogge, R. W. 1988a, ApJ, 328, 519
- (62) Pogge, R. W. 1988b, ApJ, 332, 702
- (63) Pogge, R. W. 1989, ApJ, 345, 730
- (64) Rafanelli, P., Violato, M. & Baruffolo, A. 1995, AJ, 109, 1546
- (65) Risaliti, G., Maiolino, R. & Salvati, M. 1999, ApJ, 522, 157
- (66) Rush, B., Malkan, M. A. & Edelson, R. A. 1996, ApJ, 473, 130
- (67) Schmidt, M. 1968, ApJ, 151, 393
- (68) Schmitt, H. R. & Kinney, A. L. 1996, ApJ, 463, 498
- (69) Schmitt, H. R. & Kinney, A. L. 2000, ApJS, 128, 479
- (70) Schmitt, H. R., Kinney, A. L., Storchi-Bergmann, T. & Antonucci, R. 1997, ApJ, 477, 623
- (71) Schmitt, H. R., Storchi-Bergmann, T. & Baldwin, J. A. 1994, ApJ, 423, 237
- (72) Schmitt, H. R., Storchi-Bergmann, T. & Cid Fernandes, R. 1999, MNRAS, 303, 173
- (73) Schmitt, H. R., Ulvestad, J. S., Antonucci, R. R. J. & Kinney, A. L. 2001, ApJS, 132, 199
- (74) Schwartz, M. 1981, ApJ, 247, 77
- (75) Shlosman, I., Begelman, M. C. & Frank, J. 1990, Nature, 345, 679
- (76) Simcoe, R., McLeod, K. K., Schachter, J. & Elvis, M. 1997, ApJ, 489, 615
- (77) Storchi-Bergmann, T., Wilson, A. S. & Baldwin, J. A. 1992, ApJ, 396, 45
- (78) Storchi-Bergmann, T., Raimann, D., Bica, E. L. D. & Fraquelli, H. A. 2001, ApJ, in press
- (79) Telesco, C. M., Dressel, L. L. & Wolstencroft, R. D. 1993, ApJ, 414, 120
- (80) Tran, H. D. 1995, ApJ, 440, 597
- (81) Ulvestad, J. S., & Wilson, A. S. 1984a, ApJ, 278, 544
- (82) Ulvestad, J. S., & Wilson, A. S. 1984b, ApJ, 285, 439
- (83) Ulvestad, J. S., & Wilson, A. S. 1989, ApJ, 343, 659
- (84) Ward, M. J. & Wilson, A. S. 1978, A&A, 70, L79
- (85) Wills, B. J. 1999, in Quasars and Cosmology, ASP Conference Series 162, eds. G. Ferland and J. Baldwin, ASP (San Francisco) p.101
- (86) Wilson, A. S. & Tsvetanov, Z. I. 1994, AJ, 1227
- (87) Wilson, A. S., Ward, M. J. & Haniff, C. A. 1988, ApJ, 334, 121
- (88)


| Number | Name | Velocity | b/a | Radio Extent | Log(L3.6cm) | T | Reference | |
|---|---|---|---|---|---|---|---|---|
| (km s-1) | (pc) | (W Hz-1) | (deg) | |||||
| 27 | MRK 359 | 5012 | 0.83 | 170 | 20.43 | 4 | 67 | 2 |
| 47 | MRK 1040 | 4927 | — | 32 | 20.76 | 4 | – | 3 |
| 68 | UGC 2514 | 3957 | 0.57 | 69 | 20.30 | -0.5 | 84 | 3 |
| 174 | MCG -05-13-017 | 3790 | 0.81 | 24 | 20.88 | -0.3 | – | 3 |
| 203 | UGC 3478 | 3828 | 0.38 | 25 | 20.64 | 3 | – | 3 |
| 209 | MRK 6 | 5537 | 0.59 | 437 | 22.29 | -0.5 | 43 | 3 |
| 213 | FAIRALL 265 | 8844 | 0.75 | — | — | 2 | – | 1 |
| 225 | MRK 79 | 6652 | 0.81 | 1255 | 21.44 | 3 | 58 | 3 |
| 227 | MRK 10 | 8785 | 0.51 | 57 | 20.69 | 3 | – | 3 |
| 233 | UGC 4155 | 7645 | 0.77 | 49 | 21.48 | 1 | – | 3 |
| 260 | MRK 1239 | 5974 | 0.81 | 53 | 21.78 | -2 | – | 4 |
| 278 | NGC 3516 | 2649 | 0.81 | 18 | 20.79 | -2 | 46 | 3 |
| 286 | NGC 3783 | 2550 | 0.93 | 17 | 21.03 | 1.5 | – | 3 |
| 292 | MRK 766 | 3876 | 0.85 | 67 | 21.44 | 1 | 35 | 3 |
| 301 | NGC 4593 | 2698 | 0.71 | 17 | 20.51 | 3 | – | 3 |
| 309 | MCG -02-33-034 | 4386 | — | 28 | 20.69 | – | – | 1 |
| 324 | MCG -6-30-15 | 2323 | 0.65 | 38 | 20.01 | -2 | – | 2 |
| 344 | NGC 5548 | 5149 | — | 44 | 21.24 | – | – | 3 |
| 369 | UGC 9826 | 8754 | 0.67 | 57 | 20.51 | 5 | – | 3 |
| 473 | FAIRALL 51 | 4255 | 0.55 | — | — | 2.8 | – | 3 |
| 497 | ESO 143-G09 | 4462 | 0.67 | — | — | 2.6 | – | 3 |
| 530 | NGC 7213 | 1792 | 0.97 | 12 | 22.11 | 1 | – | 3 |
| 537 | MRK 915 | 7230 | 0.49 | 47 | 22.21 | 3 | – | 4 |
| 538 | UGC 12138 | 7375 | 0.92 | 81 | 21.34 | 1 | – | 3 |
| 540 | AKN 564 | 7195 | 0.80 | 316 | 21.89 | 1 | 79 | 1 |
| 590 | MRK 590 | 7910 | 0.91 | 51 | 21.63 | 1.3 | – | 3 |
| 615 | MCG +8-11-11 | 6141 | 0.90 | 1230 | 22.29 | 3 | 85 | 1 |
| 627 | MRK 705 | 8658 | 0.77 | 56 | 21.50 | -2 | – | 3 |
| 703 | UGC 10683B | 9234 | — | 60 | 21.04 | -1 | – | 3 |
| ††footnotetext: Column 1: galaxy entry number in the de Grijp et al. (1987) catalog; ††footnotetext: Column 2: galaxy name; ††footnotetext: Column 3: radial velocity; ††footnotetext: Column 4: ratio between the semi minor and semi major host galaxy axis length; ††footnotetext: Column 5: linear extent of the radio emission; ††footnotetext: Column 6: logarithm of the 3.6cm radio luminosity (from Schmitt et al. 2001 or Kinney et al. 2000); ††footnotetext: Column 7: host galaxy morphological type, T corresponds to S0 and earlier, and T to Sc and later; ††footnotetext: Column 8: , the difference between the position angles of the radio jet and host galaxy major axis (PAPAMA); ††footnotetext: Column 9: References from which the morphological types were obtained. 1) estimated from Schmitt & Kinney (2000); 2) Malkan et al. (1998); 3) de Vaucouleurs et al. (1991); 4) NED. |
| Number | Name | Velocity | b/a | Radio Extent | Log(L3.6cm) | T | Reference | |
|---|---|---|---|---|---|---|---|---|
| (km s-1) | (pc) | (W Hz-1) | (deg) | |||||
| 16 | MRK 348 | 4540 | 0.94 | 33 | 23.18 | 0 | 5 | 3 |
| 24 | TOL 0109-38 | 3496 | 0.45 | 330 | 21.53 | 0.4 | 35 | 3 |
| 26 | MRK 1 | 4780 | 0.64 | 31 | 21.73 | 5 | – | 2 |
| 33 | MRK 573 | 5174 | 0.86 | 1003 | 21.01 | -1 | 70 | 3 |
| 37 | IRAS 01475-0740 | 5306 | 0.81 | 34 | 22.91 | -5 | – | 2 |
| 41 | ESO 153-G20 | 5917 | 0.70 | — | — | 2.6 | – | 3 |
| 52 | ESO 355-G25 | 5039 | 0.91 | — | — | 2.4 | – | 3 |
| 53 | UGC 2024 | 6714 | 0.63 | 43 | 20.83 | 2 | – | 3 |
| 57 | NGC 1068 | 1136 | 0.89 | 745 | 22.32 | 3 | 65 | 3 |
| 67 | MCG -02-08-039 | 8874 | 0.57 | 57 | 21.53 | 1 | – | 3 |
| 75 | IRAS 03106-0254 | 8154 | 0.32 | 854 | 22.18 | -2 | 51 | 4 |
| 78 | IRAS 03125+0119 | 7200 | 0.56 | 47 | 21.99 | -2 | – | 1 |
| 83 | MRK 607 | 2716 | 0.38 | 20 | 20.31 | 1 | – | 3 |
| 85 | ESO 116-G18 | 5546 | 0.43 | — | — | -0.6 | – | 3 |
| 141 | IRAS 04385-0828 | 4527 | 0.48 | 29 | 21.52 | -2 | – | 4 |
| 154 | IRAS 04502-0254 | 4737 | 0.51 | 107 | 20.28 | 0 | 7 | 4 |
| 156 | IRAS 04507+0358 | 8811 | 0.81 | 205 | 21.12 | 1 | 73 | 4 |
| 157 | ESO 33-G02 | 5426 | 0.91 | — | — | -2 | – | 2 |
| 196 | MRK 3 | 4050 | 0.84 | 375 | 22.44 | -2 | 58 | 3 |
| 236 | MRK 622 | 6964 | 0.90 | 110 | 21.24 | -2 | 35 | 3 |
| 244 | ESO 18-G09 | 5341 | 0.86 | — | — | 5 | – | 4 |
| 253 | MCG -01-24-012 | 5892 | 0.59 | 133 | 21.82 | 5 | 47 | 4 |
| 272 | NGC 3393 | 4107 | 0.87 | 683 | 21.59 | 1 | 15 | 3 |
| 281 | IRAS 11215-2806 | 4047 | 0.34 | 403 | 21.58 | -2 | 71 | 2 |
| 282 | MCG -05-27-013 | 7162 | 0.36 | 1530 | 21.71 | 1 | 84 | 3 |
| 283 | MRK 176 | 8346 | — | 135 | 21.97 | 1 | – | 3 |
| 293 | NGC 4388 | 2524 | 0.34 | 2940 | 21.11 | 3 | 70 | 3 |
| 299 | NGC 4507 | 3538 | 0.84 | — | — | 3 | – | 3 |
| 302 | TOL 1238-364 | 3285 | 0.90 | — | — | 4 | – | 3 |
| 306 | NGC 4704 | 8134 | 0.92 | 53 | 21.05 | 3.5 | – | 3 |
| 310 | ESO 323-G32 | 4796 | 0.90 | — | — | -1.3 | – | 3 |
| 313 | MCG -04-31-030 | 2957 | 0.47 | 478 | 21.08 | -2 | 26 | 3 |
| 314 | IRAS 13059-2407 | 4175 | 0.33 | 27 | 22.67 | 5 | – | 2 |
| 317 | MCG -03-34-064 | 5152 | 0.68 | 278 | 22.49 | 3 | 9 | 2 |
| 322 | ESO 383-G18 | 3837 | 0.45 | 107 | 20.73 | 0 | 90 | 4 |
| 329 | NGC 5347 | 2335 | 0.79 | 15 | 20.27 | 2 | – | 3 |
| 340 | IRAS 14082+1347 | 4836 | 0.68 | 53 | 21.20 | 1 | 4 | 1 |
| 341 | NGC 5506 | 1753 | 0.25 | 302 | 21.79 | 1 | 21 | 3 |
| 349 | IRAS 14317-3237 | 7615 | 0.76 | 286 | 21.37 | 1 | 14 | 1 |
| 354 | IRAS 14434+2714 | 8814 | 0.88 | 120 | 22.16 | 1 | – | 2 |
| 377 | UGC 9944 | 7354 | 0.33 | 3430 | 21.83 | 3 | 74 | 4 |
| 383 | IRAS 15480-0344 | 9084 | 0.89 | 59 | 22.29 | -2 | – | 2 |
| 409 | IRAS 16288+3929 | 9091 | 0.43 | 59 | 21.93 | 0 | – | 4 |
| 418 | IRAS 16382-0613 | 8317 | 0.75 | 54 | 21.49 | — | – | 1 |
| 445 | UGC 10889 | 8424 | 0.42 | 54 | 21.22 | 3 | – | 3 |
| 447 | MCG +03-45-003 | 7292 | 0.57 | 47 | 20.53 | 5 | – | 1 |
| 471 | FAIRALL 49 | 6065 | 0.89 | — | — | 1 | – | 2 |
| 501 | FAIRALL 341 | 4887 | 0.77 | — | — | -2 | – | 3 |
| 510 | UGC 11630 | 3657 | 0.47 | 24 | 20.06 | -1 | – | 3 |
| 512 | PKS 2048-57 | 3402 | 0.84 | 924 | 22.75 | -0.8 | 5 | 3 |
| 549 | UGC 12348 | 7585 | 0.29 | 118 | 21.13 | 1 | – | 3 |
| 555 | NGC 7674 | 8713 | 0.73 | 422 | 22.81 | 4 | 37 | 3 |
| 594 | MRK 1058 | 5138 | 0.58 | 33 | 20.05 | 3 | – | 2 |
| 602 | NGC 1386 | 868 | 0.37 | 20 | 20.24 | -0.6 | 35 | 3 |
| 634 | NGC 3281 | 3200 | 0.41 | 60 | 21.57 | 2.1 | – | 3 |
| 638 | UGC 6100 | 8778 | 0.66 | 57 | 21.12 | 1 | – | 3 |
| 665 | NGC 4941 | 1108 | 0.48 | 15 | 20.02 | 2 | 42 | 3 |
| 708 | ESO 103-G35 | 3983 | 0.40 | — | — | -2 | – | 4 |
| 721 | NGC 7212 | 7984 | — | 361 | 22.39 | – | – | 1 |
| ††footnotetext: Column 1: galaxy entry number in the de Grijp et al. (1987) catalog; ††footnotetext: Column 2: galaxy name; ††footnotetext: Column 3: radial velocity; ††footnotetext: Column 4: ratio between the semi minor and semi major host galaxy axis length; ††footnotetext: Column 5: linear extent of the radio emission; ††footnotetext: Column 6: logarithm of the 3.6cm radio luminosity (from Schmitt et al. 2001 or Kinney et al. 200)); ††footnotetext: Column 7: host galaxy morphological type, T corresponds to S0 and earlier, and T to Sc and later; ††footnotetext: Column 8: , the difference between the position angles of the radio jet and host galaxy major axis (PAPAMA); ††footnotetext: Column 9: References from which the morphological types were obtained. 1) estimated from Schmitt & Kinney (2000); 2) Malkan et al. (1998); 3) de Vaucouleurs et al. (1991); 4) NED. |
| Name | Type | Distance | Comments | |||
|---|---|---|---|---|---|---|
| (km s-1) | (mag) | (mag) | ||||
| MCG -02-33-034 | 1 | — | — | — | — | Interacting Galaxy |
| MCG +08-11-011 | 1 | 180a | 3.31e | — | 65′′W | |
| MRK 705 | 1 | — | 3.05e | — | 31′′S | Ring galaxy, Cartwheel like |
| MRK 915 | 1 | 71 | 1.55 | — | 119′′E | |
| MRK 1040 | 1 | 143b | 2.97 | — | 17′′N | |
| MRK 1239 | 1 | 60a | 1.67 | — | 71′′S | |
| NGC 4593 | 1 | 320 | — | 2.57c | 228′′E | |
| UGC 2514 | 1 | — | 2.25 | — | 155′′NW | |
| UGC 10683 B | 1 | 360 | — | 0.60f | 67′′NW | |
| FAIRALL 341 | 2 | — | 2.26 | — | 165′′W | |
| IRAS 13059-2407 | 2 | — | 2.27 | — | 55′′SE | |
| IRAS 14082+1347 | 2 | — | 2.76 | — | 106′′SW | |
| MCG -01-24-012 | 2 | 56 | 0.04 | — | 79′′N | |
| MCG +03-45-003 | 2 | 100 | 1.97 | — | 35′′NW | |
| MRK 1 | 2 | 100 | — | 0.25c | 111′′SE | |
| MRK 176 | 2 | 236 | 0.80 | — | 33′′W | |
| MRK 348 | 2 | 540d | 1.71 | — | 70′′E | |
| MRK 607 | 2 | 18 | 0.27 | — | 92′′N | |
| MRK 1058 | 2 | — | 2.93 | — | 61′′W | |
| NGC 3281 | 2 | — | — | 2.38c | 500′′S | |
| NGC 3393 | 2 | — | — | 2.20c | 252′′NW | |
| NGC 5506 | 2 | 99 | 0.24 | — | 227′′NE | |
| NGC 7212 | 2 | 74 | — | — | 18′′N | Interacting Galaxy |
| NGC 7674 | 2 | 139 | 1.57 | — | 32′′NE | |
| TOL 1238-364 | 2 | 235 | 0.16 | — | 105′′NE | |
| ††footnotetext: Column 1: galaxy name; ††footnotetext: Column 2: Seyfert activity type; ††footnotetext: Column 3: modulus of the difference between the radial velocities of the two galaxies; ††footnotetext: Column 4: modulus of the difference between their I magnitudes; ††footnotetext: Column 5: modulus of the difference between their B magnitudes; ††footnotetext: Column 6: Distance and direction of the companion galaxy in relation to the galaxy indicated in Column 1; ††footnotetext: Column 7: Comments. aafootnotetext: Velocity information from Kell (1996). bbfootnotetext: Velocity information from Ward & Wilson (1976). ccfootnotetext: B magnitude information from NED. ddfootnotetext: Velocity information from Dahari (1985). eefootnotetext: alleviated because the galaxy is a Seyfert 1 with strong nuclear emission. fffootnotetext: obtained from Schmitt & Kinney (2000) images. |