email: rjansen or pjakobse@astro.estec.esa.nl
The late-time expansion of the ejecta of SN 1987A111Based on observations made with the NASA/ESA Hubble Space Telescope, obtained at the Space Telescope Science Institute (STScI) and from the data archive at the STScI, which is operated by AURA, Inc., under NASA contract NAS 5-26555
Abstract
The evolution of the shape and size of the ejecta of SN 1987A is analyzed over a period of 8 years based on HST images and spectra taken between 1278 and 4336 days after the supernova outburst. We combine both proprietary and archival HST data obtained with the FOC, WFPC2 and STIS. The low resolution near-UV prism FOC spectrum obtained at day 3043 has not been described previously. Although the FWHM of the ejecta grew linearly over the time span studied, the appearance of the SN envelope also changed markedly with wavelength. At visible wavelengths (5000 Å) the ejecta became progressively more elongated, reaching an ellipticity of by day 4000. In the near-UV (2500 Å), the ejecta remained closely circular () and 50% larger in angular extent than in the visible. The FOC prism observations show that the large extent of the SN envelope is confined to a grouping of resonance lines spanning Mg i 2852, Mg ii 2795,2802Å and several Fe ii multiplets – thereby confirming that the larger size of the debris in the near-UV is due to scattering in these optically thick transitions compared to the optically thin forbidden and semi-forbidden transitions that dominate the visible spectrum. The available data are not of sufficient quality to detect the slight deviation from linear expansion expected for the outermost regions of the near-UV images as predicted by Chugai et al. (1997).
Key Words.:
supernovae: individual (SN 1987A) — supernova remnants1 Introduction
The remnant of SN 1987A and its surroundings have been extensively monitored with the Hubble Space Telescope (HST) since its commissioning, first with the aberated telescope, later with WFPC2 and the COSTAR-corrected FOC, and most recently using STIS. While much attention has been devoted to the study of the inner circumstellar ring (e.g., Panagia et al. 1991; Luo, McCray, & Slavin 1994; Plait et al. 1995; Crotts et al. 1995) and its interaction with the SN blast wave (e.g., Sonneborn et al. 1998; Crotts & Heathcote 2000; Michael et al. 2000), the evolution of the spatially resolved SN ejecta itself is also of considerable interest in its own right.
Jakobsen et al. (1991) demonstrated that the expanding envelope of SN 1987A was spatially resolved by HST already in the first FOC images taken 1278 days after the explosion. These data combined with subsequent FOC observations made on days 1754, 2511 and 2533 showed that the outer envelope of SN 1987A was expanding linearly with time in a self-similar fashion (Jakobsen et al. 1994).
The early FOC observations also revealed that the size of the SN debris varies significantly with wavelength, appearing twice as large in the near-UV (F275W filter) compared to the visible (F501N [O iii] filter). Jakobsen et al. (1993) suggested that this difference in apparent size is likely due to an opacity effect, with optical depth unity in the near-UV being reached further out in the expanding ejecta compared to the optically thin [O iii] line which probes deeper into the expanding envelope. This interpretation was further refined based upon FOS observations obtained by Wang et al. (1996) and Chugai et al. (1997), who showed that the near-UV (2350-2900) spectrum of SN 1987A spanned by the FOC F275W filter is dominated by a dense grouping of resonance lines containing Mg i 2852 and Mg ii 2795,2802 and several multiplets of Fe ii. These authors also showed that the velocity-widths of the Mg i 2852 and Mg ii 2795,2802 lines are in good agreement with the expansion velocities inferred from the FOC near-UV images, and considerably broader than those of the forbidden and semi-forbidden lines which dominate the visible spectrum.
In this paper we present previously unpublished FOC objective prism observations of SN 1987A taken on day 3043 which, by bringing together both imaging and spectroscopic information serve to further explore the cause of the wavelength dependence of the apparant size of SN 1987A. Our main finding is that the largest extent of the ejecta is indeed confined to the above grouping of high opacity near-UV resonance lines, thereby confirming this explanation for the change in apparent size with wavelength. We also compare these new FOC angular diameter measurements to matching measurements derived from archival WFPC-2 and STIS data spanning up to day 4336. We show that, provided care is taken to put the different measures onto a common system by taking the non-zero ellipticity of the SN 1987A envelope into account, the data show good agreement and are consistent with linear expansion of the SN 1987A envelope over the entire 8 year time span probed by the publicly available HST observations.
At the time of writing, some 14 years after the explosion, the afterglow of SN 1987A proper has faded beyond the reach of HST – and is likely to remain so even when the Advanced Camera for Surveys is installed. This paper is therefore an attempt at summarizing the available HST data on the shape and expansion of the SN 1987 debris.
2 Data
2.1 Day 3043 FOC Observations
Low resolution spectra of the remnant of SN 1987A were obtained using the COSTAR-corrected FOC on board HST on 1995 June 24 (JD 2,449,892; day 3043). The FOC was used in filterless mode with the F/96 near-UV objective prism inserted. A total exposure of 16683 s was obtained, divided over 12 exposures of 1221.5–1432.5 s each, with pointings dithered in a pattern for optimal removal of reseau marks and flatfield features not taken out by the standard “pipeline” procedures.
With the pixel detector format used, non-linearity in extended objects sets in at a count rate of 0.08 counts sec-1 pix-1 and saturation at 0.37 counts sec-1 pix-1. The count rates in the spectrum of the SN remnant are within the linear regime even at and [O iii], but the optical portions of companion stars 2 and 3 (in the enumeration of West et al. 1987) are severely saturated due to the low dispersion of the objective prism at the longer wavelengths. The HST roll-angle (V3 position angle) during these observations was 15.2 degrees, causing the spectrum of companion star 2 to overlap the circumstellar ring at the position of the faint foreground star (Plait, Chevalier & Kirshner 1992).
The individual exposures were reduced using the standard HST postprocessing software and subsequently combined, weighted by exposure time. To reduce the contamination of the SN remnant spectrum by the near-UV light of star 2, located NW of SN 1987A, we used a matched (in wavelength) portion of the spectrum of star 3, located to the SE, as a PSF template. None of the stars in the field of view for which we observe the optical portion of the spectrum aproximates the brightness of star 3. For subtraction of star 3 we therefore had to use a fainter star, located S of SN 1987A as a template. Although the wings of the optical PSF in the template are not sampled to sufficiently faint levels to provide a good match, subtraction of this scaled-up template does significantly reduce the contamination from star 3 at the position of the SN remnant spectrum. In the following analysis, residual light from star 3 is the dominant source of error in the SN remnant spectrum for wavelengths shortward of 3000Å.

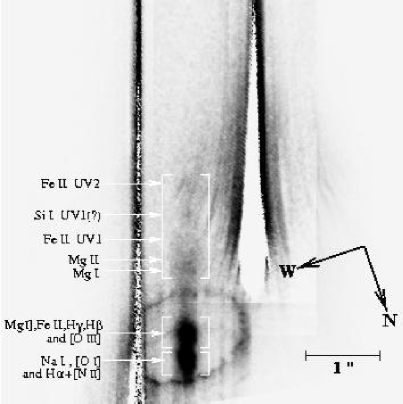
The portion of the co-added and partially subtracted FOC image showing the (slitless) near-UV prism spectrum of SN 1987A is shown in Figure 1. In this exposure, the circumstellar ring appears bright in the light of [O iii] and is faintly discernable in +[N ii]. The optical portion of the SN spectrum shows clear features, roughly located at [O iii] and +[N ii], but resulting from blends of the lines of Mg i], Fe ii, , , and [O iii] in the former and Na i, [O i] and +[N ii] in the latter case. The SN spectrum is traceable down to a wavelength of 2200 Å in the near-UV. Moreover, consistent with the previous FOC imaging observations, the near-UV spectrum is noticeably more spatially extended than the visible spectrum.
In order to explore this quantitatively we selected two pixel regions centered on the SN remnant spectrum in the spatial direction and on wavelengths 2625Å and 4850Å in the dispersion direction. Along the dispersion direction we averaged the pixel values in 93 lines and 26 lines, corresponding to 550Å and 1300Å wavelength intervals, respectively. This choice was a compromise between encompassing the respective Mg ii/Mg i/Fe ii and Mg i]//Fe ii/[O iii] features (see below), and gathering enough signal to reduce the noise while avoiding contamination from the underlying image of the ring. The resulting radial intensity profiles are presented in Figs. 2a and 2b. The FOC PSF at 2625Å and 4850Å is overlayed in each figure. The apparent size of the SN debris as measured by the FWHM of the radial intensity profiles is 3017 mas at 2625Å and 20110 mas at 4850Å. These values are corrected for the PSF. We also selected a third, 20 pixel (700Å) wide region centered at 4350Å, chosen to match a grouping of Fe ii lines and the semi-forbidden Mg i] line (see Sect. 2.2.1). By sampling the same species (Mg and Fe), a comparison between the NUV and 4350Å line groupings is likely to be cleaner than a comparison with the 4850Å band, or even with the [O iii] line. The apparent size (FWHM) of the debris measured in the radial intensity profile at 4350Å (Fig. 2c) is 18813 mas, smallest of any wavelength sampled in these data.
2.2 Archival HST data
The data on SN 1987A contained in the public HST archive consists of a large number of multifilter WFPC2 images, as well as STIS and FOS near-UV and optical spectra, and the earlier FOC imaging observations. The available data are summarized in Table 1. References to published observations are given in the final column of the table. A large portion of these data were obtained as part of the Supernova INtensive Study (SINS) project. Of the WFPC2 data, we only use the Planetary Camera chip (in the following referred to as PC2) which contains the image of the SN remnant itself.
| Day† | Date | Instrument | Data type | Filter | Exposure‡ | Proposal∗ | P.I. | Reference |
|---|---|---|---|---|---|---|---|---|
| 1278 | Aug 23 1990 | FOC | Imaging | F275W | 838 | 2999 | F. Macchetto | Jakobsen et al. 1991 |
| F501N | 1660 | |||||||
| 1754 | Dec 13 1991 | FOC | Imaging | F275W | 2200 | 3874 | F. Macchetto | Jakobsen et al. 1993 |
| F501N | 2200 | |||||||
| 2511 | Jan 08 1994 | FOC | Imaging | F275W+ND1 | 4784 | 5186 | W. Sparks | Jakobsen et al. 1994 |
| F501N | 4784 | |||||||
| 2533 | Jan 30 1994 | FOC | Imaging | F275W | 3586 | 5152 | P. Jakobsen | Jakobsen et al. 1994 |
| F501N | 3586 | |||||||
| 2537 | Feb 03 1994 | PC2 | Imaging | F255W | 2400 | 5203 | J. Trauger | Burrows et al. 1995 |
| F502N | 2400 | |||||||
| F547M | 2400 | |||||||
| F656N | 2400 | |||||||
| 2770 | Sep 24 1994 | PC2 | Imaging | F255W | 1800 | 5753 | R. Kirshner | Panagia et al. 1996 |
| F336W | 1200 | |||||||
| F439W | 800 | |||||||
| F502N | 4800 | |||||||
| F555W | 600 | |||||||
| F658N | 4800 | |||||||
| F675W | 600 | |||||||
| F814W | 600 | |||||||
| 2875 | Jan 07 1995 | FOS | Spectroscopy | G190H | 5610 | 5753 | R. Kirshner | Chugai et al. 1997 |
| G270H | 6000 | |||||||
| G400H | 4000 | |||||||
| G570H | 4000 | |||||||
| 2932 | Mar 05 1995 | PC2 | Imaging | F439W | 800 | 5753 | R. Kirshner | |
| F555W | 600 | |||||||
| F675W | 600 | |||||||
| F814W | 600 | |||||||
| 3043 | Jun 24 1995 | FOC | Spectroscopy | NUV-prism | 16200 | 6130 | P. Jakobsen | (this paper) |
| 3270 | Feb 06 1996 | PC2 | Imaging | F255W | 2300 | 6020 | R. Kirshner | |
| F336W | 1200 | |||||||
| F439W | 950 | |||||||
| F502N | 7800 | |||||||
| F555W | 600 | |||||||
| F658N | 5200 | |||||||
| F675W | 600 | |||||||
| F814W | 600 | |||||||
| 3693 | Apr 04 1997 | STIS | Imaging | OII | 2415 | 7122 | G. Sonneborn | |
| 3790 | Jul 10 1997 | PC2 | Imaging | F255W | 2600 | 6437 | R. Kirshner | Garnavich et al. 1997a |
| F336W | 1600 | |||||||
| F439W | 800 | |||||||
| F555W | 600 | |||||||
| F656N | 5600 | |||||||
| F675W | 600 | |||||||
| F814W | 800 | |||||||
| 3792 | Jul 12 1997 | F502N | 8200 | |||||
| 3878 | Oct 06 1997 | STIS | Spectroscopy | G430L | 5095 | 7434 | R. Kirshner | Garnavich et al. 1997b |
| 3879 | Oct 07 1997 | G750M | 4772 | |||||
| 3880 | Oct 08 1997 | G230L | 14082 | |||||
| 4336 | Jan 07 1999 | PC2 | Imaging | F255W | 7200 | 7434 | R. Kirshner | Garnavich et al. 1999 |
| F336W | 2400 | |||||||
| F439W | 1000 | |||||||
| F555W | 600 | |||||||
| F656N | 7200 | |||||||
| F675W | 1200 | |||||||
| F814W | 800 |
Notes: †Since the SN outburst on Feb 23, 1987; ‡Total exposure time in seconds; ∗ID number of the observing program.
2.2.1 Spectroscopic observations and line identification
In Fig. 3 we reproduce the 1995 January 7 (Day 2875) FOS spectrum presented in Chugai et al. (1997). The bandpasses of selected HST filters are overlayed to show which spectral features contribute most to the total signal in imaging observations through these filters. The identifications of the emission features were taken from Wang et al. (1996) and Chugai et al. (1997).
In the day 3880 STIS observations (1997, October 8) the 2250–3000Å wavelength region is very similar in appearance to the corresponding portion of the 1995 January 7 FOS spectrum of Fig. 3. The NUV features seen in these higher resolution spectra can also be gleaned in the dispersed 1995 June 24 FOC near-UV prism image (Fig. 1).
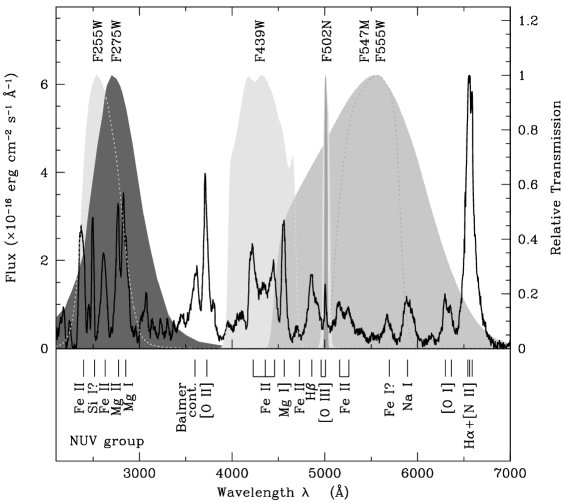
The 2350–2900Å interval used to extract the radial intensity profile of Fig 2a selects the strong NUV resonance lines of Mg ii, Mg i and Fe ii. The F255W (PC2) and F275W (FOC) filters are a good match to this ensemble of lines, although the latter places slightly more weight on the Mg lines. The narrow band filters F501N (FOC) and F502N (PC2) sample emission from [O iii] and Fe ii 5018Å. The F555W (PC2) filter samples a multitude of lines: Mg i], , [O iii], Fe ii, Na i, [O i], and +[N ii] in its red tail. Nonetheless, comparisons of F501N and F502N filter data with data in this filter are still meaningful, since the dominant lines spanned by the F555W filter are all low opacity forbidden and semi-forbidden transitions.
In the following we will treat the FOC F275W and PC2 F255W data as equivalent and sampling the resonance line dominated near-UV emission of SN 1987A. The FOC F501N and PC2 F502N, F555W and F547M imaging data are grouped in a similar manner as sampling the forbidden and semi-forbidden visible line emission from SN 1987A.
3 Results
3.1 Ellipticity of the SN debris
The FOC and PC2 imagery reveal that the shape of the SN debris in the visible became noticeably elongated after about day 2500. The later day 3792 F502N and the day 4336 F555W data show apparent axis ratios close to 0.7, whereas the earliest day 1278 and 1754 FOC data were consistent with negligible elongation (Jakobsen et al. 1993). We limit ourselves in the present discussion to the large scale structure of the SN debris. To first order the shape of the debris can be described as elliptical. It is obvious from the best S/N images, especially in the narrow-band filters, that there is fine-structure in the debris. Pun & Kirshner (1996) tentatively described the debris shape as a dumbell-shaped structure. Accurate description of these features and monitoring of their evolution over time, however, would have required excessively long exposure times to obtain the necessary signal.

We derived ellipticities from the 2nd order image moments measured in a small image section centered on the SN remnant. If we denote the 2nd order image moments by , and then the ellipticity is given by:
Initial measurements of the FWHM of the debris (see also Sect. 3.2) and the error thereon were used to define the minimum and maximum size of the image region in which to measure the ellipticities. The ellipticity was measured in a set of nested image sections with halfsizes that grow between FWHM and FWHM with increments of 1 pixel. The adopted ellipticities used in the analysis below are the weighted average of the individual measurements. These tend to be conservative in the sense that in the smaller image sections the measured ellipticity tends to be systematically higher than in the larger sections.
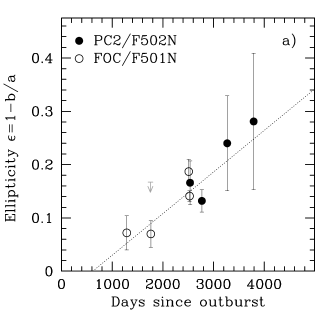
Fig. 4a shows that the ellipticity in the [O iii] narrow-band filters (FOC/F501N and PC2/F502N) increases approximately linearly with time. A weighted linear least-squares fit gives a rate of change of day-1 and onset of the elongation at day . The large errors on the PC2 F502N measurements are due in part to the larger plate scale of the PC2 CCD (compared to the FOC camera), and in part to the low signal levels in the SN debris, as these data were obtained primarily for the purpose of studying the inner circumstellar ring.
The debris shape is dramatically less elongated in the near-UV (FOC/F275W and PC2/F255W) filters compared to the [O iii] filter (Fig. 4b). It is possible that in the near-UV the ellipticity increases slowly with time, but low surface brightness, low-signal, exposures preclude a definite measure. A small constant ellipticity is consistent with the available data.
3.2 Expansion of the SN Debris
In order to quantify the expansion of the envelope of the SN debris in a consistent manner, we have to take its systematic change in elongation at the later stages into account. Also, considering the dimming and hence lower S/N ratios of the more recent data, it is necessary to characterize the size by as robust an estimator as possible. We adopt the FWHM of the intensity profile of the debris, but calculated in terms of an elliptical or equivalent radius. If the semi-major and semi-minor axes at a given surface brightness level are denoted by and , respectively, then the elliptical radius corresponding to that isophote is given by . Given an ellipticity the elliptical radius is related to the semi-major axis radius by .
For each epoch of observation and each filter, we performed aperture photometry in a set of nested circular apertures and constructed radial intensity profiles by differencing the signal in consecutive apertures. The FWHM measured in these radial intensity profiles was expressed in terms of elliptical radii by multiplication with the geometric correction term . For we adopted the empirical least-squares fits shown for F501N/F502N and F255W/F275W filters in Figs. 4, and similar fits for the other available filters. Using a simple geometric correction was possible because the spatial extent of the debris is much larger than the PSF, and the distribution of the light is fairly smooth and not very concentrated.
In Figs. 5a and b we present the resulting measures of the size of the SN debris as a function of time for both the visible (F501N, F502N, F547M and F555W) and near-UV (F255W and F275W) data sets. Also plotted are the equivalent “two dimensional” spectroscopic measures derived from the day 3043 FOC near-UV prism data shown in Fig. 2, and a high-quality near-UV point derived in the same way from the day 3880 STIS G230L-grating spectrum. In the case of the spectroscopic measures we also applied a (small) geometric correction to account for the mismatch of the position angles of the dispersion axis and the major axis of the SN debris.
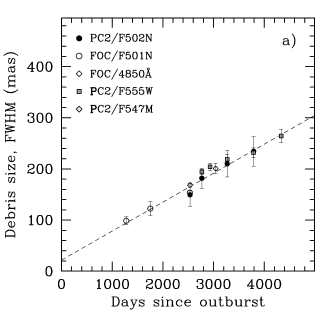

The best-fit linear expansion rates are (10.340.84) mas yr-1 for the combined visible, and (16.270.83) mas yr-1 for the combined near-UV data. For a distance to SN 1987A of 51 kpc (Panagia et al. 1991) this corresponds to effective expansion velocities of 2500 and 3930 km s-1, respectively. These values match the earlier results obtained by Jakobsen et al. (1994) from the FOC data of days 1278, 1754 and 2522 to within the respective errors.
3.2.1 Deviations from linear expansion?
The FOC objective prism observations presented above leave little doubt that the larger apparent size of the SN 1987A envelope in the near-UV is due to the emission at these wavelengths being subjected to multiple scattering and reprocessing in the optically thick resonance transitions of Mg i/Mg ii/Fe ii ions located in the outer, faster moving regions of the ejecta as suggested by Wang et al. (1996) and Chugai et al. (1997).
However, as pointed out by the latter authors, in this case one does not expect the outermost regions of the ejecta to grow in a strictly linear fashion. Specifically, in the case of conservative scattering in a linearly expanding envelope displaying a power-law density profile , the radius at which optical depth unity is reached is expected to increase with time as .
As discussed by Chugai et al. (1997), optical depth unity in the Mg ii line is reached in the very outmost regions of the ejecta corresponding to expansion velocities of order km s-1, where most models assume a very steep density gradient corresponding to . Hence Chugai et al. predicted that outer boundary of the envelope of SN 1987A should expand more slowly than linearly; i.e., as in the near-UV.
As is evident from Fig. 5, the growth of the size of the SN1987A debris – when defined in terms of the FWHM of the images – remains consistent with linear expansion out to the last available data point (day 4336; 1999 Jan 7) in both the visible and the near-UV. However, these measures probe velocities in the range 2500–4000 km s-1. To see the effect predicted by Chugai et al. we need to go 2–3 times further out in the images, corresponding to angular radii of order mas and brightness levels % of peak and fainter.
For the anticipated deviation from linearity at these large radii is only of order between day (and the last high-quality FOC F275W imaging data) and day (and the last PC2 F255W images). Unfortunately, the available late-time HST data on SN 1987A do not allow us to detect such a relatively subtle effect. As is clear from Fig. 2, the outer regions of interest beyond mas radius in the FOC prism data are seriously hampered by contamination from the dispersed images of star 3 and the circumstellar ring. Likewise, as is evident from Fig. 5(b) the S/N ratio of the later day PC2 and STIS data are too low to permit a measure of the image sizes at, say, 10% peak at the required accuracy.
We conclude that there is unfortunately no chance of detecting the effect predicted by Chugai et al. in the late-time HST data – and that the apparent linear expansion displayed in Fig. 5 therefore does not challenge the resonance scattering explanation for the wavelength dependence of the size of the SN 1987A debris.
4 Conclusions
We have presented HST FOC near-UV objective prism observations of the ejecta of SN 1987A taken on 1995 June 24 (3043 days after the SN outburst). We have combined these data with available archival FOC, WFPC2, and STIS data to study the late-time expansion of the SN debris over a period of 8 years. Our main findings are:
1) Provided the pronounced ellipticity of the SN image seen in the visible data is taken into account, the available data are consistent with the SN envelope having expanded linearly in time at all wavelengths out to the last data point sampled (1999 January 7; day 4336).
2) Throughout this expansion, the apparent size of the ejecta, expressed in terms of the FWHM of the radial intensity profile, remained some 50% larger in the near-UV than in the visible.
3) The FOC near-UV prism spectrum reveals that the large spatial extent of the SN 1987A image is confined to the 2350-2900 Å wavelength region containing the resonance lines of Mg i, Mg ii and Fe ii, thereby confirming the suggestion of Wang et al. (1996) and Chugai et al. (1997) that the larger apparent size of the SN 1987A envelope in the near-UV is due to multiple scattering and reprocessing in these transitions in the outer regions of the envelope.
References
- (1) Burrows C. J., et al., 1995, ApJ452, 680
- (2) Chugai N. N., Chevalier R. A., Kirshner R. P., Challis P., 1997, ApJ483, 925
- (3) Crotts A. P. S., Kunkel W. E., Heathcote S. R., 1995, ApJ438, 724
- (4) Crotts A. P. S., Heathcote S. R., 2000, ApJ528, 426
- (5) Garnavich P., Kirshner P., Challis P., et al., 1997a, IAU Circ. 6710, 2
- (6) Garnavich P., Kirshner P., Challis P., et al., 1997b, IAU Circ. 6761, 1
- (7) Garnavich P., Kirshner P., Challis P., et al., 1999, IAU Circ. 7102, 1
- (8) Jakobsen P., Albrecht R., Barbieri C., et al., 1991, ApJ369, L63
- (9) Jakobsen P., Macchetto F., Panagia N., 1993, ApJ403, 736
- (10) Jakobsen P., Jedrzejewski R., Macchetto F., Panagia N., 1994, ApJ435, L47
- (11) Luo D., McCray R., Slavin J., 1994, ApJ430, 264
- (12) Michael E., McCray R., Pun C. S. J., et al., 2000, ApJ542, L53
- (13) Panagia N., Gilmozzi R., Macchetto F., Adorf H. M., Kirshner R. P., 1991, ApJ380, L23
- (14) Panagia N., Scuderi S., Gilmozzi R., et al., 1996, ApJ459, L17
- (15) Plait P., Chevalier R., Kirshner R. P., 1992, IAU Circ., No. 5592
- (16) Plait P. C., Lundqvist P., Chevalier R. A., Kirshner R. P., 1995, ApJ439, 730
- (17) Pun C. S. J., Kirshner R. P., 1996, AAS 189, 4504
- (18) Sonneborn G., Pun C. S. J., Kimble R. A., et al., 1998, ApJ492, L139
- (19) Wang L., Wheeler J. G., Kirshner R. P., et al., 1996, ApJ466, 998
- (20) West R. M., Lauberts A., Jørgensen H. E., Schuster H.-E., 1987, A&A177, L1