Chandra and RXTE Spectroscopy of the Galactic Microquasar XTE J1550564 in Outburst
Abstract
On two occasions, we obtained nearly simultaneous kilosecond snapshot observations of the Galactic black hole and microquasar XTE J1550564 with Chandra and RXTE near the peak of its May, 2000 outburst. The low-energy sensitivity of Chandra and the resolution of the High Energy Transmission Grating Spectrometer (HETGS), coupled with the broad energy range and large collecting area of RXTE, have allowed us to place constraints on the outburst accretion flow geometry of this source in the “intermediate” X-ray state. The 0.65–25.0 keV continuum spectra are well-described by relatively hot ( keV) accretion disk and hard () coronal power-law components. Broad, relatively strong Fe K emission line ( eV) and smeared absorption edge components consistent with Fe XXV are strongly required in joint spectral fits. The resolution of the Chandra/HETGS reveals that the broad Fe K emission lines seen clearly in the individual RXTE spectra are not due to an intrinsically narrow line.
keywords:
Black hole physics – accretion – line:profiles – relativity – X-rays:bursts – X-rays:stars1 Introduction
XTE J1550564 is a transient Galactic black hole. At the time of writing, four outbursts — each separated by clear quiescent periods — have been observed from this source. Radio observations during its 1998–1999 outburst revealed optically thick emission, with apparent superluminal motion (v) (Hannikainen et al. 2000). As a result, XTE J1550564 was further classified as a “microquasar.” Recently, Orosz et al. (2002) have constrained the mass of the black hole primary in this system through optical observations of the source in quiescence ().
The accretion flow geometry of Galactic black holes in outburst may change considerably with the mass accretion rate (), which is often assumed to be traced directly by the soft X-ray luminosity (see, however, Homan et al. 2001). In transient outbursts, the soft X-ray luminosity may suddenly rise, and decay over a period ranging between days and months; from quiescence to the outburst peak, the luminosity may increase by a factor of or more. In all such systems, periods of characteristic X-ray timing and spectral behaviors and correlated multi-wavelength properties are observed which are known as “states” (for reviews, see Tanaka & Lewin 1995, Belloni 2001, Done 2002; for a critical discussion see Homan et al. 2001). The existence of states likely indicates that only certain accretion modes and geometries are allowed in Galactic black hole systems.
At luminosities below , the geometry is particularly uncertain; the accretion disk may be recessed to (see, e.g., Esin, McClintock, & Narayan 1997; for a competing description see Ross, Fabian, & Young 1999). In contrast, near peak outburst luminosity — — there is general agreement that the accretion disk may extend to the marginally stable circular orbit. In such cases, the disk may serve as a probe of the general relativistic regime around the black hole.
This regime can be explored through continuum spectroscopy (e.g., through the multi-colour disk blackbody model, Mitsuda et al. 1984), studies of high frequency quasi-periodic oscillations (QPOs) in the X-ray lightcurve (possibly associated with the Keplerian frequency at the marginally stable circular orbit), and through studies of Fe K line profiles and X-ray reflection spectra (Fabian et al. 1989, Miller et al. 2002a; George & Fabian 1991, Ross, Fabian, & Young 1999). XTE J1550564 and GRO J165540 are the only two dynamically-constrained Galactic black holes for which each of these tools has revealed evidence of an accretion disk at the marginally stable orbit, and perhaps evidence of black hole spin (Sobczak et al. 1999, Sobczak et al. 2000; Remillard et al. 1999a, Homan, Wijnands, & van der Klis 1999; Strohmayer 2001, Miller et al. 2001a).
We obtained two nearly-simultaneous observations of XTE J1550564 with Chandra and RXTE near the peak of its May, 2001 outburst, at source luminosities of and (0.65–10.0 keV) for kpc (Orosz et al. 2002). Our short kilosecond observations with Chandra were designed for a much brighter source; the sensitivity achieved does not permit detailed studies of the Fe K line region. However, we are able to confirm that broad Fe K emission lines in the RXTE spectra are not due to an intrinsically narrow line.
2 Outburst History and Observation
XTE J1550564 was discovered on 7 September 1998 (Smith 1998), by the All Sky Monitor (ASM) aboard the Rossi X-ray Timing Explorer (RXTE). A radio (Campbell-Wilson et al. 1998) and optical counterpart (Orosz, Bailyn, & Jain 1998) was quickly identified. The ensuing outburst lasted until June 1999, and displayed some of the most remarkable behavior yet seen in an X-ray nova, e.g. an initial flare which reached a flux level equivalent to 6.8 Crab (1.5–12 keV, RXTE/ASM), very rapid state transitions, and strong (7% rms) QPOs at frequencies as high as 285 Hz (Sobczak et al. 2000, Homan et al. 2001).
On 2 April, 2000, new source activity was noticed by the RXTE ASM (Smith et al. 2000). XTE J1550564 was active in X-rays for nearly 70 days thereafter, and reached a peak flux of 1 Crab (ASM, 1.5-12 keV); it was also seen out to 300 keV with BATSE aboard CGRO, and simultaneously in optical bands (Masetti & Soria 2000, Jain & Bailyn 2000). Spectrally-inverted radio emission, likely from a compact jet, is detected in the low/hard state, as well as a possible discrete ejection event at the low/hard – intermediate state transition (Corbel et al. 2001). The ASM light curve and (5–12 keV)/(3–5 keV) hardness ratio of this outburst is shown in Figure 1. The lightcurve of the first outburst of XTE J1550564 departed radically from a typical profile (Homan et al. 2001), but the second outburst is more similar to a fast-rise exponential-decay (or, “FRED”) envelope.
Near the peak of this outburst, Miller et al. (2001a) report simultaneous high-frequency QPOs at 188 Hz and 276 Hz. These QPOs appear in an approximate 2:3 ratio like the 300 Hz and 450 Hz QPOs found in observations of GRO J165540 (Strohmayer et al. 2001). If these QPOs are tied to the Keplerian frequency at the marginally stable circular orbit, they provide evidence for black hole spin. Tomsick et al. (2001a) and Kalemci et al. (2001) discuss the spectral and timing properties, respectively, of the declining phase of this outburst.
On 28 January, 2001, RXTE found XTE J1550564 to be in the low/hard state, with timing noise of 40% rms and a spectrum well-described by a power-law with (Tomsick et al. 2001b). On 10 January, 2002, RXTE again found XTE J1550564 to be in the low/hard state. Belloni et al. (2002) report that the timing and spectral properties typical of the low/hard state in this short outburst.
The second outburst of XTE J1550564 met the trigger criteria for our approved Chandra AO-1 target of opportunity (TOO) program, as well as our RXTE AO-5 TOO program. In all, we made seven observations of XTE J1550564 with Chandra (18 observations with RXTE). Of these, here we report on the first two observations only (see Table 1), when the source was brightest. Of the remaining Chandra observations, in two cases the HETGS failed to insert, and in two other cases the source intensity was too faint for our graded, continuous-clocking observational mode to yield good spectra, but the source was clearly detected (for a good discussion of continuous clocking mode, see Marshall et al. 2001). Imaging data from a final observation will be presented in separate work.
3 Data Reduction
3.1 RXTE Modes and Selections
The RXTE data we report here were obtained through pointed observations of the proportional counter array (PCA), which consists of five individual proportional counter units (PCUs). Due to gain uncertainties in PCU-0 following the loss of its propane layer, we exclude data from this detector. With this exception, we include data from all layers of all active detectors (see Table 1; for observation R1 this includes PCUs 2, 3, and 4; for observation R2 this includes PCUs 1, 2, 3, and 4). The data was reduced using the LHEASOFT suite (version 5.1). We apply the standard “goodtime” and detector “deadtime” corrections. The background was calculated using the “bright source” model within LHEASOFT. Response matrices were made using the tool “pcarsp.”
At the resolution of the PCA, the spectrum of the Crab nebula is known to be a simple power-law. We fit a spectrum from the Crab obtained on 14 May 2000 (as close to our observations as possible), with a power-law index for the pulsar component of 1.8 (Knight, 1982) and a column density of (Massaro et al, 2000). Below 3 keV, residuals are very large, and so we fix 3 keV as our lower fitting bound. Similarly, above 25 keV, residuals in fits to the Crab are large, and our data from XTE J1550564 becomes dominated by the background flux, so we adopt this energy as an upper fitting bound. As we wish to address the iron line region in XTE J1550564, we consider residuals as a function of energy in power-law fits to this Crab observation. We find that with the addition of 0.4% systematic errors in the 3–8 keV band, and 0.8% systematic errors in the 8–25 keV band, the reduced fitting statistic drops to 1.0 (similar results were obtained by Tomsick et al. 2001a). Therefore, we add this energy-dependent systematic error to our PCA data from XTE J1550564.
3.2 Chandra Modes and Selections
XTE J1550564 was observed with the Chandra HETGS using the ACIS-S CCD array operating in continuous clocking (CC) mode. Because XTE J1550564 had flared to 6.8 Crab (1.5–12 keV) during its 1998 outburst, avoiding damage to the ACIS array was a paramount concern. To this end, we employed a large dither (20” amplitude) to spread the most intense parts of the zeroth order over many pixels. Furthermore, the zeroth order aim point was shifted toward the top of the chip via a SIM-Z translation of 10.0mm from the nominal S3 aim point. A 1.33’ Y-offset was used to place the iron Kα region of the HEG 1 order on ACIS-S3. Finally, we blocked-out rows 367–467, eliminating any read-out of zeroth-order photons. This blocking acted to limit any telemetry saturation that would result from the zeroth-order counts. The CC mode was employed to limit pile-up of the dispersed spectrum and to achieve 3 msec time resolution.
As our observing mode is non-standard, the data is not well-suited to reduction via the tools available in the CIAO suite. We have managed to build robust, custom software to reduce and analyse our data. We first correct for bad aspect times (e.g. slewing, see Table 1). The events are then examined in projected chip-x space to correct for “hot” pixels which report erroneously large event numbers (a list of bad pixels is available through CIAO). ACIS-S4 sometimes produces “streaks” which appear in the ACIS chip image (see http://asc.harvard.edu); the events were removed using a 50 column median filter, rejecting deviations greater than 3. The spacecraft dither pattern is removed by calculating the mean chip-x position as a function of time, which is a sine wave. We are able to interpolate the dither-corrected chip x position of each event by removing this sine wave. With the dither removed, it is possible to calculate the wavelength corresponding to each chip-x value via the grating equation. A linear gain correction is performed on each of the four independent read-out and amplifier nodes on each ACIS-S chip. Finally, we extract first-order MEG and HEG events and background regions, and apply the appropriate response matrices.
Indeed, although we have blocked-out the zeroth-order photons, we are able to accurately locate the position of the zeroth-order, and therefore are able to convert accurately from chip x space to wavelength or energy space via the grating equation. To do this, we make use of the fact that the ACIS chips are silicon-based, and that silicon has an absorption edge at 1.8395 keV. For an assumed zeroth-order position, then, we can examine the location of this edge in the HEG 1 and HEG 1 spectra (which are on opposite sides of the zeroth-order position) and iterate the assumed zeroth-order position until the edge is seen at the same energy in both (see Figure 2).
As per Marshall et al. (2001), we perform an effective area correction, and add 5% systematic errors to the dispersed spectra. Due to the fact that our Chandra observations were offset towards the top of the ACIS-S array, less of the HEG and MEG 1 orders were read-out in comparison to the HEG and MEG 1 orders. Moreover, with the spacecraft dither, the portions of the HEG and MEG 1 spectra dispersed far from the zeroth order were moved onto and off of the ACIS-S array. This is reflected in the spectra we obtained from the truncated orders, which show significant deviations from the shape expected based on the spectra obtained with RXTE. Therefore, we only consider the HEG 1 and MEG 1 spectra from our Chandra observations.
Even after rebinning by a factor of 10, flux bins below 0.65 keV in the MEG 1 spectrum are consistent with zero. The HEG 1 spectrum suffers from low effective area below 1.0 keV, displaying a flux trend inconsistent with the MEG 1 spectrum. These energies serve as lower fitting bounds. We exclude data from regions near gaps in the ACIS-S CCD array. In the MEG 1 spectrum we exclude the 0.74-0.80 keV band. There is another gap between 2.2–3.0 keV in this grating order, and at higher energies the effective area of the HEG is higher. We therefore adopt 2 keV as an upper fitting bound for the MEG order. We exclude the 1.3–1.4 keV and 3.2–4.2 keV bands in the HEG 1 spectrum, and set 10.0 keV as an upper fitting bound (this is the effective upper energy limit of the HEG).
4 Analysis and Results
The reduced spectra were analyzed using XSPEC version 11.1.0 (Arnaud et al. 1996). All errors quoted in this paper reflect the difference between the best-fit value, and the value of the parameter at its 90% confidence limits.
We fit the spectra from the Chandra/HETGS and the RXTE/PCA spectra simultaneously; spectra R1 and C1 are nearly simultaneous, and spectra R2 and C2 are simultaneous (see Table 1). Joint fits are desirable to characterize the continuum emission, as the range of the Chandra/HETGS is well-suited to measuring the soft spectral component expected from an accretion disk, and the RXTE/PCA range is well-suited to contraining the hard power-law spectral component.
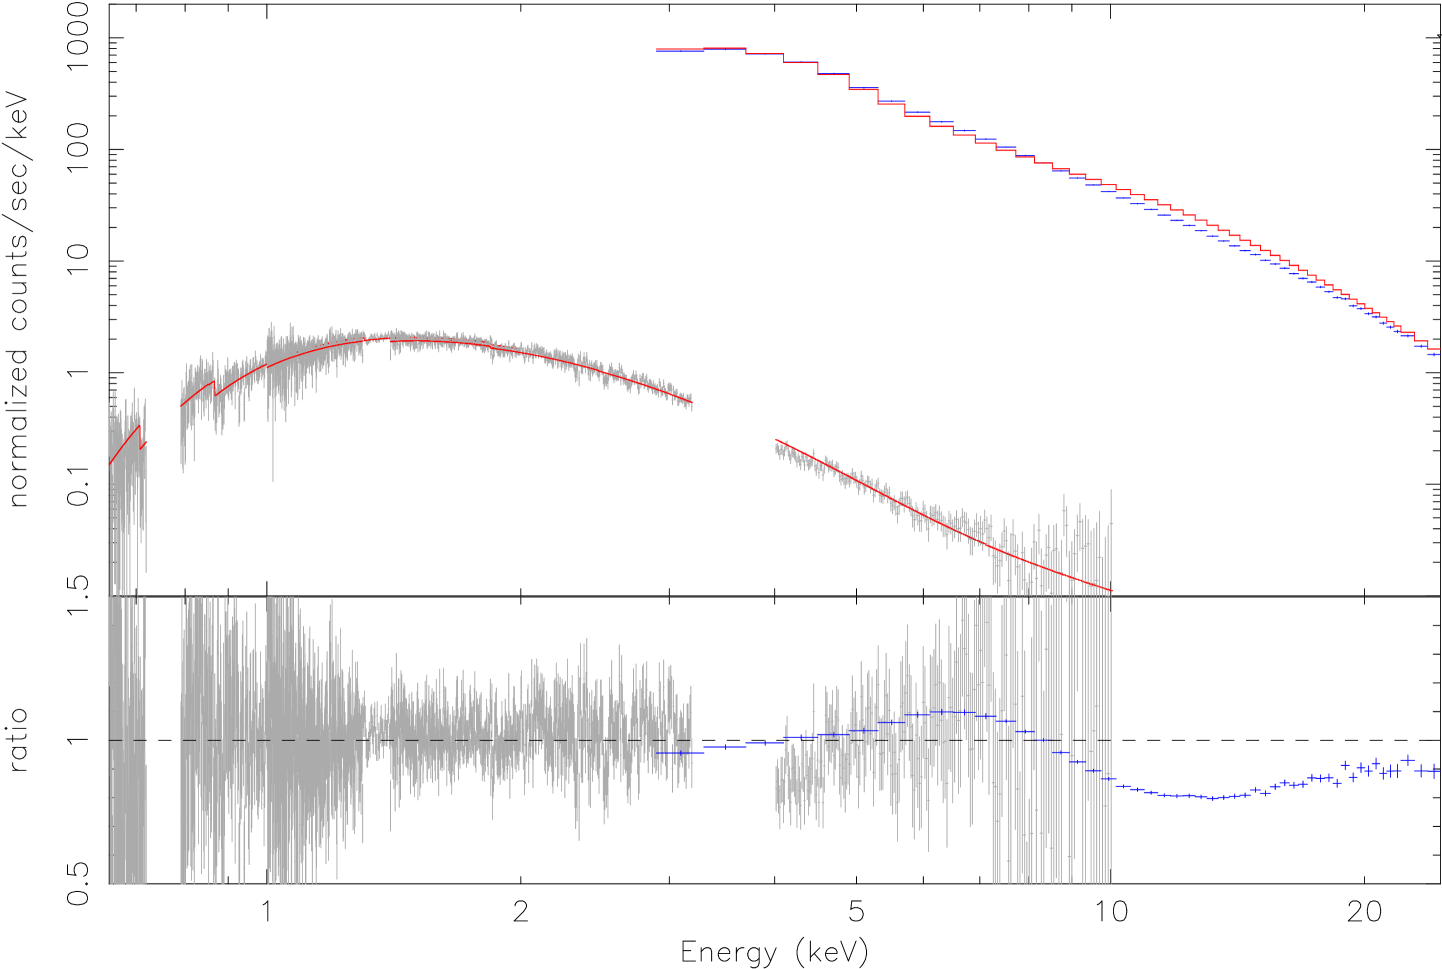
Fits with a model consisting of interstellar absorption (“phabs” in XSPEC), a multi-colour disk (MCD) blackbody component (Mitsuda et al. 1984), and a power-law component did not yield acceptable fits ( ). Fits with Comptonization models such as “compTT” (Titarchuk 1994) and the “bulk motion Comptonization” model (Shrader & Titarchuk 1999) gave slightly worse fits. This is principally due to strong residuals in the Fe Kα region. We therefore add a broad Gaussian line and smeared edge (“smedge” within XSPEC; Ebisawa et al. 1994). This is the same model used by Sobczak et al. (2000) in fits to the 1998–1999 outburst of XTE J1550564, and to be consistent with this prior work we fix the width of the edge to 7.0 keV, and the width (FWHM) of the line to 1.2 keV. The widths are poorly constrained when allowed to vary (th 90% confidence error limits are approximately 50% of the assumed values). The addition of line plus edge combination consistent with neutral iron (E keV, E keV) does improve the fit considerably (), but this is not an acceptable fit. When the Gaussian and smeared edge energies are allowed to float, values consistent with helium-like Fe XXV (E keV, E keV) are preferred statistically. We fix these values in our final model, and acceptable fits are achieved: 0.996 (R1C1), 1.017 (R2C2). As a first test of whether or not the line is intrinsically narrow, we also made fits with a Gaussian of zero width. The fit obtained is not statistically acceptable (), suggesting that the observed line is not merely instrumentally broadened.
We report the best-fit model parameters in Table 2; the data and the best-fit model are shown in Figure 3. We measure an equivalent neutral hydrogen column density of N. Relatively high inner disk colour temperatures are found with the MCD model (kT keV and kT keV, respectively). We measure power-law indices of and , respectively. The unabsorbed fluxes measured via our model are listed in Table 3; in the energy range we consider the disk flux is approximately 60% of the total. These spectral results are consistent with the XTE J1550564 being in the intermediate state at the time of our observations (this is confirmed by X-ray timing results, see Miller et al. 2001a). The broad Fe K emission line is relatively strong and highly significant; we measure equivalent widths of eV and eV, respectively. We measure the optical depth of the smeared edge to be and , respectively.
For a known source distance and inclination, the MCD model gives a measure of the inner disk radius via the model normalization. Assuming the mean values for the black hole mass (), system inclination (), and distance ( kpc) reported by Orosz et al. (2002), we measure inner disk radii of km and km (corresponding to and , respectively). As these values are within the marginally stable circular orbit () for a non-spinning (Schwarzschild) black hole, they may imply a black hole with significant angular momentum in XTE J1550564.
4.1 Testing for narrow features.
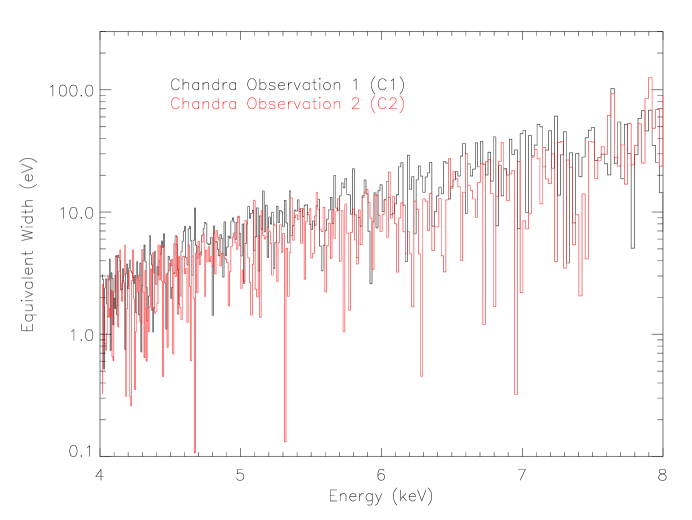
To further examine whether or not a single emission line might merely be smeared by the PCA response to produce the broad Fe K line required in joint fits, we calculated the 95% confidence upper-limits on the strength of single-bin emission lines in the Chandra/HETGS spectra (see Figure 4). Due to Auger destruction, intermediate Fe ion species are not likely to be observed; relatively few narrow Fe K lines (e.g., Fe I, XXV, XXVI at 6.40, 6.68, and 6.97 keV, respectively) are expected. It is clear that the upper-limits on line features at these energies are a fraction of the eV equivalent width of the broad lines required in joint fits. The spectra we obtained are of too coarse a sensitivity to detect narrow emission or absorption features like those found in the high/soft state of XTE J1650500 (Miller et al. 2002b).
5 Discussion
We have analyzed spectra from two nearly-simultaneous Chandra/HETGS and RXTE observations of the Galactic microquasar XTE J1550564. We jointly fit the 0.65–25.0 keV spectra with a continuum model consisting of two components: a multi-colour disk blackbody (likely from an accretion disk) and a power-law (likely from a corona). This simple model described the data better than Comptonization models. The data strongly require the addition of a broad Gaussian emission line and smeared edge features consistent with Fe XXV (see Section 3 and Table 2). This model may be regarded as an approximation to a full reflection model in the 0.65–25.0 keV band.
The multi-colour disk blackbody model yields a measure of the inner accretion disk edge. Our fits give inner disk radii of and , which suggests that XTE J1550564 may harbor a spinning black hole. If the Shimura & Takahara (1995) colour correction is applied (, for stellar-mass black holes) black hole spin is not required. However, this correction may be overly simplifed. Merloni, Fabian, & Ross (2000) have detailed more systematic difficulties with the inner disk estimates of this model, but suggest that the MCD model may give acceptable inner disk measures at high . The 284 Hz QPO found in the 1998–1999 outburst of this source (Homan et al. 1999, 2001) and the 276 Hz QPO found in this outburst (Miller et al. 2001a) also suggest a spinning black hole.
Broad Fe K emission line studies may provide another means of diagnosing the accretion flow geometry and black hole spin, as these lines are plausibly produced by irradiation of the inner disk (Fabian et al. 1989). We find that lines with widths of 1.2 keV (FWHM) adequately describe our data. Intrinsically narrow lines (with widths fixed at zero, as per a line with a FWHM less than the RXTE/PCA resolution) give significantly worse fit results. Moreover, the Chandra/HETGS spectra confirm that the line is not likely due to an intrinsically narrow line which is smeared by the resolution of the RXTE/PCA (see Section 3 and Figure 4). The sensitivity achieved with our Chandra/HETGS snapshot observations is not sufficient to constrain the parameters of more sophisticated line models which can estimate the inner disk extent more directly (and thereby black hole spin, e.g. Miller et al. 2002a). The 1.2 keV (FWHM) width we adopt in fits with a Gaussian model is not broad enough to require black hole spin, but it does suggest significant Doppler shifting. Compton broadening may also contribute to the observed line width.
Our best-fit spectral model is the same as that adopted by Sobczak et al. (2000) in fits to RXTE spectra from the 1998–1999 outburst. The parameters we measure are broadly consistent with those reported previously when XTE J1550564 was found to be in the very high or intermediate states. The properties of these states are quite similar, and they are only distinguished by relative luminosity (if multiple such states are observed, the most luminous may be called the “very high” state, and the others “intermediate” states). The Fe K emisson line equivalent widths we measure ( eV) are consistent with the strongest lines reported by Sobczak et al. (2000). We speculate that the sensitivity and energy range of the Chandra/HETGS spectra have allowed for a better characterization of the continuum spectrum, and therefore a better characterization of the line parameters as well.
At present, few very high and intermediate states have been observed relative to the more common high/soft and low/hard states. The spectra we have observed are similar to other very high and/or intermediate states observed in the RXTE and BeppoSAX era, including: XTE J1650500, GRO J165540, GRS 1739278, XTE J1748288, and XTE J2012381 (Miller et al. 2002, Sobczak et al. 1999, Borozdin et al. 1998, Miller et al. 2001b, Campana et al. 2002).
6 Acknowledgments
We wish to acknowledge Harvey Tananbaum, Fred Seward, Jean Swank, Evan Smith, and the Chandra and RXTE operations staffs, for executing and coordinating these TOO observations. We thank Chandra scientist David Huenemoerder for sharing his analysis software expertise, and RXTE/PCA scientist Keith Jahoda for his generous help with the PCA detector response. We thank Ron Remillard for helpful discussions. W. H. G. L. gratefully acknowledges support from NASA. R. W. was supported by NASA through Chandra fellowship grant PF9-10010, operated by the Smithsonian Astrophysical Observatory for NASA under contract NAS8-39073. This research has made use of the data and resources obtained through the HEASARC on-line service, provided by the NASA–GSFC.
References
- [1] Arnaud, K. A., 1996, in ASP Conf. Ser. 101, Astronomical Data Analysis Software and Systems V., eds. G. H. Jacoby & J. Barnes (San Francisco: ASP), 17
- [2] Belloni, T., in “X-ray Emission from Accretion onto Black Holes,” 2001, eds. T. Yaqoob & J. H. Krolik, available at http://www.pha.jhu.edu/groups/astro/workshop2001/
- [3] Belloni, T., Colombo, A. P., Homan, J., Campana, S., van der Klis, M., 2002, A & A, in press
- [4] Borozdin, K., N., Revinivtsev, M. G., Trudolyubov, S. P., Aleksandrovich, N. L., Sunyaev, R. A., & Skinner, G. K., 1998, AstL, 24, 435
- [5] Campbell-Wilson, D., McIntyre, V. Hunstead, R., Green, A., Wilson, R. B., & Wilson C. A., 1998 IAU Circ., 7010
- [6] Campana, S., et al., 2002, A & A, 384, 163
- [7] Corbel, S., et al., 2001, ApJ, submitted
- [8] Done, C., 2002, in “Philosophical Transactions of the Royal Society,” Series A: Mathematical, Physical, and Engineering Sciences, astro-ph/0203246
- [9] Ebisawa, K., et al., 1994 PASJ 46, 375-394
- [10] Esin, A. A., McClintock, J. E., and Narayan, R., 1997, ApJ 489, 865
- [11] Fabian, A. C., Rees, M. J., Stella, L., & White, Ne. E., 1989, MNRAS, 238, 729
- [12] George, I. M., & Fabian, A. C., 1991, MNRAS, 249, 352
- [13] Hannikainen, D., et al. 2000, in “Proceedings of the Third Microquasar Workshop: Granada Workshop on galactic relativistic jet sources”, Eds: A. J. Castro-Tirado, J. Greiner and J. M. Paredes, Astrophysics and Space Science, in press
- [14] Homan, J., Wijnands, R., & van der Klis, M., 1999, IAU Circ. 7121, 2
- [15] Homan, J., et al., 2001, ApJS, 132, 377-402
- [16] Kalemci, E., Tomsick, J. A., Rothschild, R. E., Pottschmidt, K., & Kaaret, P., 2001, ApJ, 563, 239
- [17] Knight, F. K., 1982, ApJ, 260, 538
- [18] Marshall, H. L., et al., 2001, AJ, 122, 21
- [19] Masetti, N., and Soria, R., 2000, IAU Circ., 7399
- [20] Massaro, E., Susumano, G., Litterio, M., & Mineo, T., 2000, A & A, 361, 695
- [21] Merloni, A., Fabian, A. C., & Ross, R. R., 2000, MNRAS, 313, 193
- [22] Miller, J. M., et al., 2001a, ApJ 563, 928
- [23] Miller, J. M., et al., 2001b, ApJ 546, 1055
- [24] Miller, J. M., et al., 2002a, ApJ, 570, L69
- [25] Miller, J. M., et al., 2002, ATEL 81
- [26] Mitusda, K., et al., 1984, PASJ, 36, 741
- [27] Orosz, J. A., Bailyn, C., & Jain, R., 1998, IAU Circ., 7009
- [28] Orosz, J. A., et al., 2002, ApJ, 568, 845
- [29] Remillard, R. A., et al., 1999a, ApJ, 517, L127
- [30] Ross, R. R., Fabian, A. C., & Young, A. J., 1999, MNRAS, 306, 461
- [31] Shahbaz, T., van der Hooft, F., Casares, J., Charles, P. A., & van Paradijs, J., 1999, MNRAS, 306, 89
- [32] Shimura, T., & Takahara, F., 1995, ApJ, 445, 780
- [33] Shrader, C., & Titarchuk, L., 1999, ApJ, 521, L21
- [34] Smith, D. A., 1998, IAU Circ., 7008
- [35] Smith, D. A., Levine, A. M., Remillard, R. Fox, D., & Shaefer, R., 2000, IAU Circ., 7399
- [36] Sobczak, G. J, et al. 1999, ApJ, 520, 776
- [37] Sobczak, G. J., et al. 2000, ApJ, 544, 993
- [38] Strohmayer, T., E., 2001, ApJ, 552, L49
- [39] Tanaka, Y., and Lewin, W. H. G., 1995, in “X-Ray Binaries,” ed. W. H. G. Lewin, J. van Paradijs, & E. P. J. van den Heuvel (Cambridge, UK: Cambridge University Press)
- [40] Titarchuk, L, 1994, ApJ, 434, 314
- [41] Tomsick, J. A., Corbel, S., and Kaaret, P., 2001a, ApJ 563, 229
- [42] Tomsick, J. A., Smith, E., Swank, J., Wijnands, R., and Homan, J., 2001b, IAU Circ., 7575
| No. | Obs.ID | Date, UT | Start Time | Day (year 2000) | Exp. (s) | Good Time (s) |
|---|---|---|---|---|---|---|
| C1 | 680 | 05/03/00 | 21:10:40 | 122.9 | 3380 | 2670 |
| C2 | 681 | 05/06/00 | 12:54:09 | 125.5 | 3770 | 2170 |
| R1 | 50134-02-04-00 | 05/03/00 | 16:33:20 | 122.7 | 4860 | 4860 |
| R2 | 50134-02-06-00 | 05/06/00 | 12:50:08 | 125.5 | 3960 | 3960 |
 |
 |
| Obs. | kTMCD | NMCD | Npl | Nline | EWline | red. | |||
|---|---|---|---|---|---|---|---|---|---|
| (keV) | (eV) | ||||||||
| R1C1 | 0.996 | ||||||||
| R2C2 | 1.017 |
| Obs. | Range | Total | MCD | Power-law | Line |
|---|---|---|---|---|---|
| (keV) | ( cgs) | ( cgs) | ( cgs) | ( cgs) | |
| R1C1 | 0.5–10.0 | ||||
| R1C1 | 0.65–25.0 | ||||
| R2C2 | 0.5–10.0 | ||||
| R2C2 | 0.65–25.0 |
 |
 |