The North Ecliptic Pole Supercluster
Abstract
We have used the ROSAT All-Sky Survey to detect a known supercluster at in the North Ecliptic Pole region. The X-ray data greatly improve our understanding of this supercluster’s characteristics, approximately doubling our knowledge of the structure’s spatial extent and tripling the cluster/group membership compared to the optical discovery data. The supercluster is a rich structure consisting of at least 21 galaxy clusters and groups, 12 AGN, 61 IRAS galaxies, and various other objects. A majority of these components were discovered with the X-ray data, but the supercluster is also robustly detected in optical, IR, and UV wavebands. Extending Mpc)3, the North Ecliptic Pole Supercluster has a flattened shape oriented nearly edge-on to our line-of-sight. Owing to the softness of the ROSAT X-ray passband and the deep exposure over a large solid angle, we have detected for the first time a significant population of X-ray emitting galaxy groups in a supercluster. These results demonstrate the effectiveness of X-ray observations with contiguous coverage for studying structure in the Universe.
Subject headings:
cosmology: observations — galaxies: clusters: general — large-scale structure of universe — X-rays: general1. Introduction
Superclusters (SCs) are the ultimate manifestation of hierarchical large-scale structure (LSS) in the Universe. With a median major axis of Mpc (Jaaniste et al. 1998), they are the most massive and the largest possibly bound structures known. “Great walls” of galaxies have been discovered that are larger than what one normally calls a SC, but they are almost certainly not gravitationally bound (Geller & Huchra 1989). Observations and numerical simulations suggest that a rich hierarchy of constituents trace a SC. Massive galaxy clusters are linked by smaller galaxy groups in the high-density regions, while filamentary distributions of galaxies fill out the expansive, low-density domains. SCs are not isolated entities but the top-level components of a “cosmic web” of LSS (Tully 1987; Bond, Kofman, & Pogosyan 1996; Einasto et al. 1997).
Despite their ubiquity in our overall impression of the Universe, SCs are nonetheless exceedingly rare relative to other types of objects. The extreme properties of SCs are the results of the initial conditions of the nascent universe developed by structure formation mechanisms. SCs are so large that the crossing time of the member clusters is greater than the Hubble time. Hence the imprint of the initial conditions has not been erased by internal motions. Therefore understanding the nature of SCs is of great cosmological importance.
Much effort has been expended to locate SCs, primarily in the optical regime. Galaxy surveys provide nearly all-sky sampling of the local universe out to (e.g. CfA, Huchra, Vogeley, & Geller 1999), while more restricted slice surveys (e.g. LCRS, Shectman et al. 1996) reach to . Galaxy clusters are more sparsely distributed but efficiently probe SCs to intermediate redshifts () across essentially the entire sky (e.g. Bahcall & Soneira 1984; Batuski & Burns 1985; Einasto et al. 1997; Ebeling et al. 1998).
Here we report on the successful application of X-ray data, featuring high sensitivity over a large, contiguous solid angle, to characterize SCs and LSS. We have used the ROSAT All-Sky Survey to detect a substantial SC in the North Ecliptic Pole (NEP) region – a structure discovered in the optical by Batuski & Burns (1985) with subsequent X-ray detections by Burg et al. (1992). We have for the first time detected a significant number of X-ray emitting galaxy groups in a SC yielding a greatly enhanced understanding of its extent and content. These X-ray data combined with optical, IRAS, and HST/UV observations make the NEP Supercluster (NEPSC) one of the most broadly detected superstructures known.
Throughout this letter we assume a Hubble constant of km sMpc-1 and a deceleration parameter of , however the major conclusions do not change for other reasonable cosmologies. Co-moving distances are reported unless otherwise indicated.
2. Observations
2.1. ROSAT NEP Survey
The ROSAT All-Sky Survey (RASS) is the first all-sky survey with an imaging X-ray detector (Trümper 1983; Voges et al. 1999). The NEP region of the RASS possesses the deepest exposure ( ks) and consequently the greatest sensitivity (median flux limit, = 7.8 10-14 erg s-1 cm-2 [0.5–2.0 keV]) of the entire survey (Voges et al. 2001). We have identified the physical nature of 99.6% of the 445 X-ray sources with fluxes measured at greater than significance in the 9∘ 9∘ survey region centered on the NEP (Henry et al. 2001). Of these, 64 (14.4%) are galaxy clusters and groups. X-ray luminous clusters are detected out to , while low-luminosity groups of galaxies are well-sampled to .
Our primary motivation for pursuing the ROSAT NEP Survey was to construct a complete sample of X-ray selected galaxy clusters, and use it to examine X-ray cluster luminosity evolution and to characterize LSS. The initial evolution results are presented by Gioia et al. (2001), while the first findings relevant to LSS are presented in this Letter. We emphasize the cluster sample is unique in that it is both deep in flux sensitivity and contiguous on the sky.
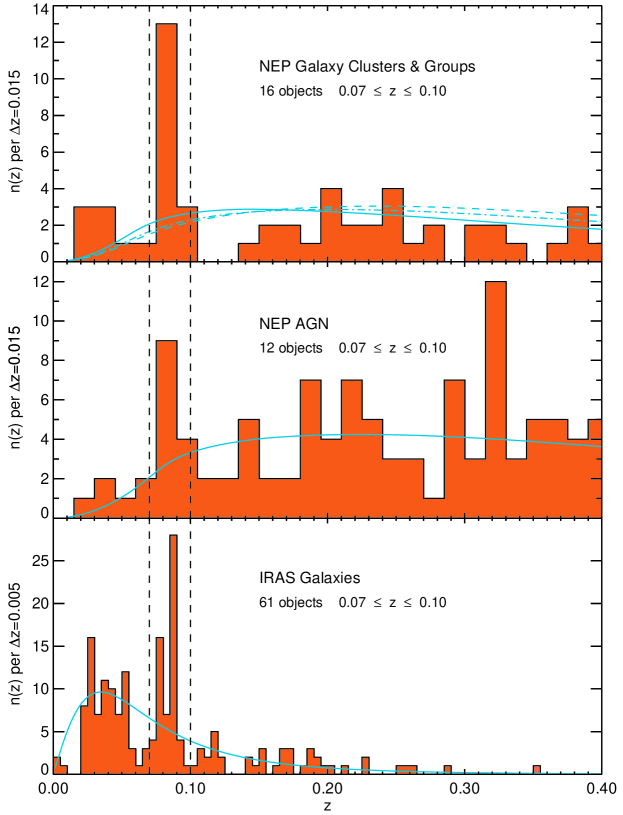
In the top panel of Fig. 1 we plot the observed ROSAT NEP cluster redshift distribution along with the expected distribution for a spatially homogeneous, non-evolving cluster population. The latter is calculated by folding the local cluster X-ray luminosity function (XLF, Ebeling et al. 1997; De Grandi et al. 1999; H. Böhringer 2000, private communication) through the ROSAT NEP Survey selection function. The observed redshift distribution shows a striking feature at . Sixteen clusters lie in the redshift interval , 25% of the entire cluster sample. Depending on which XLF determination is used, this interval is 3.3 to 4.3 times more populated than expected which is significant at the to level.
Active galactic nuclei (AGN) are the dominant class of X-ray emitters in the ROSAT NEP survey (49.0% of all sources) and they are another means for examining LSS. Though they are more sporadic markers than clusters, they reach to greater depths (). A density enhancement around is also seen in the redshift distribution of ROSAT NEP AGN. The middle panel of Fig. 1 shows the observed distribution compared to a spatially homogeneous, evolving AGN population. Twelve AGN are observed in the redshift interval where 5.6 are predicted from the AGN XLF (Miyaji, Hasinger, & Schmidt 2000). Note, an additional peak () in the AGN redshift distribution at is comprised of two separate groups of AGN.
Using only the ROSAT X-ray data and supporting optical observations from within the NEP survey boundaries, we have detected a significant LSS consisting of at least 16 galaxy clusters and groups, plus 12 AGN, one BL Lac, and an isolated elliptical galaxy with an X-ray luminosity commensurate with that of a poor cluster. Note there are additional SCs and clusters of AGN in the ROSAT NEP data. These structures along with spatial correlation analyses for the cluster and AGN samples will be discussed in forthcoming papers.
2.2. Other Relevant Optical/X-ray/IR/UV Observations
The presence of LSS in the vicinity of the NEP was first noted in a pioneering study by Batuski & Burns (1985). They produced a finding list of SC candidates (SCC) based on a percolation analysis of Abell clusters, and found an association of six clusters (A2301, A2304, A2308, A2311, A2312, A2315) approximately 5∘ from the NEP (SCC #47). Only two of these clusters had spectroscopic redshifts at the time, the remainder having photometric estimates. More recent percolation studies, working with improved redshift data, recovered the SC candidate (SC#34/2, Zucca et al. 1993; #97, #170, Einasto et al. 1994, 1997), with the latter two analyses noting an additional cluster A2295. Four of the Abell clusters (A2295, A2301, A2304, A2308) lie within the ROSAT NEP survey boundaries and are easily detected in X-rays. The other three (A2311, A2312, A2315), though barely outside the NEP region, are detected in the ROSAT Bright Source Catalog (BSC, Voges et al. 1999).
During the early phase of the ROSAT mission Burg et al. (1992) combined a 50 ks pointed observation with all-sky scans to identify five X-ray clusters and groups between redshifts 0.08 and 0.09 within 1.5∘ of the NEP. Except for one very low luminosity group discovered in the pointed data (Hasinger, Schimdt, & Trümper 1991) which is below our flux limit, our survey recovers these detections. We examined all X-ray sources in the ROSAT BSC within 10∘ of the known SC members. There are no additional candidate galaxy clusters or groups in the redshift interval . The nearest candidate (RX J1827.6+6135, , Böhringer et al. 2000) is just outside both the NEP survey region and the nominal SC redshift boundary, and is not included in our analysis.
The IRAS satellite mapped the infrared sky in a mode similar to ROSAT, and hence also has enhanced sensitivity at the NEP. Ashby et al. (1996) tested models of starburst galaxy evolution using a sample of IRAS galaxies within 1.5∘ of the NEP and noted the strong effect of LSS. Fifteen galaxies, 20% of their IR-selected sample, lie between redshifts 0.085 and 0.090 with . Rinehart et al. (2000) have expanded the IRAS survey to 56 deg2. This extended IRAS sample (Fig. 1, lower panel) has 61 galaxies in the redshift interval where 30.9 are expected representing a excess. These IRAS sources are predominantly spirals found outside the dense cluster environment. The galaxies form a sheet estimated to be three times as dense as the Great Wall (Geller & Huchra 1989).
Additional evidence of structure in the NEP region is a Ly absorber detected at in the direction of a well-known QSO H1821+643 (). Tripp et al. (1998) identified this absorbing system during a study of low-redshift weak Ly absorbers using HST UV spectroscopy. This QSO was originally discovered via its high X-ray luminosity and is the brightest source in the ROSAT NEP Survey.
3. Discussion
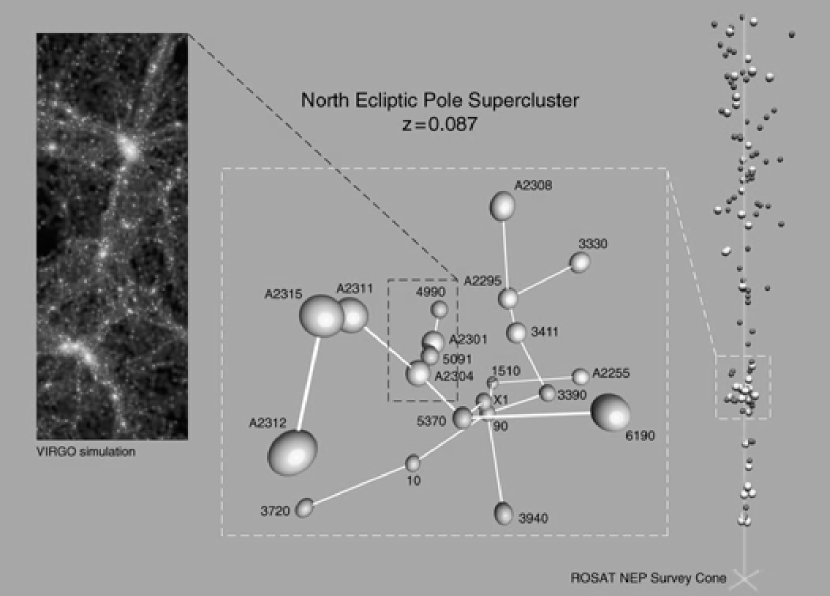
A three-dimensional view of the conical NEP survey volume, showing the distribution of clusters, groups, and AGN out to , is presented in Fig. 2 (right). The NEPSC is clearly visible as an over-density of X-ray emitters at (Mpc). This complex is relatively disconnected, with a candidate void lying on the high redshift side (). The nearest non-SC clusters are RX J1827.6+6135, A2293, and A2275 at respectively 64.7, 87.2, and Mpc.
We use the non-weighted inertia tensor for the NEPSC groups and clusters to determine the principal axes and estimate the size, shape, and orientation of the structure. The maximal extents in three orthogonal directions are Mpc)3 with a 12∘ extent on the sky. The major and minor axes are oriented 42∘ and 85∘ relative to our line-of-sight. The NEPSC is basically an oblate ellipsoid seen nearly edge-on. Consequently, the effect of flattening the SC in the line-of-sight direction in going from real space to redshift space is less important than would be in a face-on scenario such as with the Great Wall.
All eight Abell clusters associated with the NEPSC are detected in X-rays with luminosities in the range of 0.2–3.6 erg s-1 [0.5–2.0 keV]. Note that three clusters discovered by the ROSAT NEP Survey in this luminosity range are missing from the Abell catalog, indicative of the incompleteness inherent to optical selection. Furthermore, there are an additional 10 groups of galaxies with X-ray luminosities in the range 2–9 erg s-1 [0.5–2.0 keV]. This is the first time a large sample of X-ray emitting galaxy groups has been identified in a SC.
Fig. 2 (middle) shows a close-up view of the NEPSC where the groups and clusters have been linked together by a minimum spanning tree. Minimum, median, and maximum link distances are respectively 5.6, 24.2, and Mpc. The massive Abell clusters that initially delineated the SC are linked together by newly discovered, less massive X-ray clusters and groups which bridge the region between the previously known SC and a very rich cluster of galaxies (A2255) at the same distance, but not previously associated with this structure. The new realization of the NEPSC has doubled in physical size and tripled in cluster content. If this SC is characteristic of others, then SCs can be substantially larger than what is shown by the Abell clusters alone.
Filaments are the fundamental element of cosmic structure present in all modern numerical simulations of LSS. The NEPSC is oriented in Fig. 2 (middle) to display a possible filament containing two groups and two clusters. The length of the filament, the distance between A2304 and NEP 4990, is Mpc. We also show in Fig. 2 (left) a filament from a Virgo consortium +CDM () numerical simulation (Jenkins et al. 1998) of LSS selected to resemble the NEP structure. The NEPSC filament is potentially the best match yet observed in X-rays to what is seen in the simulations (see Briel & Henry 1995 and Scharf et al. 2000 for previous observations).
4. Summary
The fortunes of experimental design and serendipity have converged at the NEP to reveal a prominent example of LSS in the Universe. The NEPSC () is one of the most robustly sampled superstructures known — 21 X-ray emitting clusters of galaxies demark the highest density regions while 12 X-ray selected AGN and over 60 IRAS galaxies trace out the lower density domains. The Mpc)3 complex is strongly detected in X-ray, optical, IR, and UV wavebands. Detailed follow-up observations with Chandra, XMM-Newton and ground-based facilities will permit us to examine the dynamics of the structure, the evolutionary state of its constituents, and the degree of alignments between the member clusters. The SC’s edge-on orientation makes it an attractive candidate in which to look for filaments of diffuse X-ray emitting gas.
We have combined contiguous coverage with high sensitivity in X-rays to efficiently detect objects in a SC ranging from AGN and poor galaxy groups to rich galaxy clusters. This is the first time a sizable number of X-ray emitting galaxy groups has been identified in a SC, thus yielding a better reckoning of a SC’s girth and content. The ROSAT NEP Survey demonstrates the effectiveness of X-rays for studying LSS and advocates a next generation, large format X-ray survey mission to propel this field of study to the next level.
References
- (1)
- (2) Ashby, M. L. N., Hacking, P. B., Houck, J. R., Soifer, B. T., & Weisstein, E. W. 1996, ApJ, 456, 428
- (3)
- (4) Bahcall, N. A., & Soneira, R. M. 1984, ApJ, 227, 27
- (5)
- (6) Batuski, D. J., & Burns, J. O. 1985, AJ, 90, 1413
- (7)
- (8) Böhringer, H., et al. 2000. ApJS, 129, 435
- (9)
- (10) Bond, J. R., Kofman, L., & Pogosyan, D. 1996, Nature, 380, 603
- (11)
- (12) Briel, U. G., & Henry, J. P. 1995, A&A, 302, L9
- (13)
- (14) Burg, R., et al. 1992, A&A, 259, L9
- (15)
- (16) De Grandi, S., et al. 1999, ApJ, 513, L17
- (17)
- (18) Ebeling, H., Edge, A. C., Fabian, A. C., Allen, S. W., Crawford, C. S., & Böohringer, H. 1997, ApJ, 479, L101
- (19)
- (20) Ebeling, H., Edge, A. C., Böhringer, H., Allen, S. W., Crawford, C. S., Fabian, A. C., Voges, W., & Huchra, J. P. 1998, MNRAS, 301, 881
- (21)
- (22) Einasto, M., Einasto, J., Tago, E., Dalton, G.B., & Andernach, H. 1994, MNRAS, 269, 301
- (23)
- (24) Einasto, M., Tago, E., Jaaniste, J., Einasto, J., & Andernach, H. 1997, A&AS, 123, 119
- (25)
- (26) Geller, M. J., & Huchra, J. P. 1989, Science, 246, 897
- (27)
- (28) Gioia, I. M., Henry, J. P., Mullis, C. R., Böhringer, H., Briel, U. G., Voges W., & Huchra, J. P. 2001. ApJ, in press
- (29)
- (30) Hasinger, G., Schmidt, M., & Trümper, J. 1991, A&A, 246, L2
- (31)
- (32) Henry, J. P., Gioia, I. M., Mullis, C. R., Böhringer, H., Briel, U. G., Voges W., & Huchra, J .P. 2001. ApJ, in press
- (33) Huchra, J. P., Vogeley, M. S., & Geller, M. J. 1999, ApJS, 121, 287.
- (34)
- (35) Jaaniste, J. J., Tago, E., Einasto, M., Einasto, J., Andernach, H., & Müller, V. 1998. A&A, 336, 35
- (36)
- (37) Jenkins, A., et al. 1998, ApJ, 499, 20
- (38)
- (39) Miyaji, T., Hasinger, G., & Schmidt, M. 2000, A&A, 353, 25
- (40)
- (41) Rinehart, S. A., Ashby, M. L. N., Hacking, P. B., & Houck, J. R. 2001, ApJ, submitted
- (42)
- (43) Scharf, C., Donahue, M., Voit, G. M., Rosati, P., & Postman M. 2000, ApJ, 528, L73
- (44)
- (45) Shectman, S. A., Landy, S. D., Oemler, A., Tucker, D. L., Lin, H., Kirshner, R. P., & Schechter, P. L. 1996, ApJ, 470, 172
- (46)
- (47) Tripp, T. M., Lu, L., & Savage, B. D. 1998, ApJ, 508, 200
- (48)
- (49) Trümper, J. 1983, Adv. Space Res. 27, 1404
- (50)
- (51) Tully, R. B. 1987, ApJ, 323, 1
- (52)
- (53) Voges, W., et al. 1999, A&A, 349, 389
- (54)
- (55) Voges W., Henry, J.P., Böhringer, H., Briel, U.G., Mullis, C.R., Gioia, I.M., & Huchra, J.P. 2001. ApJ, in press
- (56)
- (57) Zucca, E., Zamorani, G., Scaramella, R., & Vettolani, G. 1993, ApJ, 407, 470
- (58)
A high-resolution color version of this figure is available at http://www.ifa.hawaii.edu/~mullis/papers/nepsc.ps.gz