Dusty Debris Around Solar-Type Stars: Temporal Disk Evolution
Abstract
Using ISO-ISOPHOT we carried out a survey of almost 150 stars to search for evidence of emission from dust orbiting young main sequence stars, both in clusters and isolated systems. Over half of the detections are new examples of dusty stellar systems, and demonstrate that such dust can be detected around numerous stars older than a few years. Fluxes at 60 and either 90 or 100 for the new excess sources together with improved fluxes for a number of IRAS-identified sources are presented. Analysis of the excess luminosity relative to the stellar photosphere shows a systematic decline of this excess with stellar age consistent with a power law index of .
1 Introduction
Circumstellar disks are generally accepted as a natural by-product of star formation (e.g. Shu et al., 1993), and there is considerable observational evidence for the presence of such disks around very young solar mass stars e.g. Sargent, 1996, and references therein; Natta, Grinin, & Mannings, 2000; Andre, Ward-Thompson, & Barsony, 2000; Mundy, Looney, & Welch, 2000; Wilner & Lay, 2000. The IRAS detection of far infrared radiation from main sequence stars at a level much greater than could be attributed to the stellar photospheres was, nonetheless, unexpected (e.g. Aumann et al., 1984). These stars became known as “Vega-type” stars, after one of the first examples. This infrared excess radiation was interpreted as thermal emission from dust in orbit about the stars c.f. Backman & Paresce, 1993, and references therein; Lagrange, Backman, & Artymowicz, 2000. Early coronographic observations of scattered light from the Vega-type star Pictoris indicated an edge-on disk morphology (Smith & Terrile, 1984). Recent imaging of thermal emission at mid-IR and mm wavelengths from Vega-type stars, including HR 4796A, MWC 480, and Eridani, continue to provide support for the disk interpretation (Koerner et al., 1998; Jayawardhana et al., 1998; Holland et al., 1998; Mannings, Koerner, & Sargent, 1997; Greaves et al., 1998). Dramatic disk-like images in reflection around HR 4976A and the Herbig Ae/Be star HD 141569 have been recently published (Schneider et al., 1999; Weinberger et al., 1999; Augereau et al., 1999).
Typically, the ages of T-Tauri stars with associated disks are of order years old or less. The Vega-type stars have ages ranging from to years. While known examples of Vega-type systems are fairly well studied, their limited number provides little information on the evolution of circumstellar dust during these later epochs. Yet it is these later epochs that are of critical importance to understanding the development of planetary systems (Lagrange et al., 2000). Gathering a statistical sample of intermediate age objects is difficult. Not only is the time to evolve from proto-planetary to planetary debris disks likely to be brief, but disk emission drops dramatically with age as grains grow and/or dissipate, reducing the emitting surface area. As planetary embryos form close to the stars, the hot inner dust is probably cleared. There are also many mechanisms capable of reorganizing or removing the outer primordial circumstellar dust, including grain growth, Poynting-Robertson drag, and radiation pressure, in times short compared to the ages of older Vega-type stars. In fact, for older stars to exhibit dusty disks there must be an ongoing source of particles; a favored explanation is that some planetesimals are colliding and fragmenting. There is substantial evidence that extrasolar planets are common (Marcy, Cochran, & Mayor, 2000), implying smaller planetesimals, collisions of which could provide a reservoir of circumstellar dust, are also common.
Since thermal emission from the little remaining outer, cooler material peaks at wavelengths of , airborne or space-based instruments are required to detect intermediate age and older disks. However, IRAS, with sensitivities of a few hundred mJy at 60 and 100 , detected only the nearest and brightest disks – mostly those associated with main sequence stars of spectral type A. In addition, the low spatial resolution of IRAS limited the ability to determine if emission was associated with a specific object, particularly at 100 where galactic cirrus confusion is significant. ISO, with a factor of two improvement in resolution, pixels at , and an order of magnitude increase in sensitivity over IRAS, has expanded our capability to search for circumstellar dust.
Here we describe our ISO program111A NASA/ISO Key Project. of observations to search for dusty circumstellar material, especially around stars of spectral types F and G, and also to study the evolution of disks from the pre-main sequence through the main sequence stages. Details of the target selection are presented in Section 2; an account of observations, data reduction and basic results is given in Section 3; excess radiation calculations are described in Section 4. Results and implications of our observations are discussed in Section 5, and summarized in Section 6.
2 Target Selection
Our targets fell into three distinct categories:
1. Main sequence members of relatively nearby, generally pc, open clusters including Persei, Coma Berenices, Hyades, Pleiades, and the Ursa Major nucleus and stream. Cluster ages are between 50 and 700 Myrs and the target stars span spectral types A through K.
2. Selected classical and weak-line T Tauri stars in the Chamaeleon I, Scorpius, and Taurus star forming clouds at pc. Some of these were detected by IRAS but beyond 60 microns only upper limits to the fluxes are available.
3. A small sample of relatively nearby, pc, isolated stars with indications of youth.
A major problem in defining an evolutionary sequence for circumstellar disk characteristics arises because it difficult to assign an age to an isolated star. Age determinations rely on a number of factors including the star’s position in the HR-diagram, its metallicity, and the depth of its convection layer. Even with well-defined observable parameters, the calculated age can vary greatly depending on stellar models used. For stars in clusters, a more accurate age determination is possible based on the main sequence turn-off point. By selecting target objects from well-studied clusters, ages are fairly well defined. In order to encompass a variety of evolutionary characteristics in any associated disk, stars in our sample clusters range from the pre-main sequence (PMS), ages Myr, to the young main sequence, ages up to 1 Gyr. Reasons to include pre-main sequence stars in our study are to establish the initial characteristics of the dusty material whose evolution we wish to understand and to enable an assessment of the fraction of weak-line T Tauri stars (WTTs) which support disks. Weak-line T Tauri stars are similar to classical T Tauri stars (CTTs), but exhibit only weak H emission and show no other indications of the presence of an accreting disk (Calvet, Hartman, & Strom, 2000).
Since the contrast between radiation from the stellar photosphere and the disk increases with longer wavelengths, we confined our search to ISO’s 60 and 90/100 wavelength bands. IRAS 3 sensitivity limits at 60 and 100 were typically 200 – 300 mJy and 500 – 3000 mJy respectively, depending on the degree of cirrus confusion. Pre-launch sensitivity estimates for ISOPHOT, on which we based our original target selections, were of order 1 mJy (3 RMS) with a 256 s observation in these bands. Since an F0 V star at 100 pc typically has photospheric fluxes of 3.6 and 1.2 mJy at 60 and 100 , respectively, we expected photospheric fluxes characteristic of near-solar-type stars could be detected out to distances of about 100 pc. Beyond this distance and for later-type stars, only fairly strong emission in excess of photospheric values would be detected. Consequently, our candidate open clusters needed to be nearby, pc. In the late stages of star formation, at ages Myr, disks are more likely to be brighter and could be detected up to about 200 pc. Our choice of candidate clusters was also constrained by conflicts with ISO Core programs and the ISO pointing restrictions. Complete surveys were out of the question. Nevertheless, the ISO lifetime was sufficient to enable some observations in all clusters we considered interesting.
Table Dusty Debris Around Solar-Type Stars: Temporal Disk Evolution lists the clusters from which we selected targets, along with their ages, distances, the number of targets observed, observing modes, and integration times.
Target stars in the young open clusters were selected from lists of cluster members published by Prosser (1992) for Persei, by Boesgaard (1987) and Bounatiro (1993) for Coma Berenices, by Schwan (1991) for the Hyades, by Soderblom et al. (1993a) for the Pleiades, and by Boesgaard, Budge, & Burck (1988), Soderblom & Clements (1987) and Soderblom et al. (1993b) for Ursa Major. Within each cluster, preference was given to targets with relatively low cirrus confusion, as determined from the IRAS Sky Survey background measurements. In Coma Berenices, a sparse cluster with few confirmed members and relatively low cirrus, we included nearly all dwarf stars with spectral types later than A0. By including all possible Ursa Major candidates not reserved by ISO core programs, we sampled a wide range of spectral types in this cluster, from early A to early K, although most objects are of spectral types F and G. For the remaining clusters where there were larger numbers of candidates available, we gave preference to stars with spectral types near solar, mostly late F- and G-type stars. When choosing targets in the Hyades, we also took into account indications of potential far infrared excesses based on IRAS 12 and 25 data. Binarity was not a cause for exclusion from our sample because we hoped to increase understanding of the relationship between circumstellar dust and multiplicity. Finally, we made efforts to include targets with a range of rotational velocities to assess the relationship between the presence of a disk and stellar rotation.
Very young stars included CTTs and WTTs in the Chamaeleon I association selected from the published lists of Gauvin & Strom (1992) and Alcala et al. (1995), WTTs in Taurus from Wichmann et al. (1996), and WTTs in the Upper Scorpius association from Walter et al. (1994). In Chamaeleon I, most sources have measured IRAS fluxes at 12 and/or 25 but lack good quality measurements at 60 and/or 100 . Other WTTs were selected to span the range of the limited age estimates available, and for lower cirrus confusion.
We also included 19 field stars (hereafter referred to as Young Field Stars) which exhibited indications of youth, primarily based on published chromospheric activity age indicators. We intended to limit distances to less than 60 pc, but following the publication of Hipparcos data it became clear that two observed stars are actually more distant than this cutoff. Like the cluster stars, the Young Field Stars span the age range 60 to 800 Myr with a median of 180 Myr. They encompass spectral types A through K, but are concentrated on spectral types F and G. Individual stellar ages are presented in Table Dusty Debris Around Solar-Type Stars: Temporal Disk Evolution.
3 Observations and Results
We selected the ISOPHOT C100 detector (Lemke et al., 1996) for our target observations. Targets were observed throughout the ISO mission, and our observing strategies changed as our understanding of ISOPHOT performance improved. The first group of 63 observations was made between 1996 June and 1996 December. The majority employed the 60 and 100 filters and the triangular chopping mode with a 150 arcsec throw. Eight stars in Coma Berenices (see Table 3) were observed with a “staring chain” – an on-target observation followed by a background observation 3 arcmin north of the target, then the next on-target observation, etc., first in the 60 filter, then in the 100 filter. The second group of 85 observations was made between 1997 June and 1998 March using the 60 and 90 filters and the raster mode in a 33 grid with 46 arcsec steps. A list of total integration times and number of targets observed in each cluster is presented in Table Dusty Debris Around Solar-Type Stars: Temporal Disk Evolution.
Data reduction made use of the ISOPHOT Interactive Analysis (PIA) package version 7.3 (Gabriel et al., 1997) and was supported by our own routines. Our final results are based on data from Off-Line Processing (OLP) version 7.0. Standard reduction parameters were used for linearization of ramps, 2-threshold deglitching, first-order polynomial voltage ramp fitting, and reset interval correction. Slope deglitching was slightly modified by using a sigma range of 2.4 and max/min clipping. Chopped observations were corrected with the default chopper-loss factors given by the ISOPHOT Team (Gabriel et al., 1997). Dark-current subtraction employed the orbital-dependent model values. Finally, to limit the influence of the non-linear response of the detector to a change in flux, we discarded the first third of each raster pointing.
We calibrated the data with the on-board Faint Calibration Source (FCS) measurements. Since there is significant evidence for detector drifts during observation, the best strategy obtains calibration measurements immediately before and after a target observation. For the staring and chopped observations, which were all made before the detector drift was well understood, FCS measurements were made at the beginning and end of a group of individual observations. Calibration factors were then interpolated for each target and background observation. For raster observations, FCS measurements were made immediately before and after each target observation and calibration factors interpolated at each raster step. The application of the FCS calibration also removes a first order flat-field. Residual effects exist, but in general their magnitude is less than the other observational uncertainties. As far as possible, these FCS-based calibrations were cross-checked by comparing the method of calibration from the observed ISO and published IRAS backgrounds and a number of actual IRAS source measurements as described by Silverstone, Becklin, & Spangler (1998), Silverstone (2000) and Spangler et al. (1999) and were found to be consistent. A more detailed discussion of the calibration comparisons is given in Appendix A. We are confident the PIA calibration using the FCS measurements is sufficiently reliable to support our conclusions. Corrections for the point-spread function (PSF) were applied using model calculations which give the fraction flux falling on the center pixel of the array as 0.66, 0.57 and 0.54 at 60, 90 and 100 , respectively (Laureijs, 1999)222 Article available at http://www.iso.vilspa.esa.es/users/expl_lib/PHT_list.html. A more detailed discussion of the standard data reduction procedures is presented by Silverstone (2000).
For all observing strategies used here, a source was considered detected if the flux at the on-target (center) pixel exceeded three times the standard deviation of the flux on the eight surrounding pixels. This provided a conservative approach to problematic observations. In all cases, the standard deviation of the flux on the surrounding pixels is higher than any other statistical uncertainties associated with the observation. In five cases – all in the Chamaeleon and Scorpius clusters – the source was extended to one outer pixel. This pixel was excluded from the calculation of the background standard deviation. At both 60 and 100 , typical 3 noise limits for chopped observations were 100 mJy in 256 s. For raster observations, corresponding limits were 50 mJy at 60 and 40 mJy at 90 in 473 s. In regions of very low cirrus, the noise limits were as much as a factor of three lower. Conversely, in regions with high cirrus confusion, the noise limits were as much as a factor of five higher. These sensitivities are much worse than originally anticipated and, as a result, the detection of excesses was somewhat compromised. A complete list of all observed targets with signals and uncertainties is presented in Table 3 and Table 4.
A total of 36 targets were detected out of 148 observed. One-third of the detections are in the young Chamaeleon cluster.
4 IR Excesses
In order to determine if there is excess emission at the wavelengths observed, a good estimate of the stellar photospheric flux is required. For non-PMS cluster members more distant than the Hyades (46 pc), the photospheric contributions at 60, 90 and 100 are negligible compared to the measured ISOPHOT sensitivities (see Section 3). For stars in the Hyades and closer and PMS stars, we estimated the photospheric flux from published K-band magnitudes (Alcala et al., 1995; Gauvin & Strom, 1992; Lawson, Feigelson, & Huenemoerder, 1996; Randich, Schmitt, & Prosser, 1996; Walter et al., 1994). Several K-band magnitudes were also obtained for us by J. Hare (1997, private communication). Where K-band magnitudes were unavailable, we used V-band magnitudes and published V-[12] colors (Cohen et al., 1987). A comparison of the results of these two extrapolation methods suggests the uncertainty in the predicted photospheric values is less than 10%, significantly less than the noise in our measurements.
Of our 36 detected sources, 33 show evidence of excess far-infrared emission. Basic characteristics of these excess sources including spectral type, V-band magnitude, B-V color, effective temperature, rotational velocity, distance, age and multiplicity are listed in Table 5.
About one-third of these sources are in young star forming regions and, based on IRAS results, were suspected to have infrared excesses. For the most part, only the 12 and 25 IRAS measurements are reliable and our new measurements at 60 and 100 complement these. Our ISO observations demonstrate for the first time that there is excess emission at 60 and 90 or 100 for thirteen cluster stars, five Young Field Stars and one other field star. These excess sources are presented in Tables 6 (CTTs and WTTs) and 7 (cluster and field stars) together with IRAS measurements and upper limits.
The detections of infrared excess are associated with stars of a range of spectral types and luminosities. For convenience we adopt a parameter that is independent of luminosity to describe systems exhibiting excess emission from circumstellar dust. The fractional excess luminosity, , where is the luminosity of dust and is the stellar bolometric luminosity, effectively provides a measure of the relative dust mass for small particles of radius a in systems with roughly the same dominant temperature. Values of for each of our excess sources were calculated following the method of Backman & Gillett (1987), summing the luminosities in each wavelength band and including a correction to account for excess flux from wavelengths longer than the 90 or 100 band: .
IRAS 12 and 25 measurements, where available, were used to determine and . However, for the vast majority of our targets older than Myr, there was either no measurable excess emission at 12 and 25 or no flux measurements available. Values for and were derived from the data in Tables 6 and 7. To account for any unmeasured excess emission at wavelengths shorter than 60 and longer than 100 , we used the values of and the 25, 60 and 100 measurements for 14 stars from Table X in Backman & Paresce (1993) and calculated the correction factor necessary to reproduce the final s from only the 60 and 100 excesses. This correction factor, , was then applied where we had only 60 and 90 or 100 data.
5 Discussion
5.1 Cluster Stars
We detected at least one infrared excess source in almost every cluster observed. Since the implications of the detections differ by cluster, we review each cluster separately.
Coma Berenices: Three IR-excess sources were detected out of 26 stars observed. While the actual number of detections is small, several characteristics of the cluster and the observations combine to make this a remarkable result. Coma Berenices is a very sparse cluster, comprised of only 42 optically identified members at the time of our observations, 35 of which are of spectral type earlier than K0. It is one of the oldest open clusters we observed, with an age of 500 Myr. Based on the drop off of with age described below in Section 5.3, Coma Berenices stars should have values of on average a factor of 100 less than stars in the Persei cluster. The fact that Coma Berenices at 88 pc is relatively close increases our sensitivity to excess flux there compared to Persei by a factor of only four. Furthermore, this cluster could be observed only early in ISO’s lifetime when we used the less-sensitive chopping mode with 3 noise limits at least four times higher than those of the raster observations. For the three Coma Berenices excess sources to be detectable, they must have values of 10 to 100 times higher than we would expect, indicating they are unusual systems. At least three other stars in the cluster display only slightly less than 3 signals on the center pixel, suggesting the presence of additional excess systems. Only very limited information on the members of Coma Berenices is available. Detailed photometric and spectroscopic observations and FIR data are nearly non-existent, although there are now Two Micron All Sky Survey (2MASS) observations.
Ursa Major: Our observations provide the first firm evidence for substantial excesses around stars in the Ursa Major cluster, which has an age Myr and lies at a distance pc. This cluster has two components: the nucleus and stream (Roman, 1949). Searches to date, generally involving only the A-type members (Abraham et al., 1998; Lecavelier Des Etangs, Ferlet, & Vidal-Madjar, 1997; Skrutskie et al., 1991), produced evidence for only one circumstellar disk – associated with UMa, a nucleus member – out of 30 separate nucleus and stream systems observed. One of our detected stars, HD 139798, was suggested as a 25 excess source by Stencel & Backman (1991), but its status as a possible Ursa Major stream member was not noted. All of our detected excess sources are probable members of the Ursa Major stream. However, all of our observations of the nucleus stars were made early in the ISO mission and used the chopping mode, with the lower sensitivity as mentioned above. Two nucleus stars exhibited emission at a level just less than our 3 limit indicating that more sensitive long wavelength observations may reveal additional excess systems.
Pleiades: Here we detected two very bright sources out of fourteen stars observed. While these two excess sources are intriguing they are not likely to be typical. Considering the relatively young age of the Pleiades, just over 100 Myr, we might expect a large number of sources with . However, for a G5 star, the median spectral type observed in this cluster, the lowest detectable was . With decreased sensitivity in many regions of this cluster due to high cirrus, it is not surprising we detected only the highest- disks. We note that, due to ISO’s pointing constraints, there was very limited time to observe the Pleiades resulting in a survey of only a tiny fraction of its members. The potential for detecting additional excess sources in this cluster is high.
Chamaeleon I and Upper Scorpius: Perhaps the least surprising of the detections are those of the PMS stars in the Chamaeleon I and Upper Scorpius associations. We were able to detect emission from 14 of 33 observed targets. While the vast majority (13) of the detected stars were known previously to be excess sources, most lacked reliable 60 and/or 100 fluxes, or were confused with other sources. Unfortunately, the resolution of ISO was insufficient to resolve three of the CTTs we observed. We detected excess in five of the WTTs we observed. All of the non-detected targets are WTTs, and are either highly variable (e.g. VX Cha) or are from the X-ray detected PMS sources (Alcala et al., 1995), many of which were determined to be older stars after our program of observations was executed. Comments on individual sources are in notes to Table 6. Of the two stars observed in Upper Scorpius, one resulted in a very strong detection, over 100 mJy in both the 60 and 90 bands. The similarity in appearance to the Chamaeleon sources suggests there are likely to be numerous excess sources in this cluster yet to be identified. In fact, Backman et al. (1998) reported a significant detection of the sum of emission from 6 A-type stars in the Sco-Cen association.
Persei: In contrast to the preceding clusters, the detection rate in this cluster was disappointing. With an estimated age Myr, Persei would be expected to contain systems with . Observations of this cluster are complicated by confusion with galactic plane sources as well as a greater distance of 185 pc. Nevertheless, an for an F5 star, the median observed spectral type of this cluster, would be well within our detection limits. However, recent dating of this cluster by lithium depletion boundary methods (Stauffer et al., 1999) yields an age of Myr, more than double the previous estimate. This would reduce our expected by a factor of four, putting the brighter cluster systems just at our detection limit. If Persei is as young as first thought, it would be one of the few clusters with ages just older than those of the WTTs, such as in Chamaeleon and Taurus, making it extremely important for characterizing circumstellar disks at this point in their evolution. More sensitive observations and a resolution of the age question are essential for this cluster.
Taurus: The lack of significant detections in Taurus is also surprising. With an average age of about 25 Myr and at 140 pc, Taurus is comparable to the Chamaeleon cluster, and thus would be expected to contain a large number of detectable excess sources. But time to observe this cluster was limited and thus statistics are poor. The targets observed were X-ray selected WTTs; however, unlike those in Chamaeleon, most Taurus WTTs are confirmed PMS stars (Bouvier et al., 1997).
Hyades: This cluster, one of the older clusters at 625 Myr, is relatively close at only 46 pc. This is about twice as far and twice as old as the Ursa Major cluster, where our detected s are on the order of . For the Hyades we expect to be on the order of , right at our detection limit for an F5 star, the median spectral type observed in the Hyades. Thus, typical disks could have escaped detection. Again, observing time on this cluster was limited and we observed only a small percentage of cluster members. More sensitive observations are necessary to determine the true incidence of infrared excess.
5.2 Young Field Stars
For most of these stars, ages were taken from the literature (see Table Dusty Debris Around Solar-Type Stars: Temporal Disk Evolution). In a few cases, ages were unavailable or unconfirmed. Chromospheric activity is a useful age-indicator for young, low-mass stars and can be measured by the brightness of the Ca-II core reversal. This reversal is often measured by the so-called S-parameter (Duncan, et al., 1991; Henry et al., 1996, and references therein). The S-parameters for two stars, HD 35850 and HD 209253 were measured with the 0.6-m Coude Auxiliary Telescope and the Hamilton Echelle Spectrograph at Lick Observatory by Silverstone (2000). These data were calibrated by measuring stars in common with Duncan, et al. (1991) and Henry et al. (1996). Ages (Table Dusty Debris Around Solar-Type Stars: Temporal Disk Evolution) were calculated following the method of Duncan, et al. (1991).
Among the Young Field Stars, we find detectable excesses in seven out of the nineteen stars observed. The values of for these excess stars are comparable to those of some members of the open clusters, but distances to these two samples are very different. On average, the Young Field Stars are at 45 pc, and have an age of 200 Myr, making them most analogous to the Ursa Major cluster, where there was also a significant number of detections. A greater percentage of Young Field Star observations than the Ursa Major observations used the high-sensitivity raster mode.
The S-parameter was also measured for the star HD 151044, an Ursa Major Stream candidate ( yrs) (Boesgaard et al., 1988). However its membership has been questioned on the basis of relatively low chromospheric emission and similar but not entirely consistent space motion with the Ursa Major Stream (Soderblom & Clements, 1987; Soderblom & Mayor, 1993). Our new chromospheric activity age, yrs, is consistent with HD 151044 being too old to be part of the Ursa Major Stream. However, the calculated excess seems extreme if the star is so old.
5.3 The Age– Correlation
As defined above, is the fractional dust luminosity, . For each cluster and for the Young Field Stars as a whole, an average was calculated as follows: the sum of all values for from detections and non-detections, including negative values, was divided by the total number of targets observed. Negative values for result when the observed flux was less than the photospheric flux estimate and in all the approximately 40 cases, the “negative excess” was less than the noise level. The Chamaeleon I sources were separated into two groups because of the wide relative age spread of the stars. The division was set at 10 Myr, resulting in groups of nearly equal size. However, whether Chamaeleon I is plotted as one group or two, the effect on the fitted age– relation is negligible.
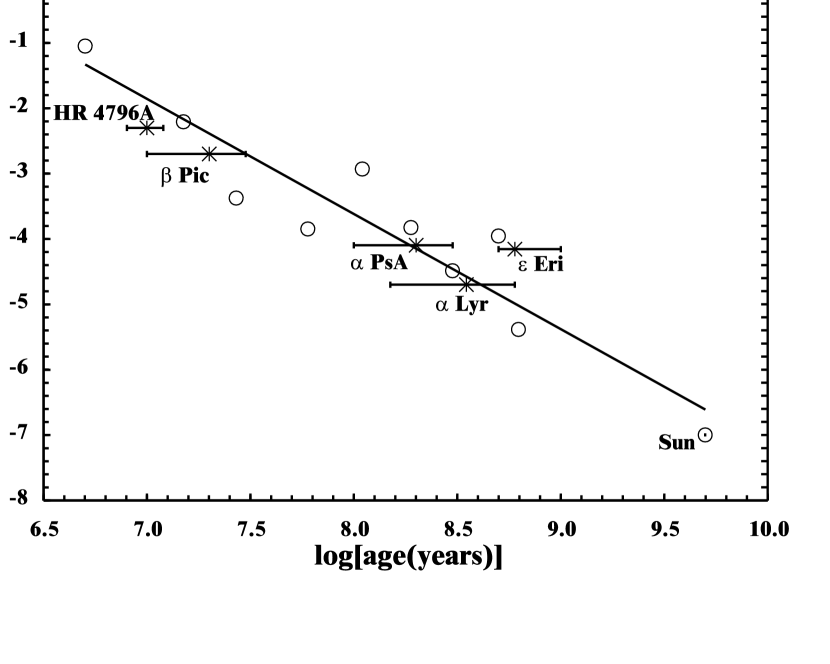
Figure 1 shows the averaged s versus the cluster ages. Comparable values for a few nearby Vega-type stars are plotted over the main cluster results in Figure 2. There is clear evidence for a systematic decrease in the fractional infrared excess emission with stellar age. A regression fit to the cluster data yields a reasonably good fit with a power-law of the form . This is consistent with submillimeter studies of Pleiades, Ursa Major, Taurus and field stars by Zuckerman & Becklin (1993), who found . In contrast, Habing et al. (2000) have recently proposed that the majority of circumstellar disks disappear after the first 400 Myr based on their detection of only a few disks around field stars with ages greater than 400 Myr. While it is difficult to compare the two sets of observations directly because of differing target samples and noise levels, we detect excess emission from dust around seven stars with ages greater than 400 Myr, showing disks do persist beyond 400 Myr though the amount of dust tends to decline.
Since is a measure of the emission from circumstellar dusk, it should be correlated with the mass of dust (see also Zuckerman & Becklin, 1993). Silverstone (2000) provides an approximate conversion relation, dust mass , where is the mass of the moon. Masses calculated in this way lead to the right-hand axis in Figure 1.
The power-law index near in the age-dust mass relationship can possibly be explained by a simple model of collisionally replenished secondary dust disks. If the dust clearing time scale is shorter than the age of the system, the amount of secondary dust will be determined by the instantaneous collisional rate of large particles. The typical dust clearing time scales are given by Backman & Paresce (1993) and Silverstone (2000) and are less than years. The collisional rate of large particles dN/dt should go as N2 where N is the number density of large planetesimals, comets or asteroids in the system. Thus
| (1) |
In addition, it is expected that the loss of large particles will be determined by the same collisional type process such that integrating equation 1 we find that the number of large particles will decrease with time as
| (2) |
Combining equations 1 and 2, we get that the mass of emitting dust is given by
| (3) |
This is similar to the observed power law fall off. The problem can also be reversed. The fact that we observe the mass of emitting dust dropping off as suggests that in this model, the number of large particles N, in planetesimals, comets and asteroids, falls as 1/t independent of the mechanism that produces the fall off.
5.4 Correlations with other stellar characteristics
With only a small number of detections in each cluster, it is difficult to draw general conclusions regarding the relationship between circumstellar material and stellar characteristics such as multiplicity and rotation. We detected dust around single stars, several spectroscopic binaries including all three Coma Berenices excess stars and one Young Field Star, HD 177996, and one wide binary, HD 125451 (separation AU). Therefore, over the age range of 10 to 600 Myr the presence of a stellar companion does not necessarily preclude the existence of associated circumstellar material. Osterloh & Beckwith (1995) and Jensen et al. (1996) show that disks may surround members of binary systems in cases where the separation is either less than 1 AU, or greater than 100 AU.
The detected sources exhibit a wide range of rotational velocities. In the young open clusters, half our detected excess sources have v sini less than the median rotational velocity of their parent clusters. This distribution is similar to the v sini distribution in the original sample of targets. In each cluster about half of the targets had v sini less than the median rotational velocity of the cluster. Only in the Pleiades is there a significant imbalance; there the two detected sources have the highest v sini of the stars we observed in that cluster, roughly five times the cluster median. Among the Young Field Stars, those detected have a range of rotational velocities similar to the young open clusters (including both slow rotators, and stars with rotational velocities similar to the two detected Pleiades stars). A dearth of comprehensive data for rotational velocities of the PMS stars in Scorpius and Chamaeleon I prevents detailed discussion for these samples.
Most of our detections in the young open clusters and Young Field Stars (i.e. not PMS stars) are stars of spectral type F. This is partly due to selection effects: we observed a large fraction of F-type stars and dust around F-type stars would be easier to detect because of the higher luminosity than G- or K-type stars. For F-type stars alone, we detect excess IR emission in 12 out of 48 stars observed, or 25%. In their review, Lagrange et al. (2000) state for stars of spectral types A–K the fraction with disks is 15%. While the fraction for F-type stars specifically is not noted, our results suggest the fraction is indeed significantly higher than 15%. Our results also indicate that future work is likely to confirm a similarly higher percentage for G- and K-type stars.
6 Summary
A survey of almost 150 pre-main sequence and young main sequence stars, the majority of which are members of young open clusters, has been carried out with ISOPHOT. Excess emission at 60, 90, and/or 100 , presumably from circumstellar debris disks, has been detected from 33 of the observed stars. The detections are distributed among the observed clusters/groups. Twenty of the stars, most of which are of spectral type F, were not previously known to exhibit excess emission, and represent a new set of Vega-type systems. Other ISO programs of observations with similar objectives to ours (Robberto et al., 1999; Habing et al., 2000) have resulted in much lower detection rates. Much of this can be attributed to greatly different observing strategies, including shorter integration times, method of measuring background, and choice of targets. Because of the differences in observational techniques, it is difficult to compare the results.
A major conclusion from our observations is how the excess IR emission evolves with time. The ratio of excess IR luminosity to stellar luminosity, , appears to drop off with age according to the power law . A power law is expected for collisionally replenished secondary dust disks. We do not see evidence for an abrupt cessation of the debris disk phenomenon as reported by Habing et al. (2000).
The detection of the new IR excess sources reported here is only the beginning. More work needs to be done to help characterize the spectral and spatial extent of systems which have been detected. We have no 100 measurements for any of the young cluster stars which we observed in the chopping mode. Many of the PMS objects we measured at 100 are not well characterized spatially. We expect that the DEep Near Infrared Survey of the Southern Sky (DENIS) and 2MASS searches will add near-IR data to many of the young cluster sources, but may not be able to measure some of the more distant stars. Observations of our new excess sources are also needed in the 10 – 60 region. However, the far infrared wavelengths at which dust disks are most readily studied are inaccessible from the ground, requiring future high-altitude and space missions, such as SOFIA and SIRTF. Finally, the multiplicity of a number of these sources, both young cluster and PMS, needs to be better established.
Our results indicate that there is great potential for more sensitive space-based studies of clusters to identify additional solar-type stars with far-infrared excess. The detection and analysis of many more of these intriguing objects will provide a better understanding of the planet formation process.
Appendix A Flux Calibration
As discussed by Spangler et al. (1999) and Silverstone (2000), a number of targets from our entire ISO:DEBRIS program had existing IRAS Faint Source Catalogue (FSC) measurements at 60 that were confirmed to be stellar in origin. We made use of these data to check the PIA/FCS calibration of our ISOPHOT fluxes. The comparison of 24 sources is plotted in Figure A1 along with the line for reference, and shows good agreement between the IRAS FSC and ISO FCS flux measurements.
References
- Abraham et al. (1998) Abraham, P., Leinert, C., Burkert, A., Lemke, D., & Henning, T. 1998, A&A, 338, 91
- Alcala et al. (1995) Alcala, J. M., Krautter, J., Schmitt, J. H. M. M., Covino, E., Wichmann, R., Mundt, R. 1995, A&AS, 114, 109
- Alcala et al. (1997) Alcala, J. M., Krautter, J., Covino, E., Neuhauser, R., Schmitt, J. H. M. M., & Wichmann, R. 1997, A&A, 319, 184
- Andre et al. (2000) Andre, P., Ward-Thompson, D., & Barsony, M. 2000, in Protostars and Planets IV, ed. V. Mannings, A. P. Boss, & S. S. Russell (Tucson: University of Arizona Press), 59
- Augereau et al. (1999) Augereau, J. C., Langrange, A. M., Mouillet, D., & Menard, F. 1999, A&A, 350, 51L
- Aumann et al. (1984) Aumann, H. H. et al. 1984, ApJ, 278, 23
- Backman et al. (1998) Backman, D. E., Fajardo-Acosta, S. B., Stencel, R. E., & Stauffer, J. R. 1998, Ap&SS, 255, 91
- Backman & Gillett (1987) Backman, D. E., & Gillett, F. C., 1987, in LNP 291, Cool Stars, Stellar Systems and the Sun, ed. J. L. Linsky & R. E. Stencel (Berlin: Springer-Verlag), 340
- Backman & Paresce (1993) Backman, D. E., & Paresce, F. 1993, in Protostars and Planets III, eds. E. H. Levy & J. I. Lunine (Tucson: University of Arizona Press), 1253
- Barrado y Navascues et al. (1999) Barrado y Navascues, D., Stauffer, J. R., Song, I., & Caillault, J.-P. 1999, ApJ, 520, 123
- Boesgaard (1987) Boesgaard, A. M. 1987, ApJ, 321, 967
- Boesgaard et al. (1988) Boesgaard, A. M., Budge, K. G., & Burck, E. E. 1988, ApJ, 325, 749
- Bounatiro (1993) Bounatiro, L. 1993, A&ASS, 100, 531
- Bouvier et al. (1997) Bouvier, J. et al. 1997, A&A, 318, 495
- Calvet, Hartman, & Strom (2000) Calvet, N., Hartmann, L., & Strom, S. E. 2000, in Protostars and Planets IV, ed. V. Mannings, A. P. Boss, & S. S. Russell (Tucson: University of Arizona Press), 377
- Cambresy et al. (1998) Cambresy, L., Copet, E., Epchtein, H., De Batz, B., Borsenberger, J., Fouque, P., Kimeswenger, S., & Tiphene, D. 1998, A&A, 338, 977
- Cohen et al. (1987) Cohen, M., Schwartz, D. E., Chokshi, A., & Walker, R. G. 1987, AJ, 93, 1199
- Covino et al. (1997) Covino, E., Alcala, J. M., Allain, S., Bouvier, J., Terranegra, L., & Krautter, J. 1997, A&A, 328, 187
- Duncan, et al. (1991) Duncan, D. K. et al. 1991, ApJS, 76, 383
- Eggen (1973) Eggen, O. 1973, PASP, 85, 381
- Favata et al. (1993) Favata, F., Barbera, M., Micela, G., & Sciortino, S. 1993, A&A, 277, 428
- Feigelson et al. (1993) Feigelson, E. D., Casanova, S., Montmerle, T., & Guibert, J. 1993, ApJ, 416, 623
- Gabriel et al. (1997) Gabriel, C., Acosta-Pulido, J., Heinrichsen, I., Morris, H., & Tai, W.-M. 1997, in ASP Conf. Ser. 125, Astronomical Data Analysis Software and Systems VI, ed. G. Hunt & H. E. Payne (San Francisco: BookCrafters, Inc.), 6, 108
- Gauvin & Strom (1992) Gauvin, L. S., & Strom, K. M. 1992, ApJ, 385, 217
- Greaves et al. (1998) Greaves, J. S. et al. 1998, ApJ, 506, 133
- Griffin (1992) Griffin, R. F. 1992, The Observatory, 112, 41
- Habing et al. (2000) Habing, H. J. et al. 2000, A&A, in press
- Hartigan (1993) Hartigan, P. 1993, AJ, 105, 1511
- Heckmann et al. (1956) Heckmann, O., Dieckvoss, W., & Kox, H. 1956, Astr. Nach., 283, 109
- Henning et al. (1993) Henning, Th., Pfau, W., Zinnecker, H., & Prusti, T. 1993, A&A, 276, 129
- Henry et al. (1995) Henry, G. W., Fekel, F. C., & Hall, D. S. 1995, AJ, 110, 2926
- Henry et al. (1996) Henry, T. J., Soderblom, D. R., Donahue, R. A., & Baliunas, S. L. 1996, AJ, 111, 439
- Hertzprung (1947) Hertzprung, E. 1947, Ann. Leiden Obs., Vol. 19, No. 1A
- Holland et al. (1998) Holland, W. S. et al. 1998, Nature, 392, 788
- Jayawardhana et al. (1998) Jayawardhana, R., Fisher, S., Hartmann, L., Telesco, C., Pina, R., & Fazio, G. 1998, ApJ, 503, 79.
- Jeffries (1995) Jeffries, R. D. 1995, MNRAS, 273, 559
- Jensen et al. (1996) Jensen, E. L. N., Mathieu, R. D., & Fuller, G. A. ApJ, 458, 312
- Jura et al. (1998) Jura, M., Malkan, M., White, R., Telesco, C., Pina, R., & Fischer, R. S. 1998, ApJ, 505, 897
- Kenyon et al. (1994) Kenyon, S. J., Dobrzycka, D., & Hartmann, L. 1994, AJ, 108, 1872
- Koerner et al. (1998) Koerner, D. W., Ressler, M. E., Werner, M. W., & Backman, D. E. 1998, ApJ, 503, 83
- Lagrange et al. (2000) Lagrange, A.-M., Backman, D. E., & Artymowicz, P. 2000, in Protostars and Planets IV, ed. V. Mannings, A. P. Boss, & S. S. Russell (Tucson: University of Arizona Press), 639
- Laureijs (1999) Laureijs, R. J. 29 June 1999, Point Spread Function Fractions Related to the ISOPhot C100 and C200 Arrays Version 1.0
- Lawson et al. (1996) Lawson, F. A., Feigelson, E. D., & Huenemoerder, D. P. 1996, MNRAS, 280, 1071
- Lecavelier Des Etangs et al. (1997) Lecavelier Des Etangs, A., Ferlet, R., & Vidal-Madjar, A. 1997, A&A, 328, 602
- Lemke et al. (1996) Lemke, D. et al. 1996, A&A, 315, L64
- Marcy et al. (2000) Marcy, G. W., Cochran, W. D., & Mayor, M. 2000, in Protostars and Planets IV, ed. V. Mannings, A. P. Boss, & S. S. Russell (Tucson: University of Arizona Press), 1285
- Mannings et al. (1997) Mannings, V., Koerner, D. W., & Sargent, A. I. 1997, Nature, 388, 555
- Mantegazza et al. (1992) Mantegazza, L., Poretti, E., Antonello, E., & Bossi, M. 1992, A&A, 256, 459
- Meynet et al. (1993) Meynet, G., Mermilliod, J.-C., & Maeder, A. 1993, A&AS, 98, 523
- Mundy et al. (2000) Mundy, L. G., Looney, L. W., & Welch, W. J. 2000, in Protostars and Planets IV, ed. V. Mannings, A. P. Boss, & S. S. Russell (Tucson: University of Arizona Press), p. 355
- Natta et al. (2000) Natta, A., Grinin, V. P., & Mannings, V. 2000, in Protostars and Planets IV, ed. V. Mannings, A. P. Boss, & S. S. Russell (Tucson: University of Arizona Press), p. 559
- Odenkirchen et al. (1998) Odenkirchen, M., Soubiran, C., & Colin, J. 1998, NewA, 3, 583
- Osterloh & Beckwith (1995) Osterloh, M., & Beckwith, S. V. W. 1995, ApJ, 439, 288
- Perryman et al. (1998) Perryman, M. A. et al. 1998, A&A, 331, 81
- Preibisch & Zinnecker (1999) Preibisch, T., & Zinnecker, H. 1999, AJ, 117, 2381
- Prosser (1992) Prosser, C. F. 1992, AJ, 103, 488
- Prusti et al. (1992) Prusti, T., Whittet, D. C. B., & Wesselius, P. R. 1992, MNRAS, 254, 361
- Randich et al. (1996) Randich, S., Schmitt, J. H. M. M., & Prosser, C. 1996, A&A, 313, 815
- Robberto et al. (1999) Robberto, M., Meyer, M. R., Natta, A., & Beckwith, S. V. W. 1999, in ASP Conf. Ser. 427, The Universe as Seen by ISO, eds. P. Cox & M. F. Kessler, 195
- Robichon et al. (1999) Robichon, N., Arenou, F., Mermilliod, J.-C., & Turon, C. 1999, A&A, 345, 471
- Roman (1949) Roman, N. ApJ, 110, 205
- Sargent (1996) Sargent, A. I. 1996, IAUS, 170, 151
- Schneider et al. (1999) Schneider, G. et al. 1999, ApJ, 513, 127
- Schwan (1991) Schwan, H. 1991, A&A, 243, 386
- Skrutskie et al. (1991) Skrutskie, M. F., Snell, R., Dutkevitch, D., Strom, S. E., Schloerb, F. P., & Dickman, R. L. 1991, AJ, 102, 1749
- Shu et al. (1993) Shu, F., Najita, J., Galli, D., Ostriker, E., & Lizano, S. 1993, in Protostars & Planets III, eds. E. H. Levy & J. I. Lunine (Tucson: University of Arizona Press), 3
- Silverstone (2000) Silverstone, M. 2000, Ph.D. thesis, UCLA
- Silverstone et al. (1998) Silverstone, M., Becklin, E. E., & Spangler C. 1998, Ap&SS, 255, 119
- Smith & Terrile (1984) Smith, B. A., & Terrile, R. J. 1984, Science, 226, 1421
- Soderblom & Clements (1987) Soderblom, D. R., & Clements, S. D. 1987, AJ, 93, 920
- Soderblom & Dappen (1989) Soderblom, D. R., & Dappen, W. 1989, ApJ, 342, 945
- Soderblom et al. (1993a) Soderblom, D. R., Jones, B. F., Balachandran, S., Stauffer, J. R., Duncan, D. K., Fedele, S. B., & Hudon, J. D. 1993a, AJ, 106, 1059
- Soderblom & Mayor (1993) Soderblom, D. R., & Mayor, M. 1993, AJ, 105, 226
- Soderblom et al. (1993b) Soderblom, D. R., Pilachowski, C. A., Fedele, S. B., & Jones, B. F. 1993b, AJ, 105, 2299
- Soderblom et al. (1998) Soderblom, D. R., King, J. R., & Henry, T. J. 1998, AJ, 116, 396
- Spangler et al. (1999) Spangler, C., Silverstone, M. D., Becklin, E. E., Hare, J., Zuckerman, B., Sargent, A., & Goldreich, P. 1999, in ASP Conf. Ser. 427, The Universe as Seen by ISO, eds. P. Cox & M. F. Kessler, 405
- Stauffer et al. (1999) Stauffer, J. R. et al. 1999, ApJ, 527, 219
- Stauffer et al. (1985) Stauffer, J. R., Hartmann, L. W., & Burnham, J. N. 1985, ApJ, 289, 247
- Stencel & Backman (1991) Stencel, R. E., & Backman, D. E. 1991, ApJS, 75, 905
- Walter (1992) Walter, F. M. 1992, AJ, 104, 758
- Walter et al. (1994) Walter, F. M., Vrba, F. J., Mathieu, R. D., Brown, A., & Myers, P. C. 1994, AJ, 107, 692
- Weaver & Jones (1992) Weaver, Wm. B., & Jones, G. 1992, ApJ, 78, 239
- Weinberger et al. (1999) Weinberger, A. J., Becklin, E. E., Schneider, G., Smith, B. A., Lowrance, P. J., Silverstone, M. D., Zuckerman, B., & Terrile, R. J. 1999, ApJ, 525, 53
- Wichmann et al. (1996) Wichmann, R. et al. 1996, A&A, 312, 439
- Wilner & Lay (2000) Wilner, D. J., & Lay, O. P. 2000, in Protostars and Planets IV, ed. V. Mannings, A. P. Boss, & S. S. Russell (Tucson: University of Arizona Press), 509
- Zuckerman & Becklin (1993) Zuckerman, B., & Becklin, E. E. 1993, ApJ, 414, 793


| Cluster | Age | ref | Distance | ref | Number of | Observation | Integration Time |
|---|---|---|---|---|---|---|---|
| Name | Targets | Mode | |||||
| (Myr) | (pc) | (s) | |||||
| Upper Scorpius | 1 – 10 | 1 | 145 | 1 | 2 | raster | 53 / raster pt., 473 total |
| Chamaeleon I a | 1 – 20 | 2 | 140 | 3 | 18 | chopped | 128 on-target, 128 off-target |
| Chamaeleon I b | 3 – 40 | 4 | 150 | 4 | 11 | raster | 40 / raster pt., 346 total |
| 2 | raster | 53 / raster pt., 473 total | |||||
| Taurus | 10 – 40 | 5 | 140 | 6 | 8 | raster | 53 / raster pt., 473 total |
| Persei | 50 | 7 | 185 | 8 | 6 | raster | 40 / raster pt., 346 total |
| 13 | raster | 53 / raster pt., 473 total | |||||
| Pleiades | 120 | 7 | 118 | 8 | 14 | raster | 53 / raster pt., 473 total |
| Ursa Major | 300 | 9 | 10 – 40 | 10 | 13 | chopped | 128 on-target, 128 off-target |
| 6 | raster | 53 / raster pt., 473 total | |||||
| Coma Berenices | 500 | 11 | 88 | 11 | 18 | chopped | 128 on-target, 128 off-target |
| 8 | staring | 128 on-target, 128 off-target | |||||
| Hyades | 625 | 12 | 46 | 12 | 9 | raster | 53 / raster pt., 473 total |
| Young Field | 60 – 630 | 13 | 25 – 125 | 10 | 6 | chopped | 128 on-target, 128 off-target, 60 |
| Stars | 64 on-target, 64 off-target, 100 | ||||||
| 13 | raster | 46 / raster pt., 410 total |
References. — (1) Preibisch & Zinnecker (1999), (2) Lawson et al. (1996), (3) Feigelson et al. (1993), (4) Alcala et al. (1997), (5) Bouvier et al. (1997), (6) Kenyon, Dobrzycka, & Hartmann (1994), (7) Meynet, Mermilliod, & Maeder (1993), (8) Robichon et al. (1999), (9) Eggen (1973), (10) HIPPARCOS, (11) Odenkirchen, Soubiran, & Colin (1998), (12) Perryman et al. (1998), (13) see Table Dusty Debris Around Solar-Type Stars: Temporal Disk Evolution
| Object | Age | Ref | Object | Age | Ref |
|---|---|---|---|---|---|
| (Myr) | (Myr) | ||||
| HD 105 | 500 | 1 | HD 160934 | ||
| HD 1405 | 60 | 2 | HD 171488 | 80 | 6 |
| HD 16884 | 800 | 3 | HD 175897 | 100 | 1 |
| HD 35850 | 230 | 4 | HD 177996 | 300 | 1 |
| HD 36705 | HD 180445 | 160 | 1 | ||
| HD 37484 | 80 | 3 | HD 197890 | 300 | 7 |
| HD 54579 | 160 | 1 | HD 202917 | 180 | 1 |
| HD 119022 | 160 | 1 | HD 209253 | 400 | 4 |
| HD 129333 | 300 | 5 | HD 220140 | 60 | 8 |
| HD 134319 | 500 | 5 |
| Target | Spectral | 60 | RMS | 100 | RMS | Target | Spectral | 60 | RMS | 100 | RMS |
|---|---|---|---|---|---|---|---|---|---|---|---|
| Name | Type | (Jy) | Jy | (Jy) | (Jy) | Name | Type | (Jy) | Jy | (Jy) | (Jy) |
| CHAMAELEON I | |||||||||||
| Sz 4 | CTTS | 0.219 | 0.038 | 0.210 | 0.060 | Glass Ia | WTTS | 12.970 | 0.236 | 7.216 | 0.445 |
| SZ Cha | CTTS | 3.545 | 0.177 | 2.546 | 0.400 | HM 19 | CTTS | -0.193 | 2.360 | -0.572 | 3.176 |
| TW Cha | CTTS | 0.528 | 0.078 | 0.267 | 0.074 | VX Cha | WTTS | 0.030 | 0.063 | -0.155 | 0.193 |
| HM 5 | WTTS | 0.020 | 0.055 | 0.080 | 0.156 | WX Cha | CTTS | 0.232 | 0.045 | 0.192 | 0.134 |
| CED 110 | WTTS | 7.943 | 0.128 | 17.995 | 8.806 | GK-1 | CTTS | 0.566 | 2.244 | 2.001 | 5.104 |
| UX Cha | WTTS | 0.024 | 0.023 | 0.083 | 0.091 | WY Cha | CTTS | 0.303 | 0.165 | 0.832 | 0.548 |
| UZ Cha | WTTS | 0.268 | 0.081 | 0.229 | 0.093 | CHX 18 | WTTS | 0.530 | 0.085 | 0.372 | 0.118 |
| Lk Ha 332-17 | CTTS | 6.715 | 1.460 | 8.338 | 5.474 | HM 32 | CTTS | 0.462 | 0.029 | 0.353 | 0.077 |
| Sz 23 | WTTS | 0.575 | 3.033 | 0.183 | 6.940 | HM Anon | WTTS | 0.831 | 0.104 | 0.793 | 0.269 |
| URSA MAJOR | |||||||||||
| HD 109011 | K2 V | 0.019 | 0.095 | -0.037 | 0.064 | HD 124674 | F1 V | 0.050 | 0.069 | -0.101 | 0.100 |
| HD 109647 | K0 | 0.052 | 0.066 | 0.089 | 0.032 | HD 125451 | F5 IV | 0.171 | 0.018 | 0.004 | 0.045 |
| HD 110463 | K3 V | 0.059 | 0.111 | -0.047 | 0.024 | HD 139798 | F2 V | 0.067 | 0.022 | 0.007 | 0.049 |
| HD 111456 | F5 V | 0.069 | 0.040 | 0.038 | 0.070 | HD 141003 | K3 V | 0.502 | 0.326 | 0.208 | 0.212 |
| HD 113139 | F2 V | 0.025 | 0.044 | 0.016 | 0.037 | HD 147584 | G0 V | 0.099 | 0.072 | 0.128 | 0.103 |
| HD 115043 | G2 V | 0.054 | 0.023 | 0.024 | 0.025 | HD 180777 | A9 V | 0.014 | 0.053 | 0.061 | 0.080 |
| HD 116656 | A2 V | 0.171 | 0.022 | 0.016 | 0.022 | ||||||
| COMA BERENICES | |||||||||||
| HD 105805 | A3 V | 0.034 | 0.045 | 0.011 | 0.019 | HD 107793aaStaring Chain observation | F8 V | 0.011 | 0.018 | -0.007 | 0.008 |
| HD 106103 | F5 V | 0.005 | 0.041 | 0.003 | 0.008 | HD 107887aaStaring Chain observation | F5 V | -0.009 | 0.033 | 0.010 | 0.046 |
| HD 106691 | F3 V | 0.091 | 0.091 | 0.022 | 0.029 | SAO 82286aaStaring Chain observation | G1 V | 0.027 | 0.023 | 0.008 | 0.014 |
| HD 106946 | F2 V | 0.061 | 0.052 | -0.040 | 0.027 | HD 107935aaStaring Chain observation | A7 V | 0.085 | 0.063 | 0.050 | 0.052 |
| HD 107067 | F9 V | 0.170 | 0.072 | 0.019 | 0.061 | BD+26 2342 | K0 V | 0.004 | 0.031 | 0.001 | 0.032 |
| HD 107132 | F7 V | 0.031 | 0.042 | -0.001 | 0.027 | HD 108102 | F8 V | 0.150 | 0.036 | 0.031 | 0.033 |
| HD 107131 | A7 V | 0.044 | 0.023 | 0.006 | 0.018 | HD 108154 | F8 V | 0.051 | 0.038 | -0.014 | 0.015 |
| HD 107214 | G0 V | 0.105 | 0.055 | -0.030 | 0.026 | HD 108226aaStaring Chain observation | F6 V | 0.086 | 0.048 | -0.007 | 0.056 |
| HD 107399 | G0 V | 0.023 | 0.049 | 0.023 | 0.015 | Tr 132bbReplace “Tr” with “Cl Melotte 111” to find in SIMBAD | G5 V | -0.048 | 0.035 | 0.063 | 0.034 |
| HD 107583aaStaring Chain observation | G1 V | 0.061 | 0.078 | 0.000 | 0.018 | HD 108651 | A0 | 0.177 | 0.055 | 0.022 | 0.041 |
| HD 107611aaStaring Chain observation | F6 V | -0.009 | 0.031 | 0.013 | 0.039 | SAO 82335 | G9 V | -0.089 | 0.048 | 0.005 | 0.022 |
| HD 107685 | F5 V | 0.100 | 0.045 | 0.006 | 0.012 | HD 108967 | F6 V | 0.051 | 0.038 | 0.042 | 0.019 |
| HD 107700aaStaring Chain observation | A2 V | 0.067 | 0.014 | 0.025 | 0.029 | HD 109307 | A4 V | 0.027 | 0.034 | 0.009 | 0.044 |
| + G7 III | |||||||||||
| YOUNG FIELD STARS | |||||||||||
| HD 16884 | K5 V | 0.137 | 0.070 | 0.002 | 0.046 | HD 129333 | F8 | 0.018 | 0.026 | -0.020 | 0.043 |
| HD 36705 | K1 IIIp. | 0.008 | 0.045 | 0.051 | 0.029 | HD 160934 | K7 | -0.014 | 0.025 | -0.004 | 0.031 |
| HD 119022 | G2 IV/V | 0.047 | 0.056 | 0.125 | 0.091 | HD 175897 | G0 V | 0.043 | 0.054 | -0.041 | 0.031 |
Note. — Spectral type information from SIMBAD.
| Target | Spectral | 60 | RMS | 90 | RMS | Target | Spectral | 60 | RMS | 90 | RMS |
|---|---|---|---|---|---|---|---|---|---|---|---|
| Name | Type | (Jy) | Jy | (Jy) | (Jy) | Name | Type | (Jy) | Jy | (Jy) | (Jy) |
| UPPER SCORPIUS | |||||||||||
| ScoPMS 60 | WTTS | 0.003 | 0.008 | 0.002 | 0.011 | ScoPMS 214 | WTTS | 0.116 | 0.008 | 0.129 | 0.034 |
| CHAMAELEON I | |||||||||||
| RX J0850.1-7554 | WTTS | -0.002 | 0.021 | 0.020 | 0.006 | RX J1035.8-7859 | WTTS | 0.013 | 0.036 | 0.003 | 0.011 |
| RX J0853.1-8244 | WTTS | 0.026 | 0.019 | 0.000 | 0.007 | RX J1048.9-7765 | WTTS | -0.029 | 0.030 | 0.007 | 0.011 |
| RX J0917.2-7744 | WTTS | 0.005 | 0.019 | 0.008 | 0.012 | RX J1125.8-8456 | WTTS | 0.019 | 0.011 | -0.001 | 0.005 |
| RX J0928.5-7815 | WTTS | 0.003 | 0.034 | 0.002 | 0.012 | RX J1203.7-8129 | WTTS | -0.006 | 0.019 | -0.002 | 0.008 |
| RX J0952.7-7933 | WTTS | 0.005 | 0.022 | 0.003 | 0.009 | RX J1225.3-7857 | WTTS | 0.004 | 0.009 | -0.003 | 0.009 |
| RX J1007.7-8504 | WTTS | 0.001 | 0.019 | -0.007 | 0.007 | RX J1325.7-7955 | WTTS | -0.017 | 0.014 | 0.010 | 0.014 |
| RX J1009.6-8105 | WTTS | 0.002 | 0.018 | -0.004 | 0.009 | ||||||
| TAURUS | |||||||||||
| RX J0408.2+1956 | WTTS | 0.000 | 0.009 | 0.009 | 0.009 | RX J0420.4+3123 | WTTS | 0.012 | 0.040 | 0.006 | 0.016 |
| RX J0409.2+2901 | WTTS | 0.011 | 0.032 | -0.005 | 0.021 | RX J0423.7+1537 | WTTS | 0.029 | 0.026 | 0.006 | 0.018 |
| RX J0412.8+2442 | WTTS | -0.010 | 0.013 | 0.011 | 0.015 | RX J0431.3+2150 | WTTS | -0.013 | 0.021 | -0.003 | 0.015 |
| RX J0415.3+2044 | WTTS | 0.010 | 0.014 | -0.010 | 0.019 | RX J0457.0+1517 | WTTS | -0.002 | 0.015 | 0.016 | 0.009 |
| PERSEIaanames from: HE = Heckmann, Dieckvoss, & Kox (1956), AP = Stauffer, Hartmann, & Burnham (1985); to find in SIMBAD, replace “HE” with “Cl Melotte 20” and prepend “Cl* Melotte 20” to AP | |||||||||||
| HE 061 | F0 | -0.005 | 0.017 | -0.003 | 0.015 | HE 660 | F4 V | -0.007 | 0.018 | -0.018 | 0.017 |
| HE 143 | F8 IV-V | 0.025 | 0.017 | 0.006 | 0.012 | HE 715 | F5 V | 0.003 | 0.013 | 0.007 | 0.011 |
| HE 299 | F6 V | 0.014 | 0.016 | 0.011 | 0.014 | HE 733 | F6 V | 0.009 | 0.019 | 0.012 | 0.018 |
| HE 361 | F4 V | 0.036 | 0.010 | 0.017 | 0.033 | HE 750 | F9 V | -0.009 | 0.020 | -0.005 | 0.014 |
| HE 387 | F2 V | 0.005 | 0.009 | 0.009 | 0.006 | AP 166 | G0 | 0.003 | 0.012 | -0.004 | 0.014 |
| HE 421 | F2 V | 0.015 | 0.008 | 0.005 | 0.007 | HE 794 | F6 V | -0.007 | 0.025 | 0.002 | 0.012 |
| HE 490 | F4 V | -0.012 | 0.012 | -0.017 | 0.015 | HE 1101 | G4 | -0.006 | 0.021 | -0.006 | 0.015 |
| AP 14 | G4 | 0.001 | 0.017 | 0.013 | 0.013 | HE 1160 | F7 | 0.015 | 0.018 | 0.004 | 0.017 |
| HE 621 | F4 V | -0.002 | 0.016 | 0.019 | 0.017 | HE 1181 | G2 | -0.012 | 0.017 | 0.005 | 0.009 |
| HE 635 | A9 V | 0.004 | 0.012 | 0.005 | 0.011 | ||||||
| PLEIADESbbnames from Hertzprung (1947); to find in SIMBAD, replace “HII” with “Cl Melotte 22” | |||||||||||
| HII 1132 | F5 V | 0.028 | 0.010 | 0.026 | 0.010 | HII 2341 | G4 V | 0.006 | 0.027 | -0.003 | 0.009 |
| HII 1182 | G5 V | -0.011 | 0.011 | -0.006 | 0.005 | HII 2462 | 0.008 | 0.023 | 0.002 | 0.021 | |
| HII 1220 | G8 V | 0.013 | 0.018 | -0.007 | 0.014 | HII 2506 | F8 V | 0.002 | 0.018 | 0.006 | 0.010 |
| HII 1593 | G6 V | 0.015 | 0.015 | 0.001 | 0.015 | HII 2786 | G0 | 0.006 | 0.018 | -0.010 | 0.018 |
| HII 1924 | G0 V | -0.011 | 0.019 | 0.000 | 0.015 | HII 3163 | K2 | 0.009 | 0.023 | 0.038 | 0.011 |
| HII 2284 | -0.013 | 0.016 | 0.003 | 0.022 | HII 3179 | G0 V | 0.019 | 0.031 | 0.012 | 0.005 | |
| HII 2311 | -0.013 | 0.021 | -0.006 | 0.024 | HII 3197 | K3 V | -0.024 | 0.023 | 0.010 | 0.013 | |
| URSA MAJOR | |||||||||||
| HD 11131 | G0 V | 0.005 | 0.004 | 0.006 | 0.005 | HD 72905 | G1 V | 0.077 | 0.014 | 0.053 | 0.012 |
| HD 13594 | F5 V | 0.000 | 0.004 | 0.009 | 0.009 | HD 165185 | G5 V | 0.004 | 0.004 | 0.005 | 0.011 |
| HD 13959 | K4 V | 0.011 | 0.007 | -0.002 | 0.007 | HD 184960 | F7 V | 0.050 | 0.016 | 0.046 | 0.012 |
| HYADES | |||||||||||
| HD 27429 | F3 V | 0.001 | 0.017 | -0.007 | 0.024 | HD 28344 | G2 V | 0.016 | 0.026 | 0.007 | 0.018 |
| HD 27459 | F0 V | 0.050 | 0.013 | -0.004 | 0.012 | HD 28677 | F4 V | -0.001 | 0.018 | 0.002 | 0.016 |
| HD 27561 | F5 V | 0.007 | 0.016 | 0.017 | 0.022 | HD 28992 | G1 V | -0.006 | 0.018 | 0.008 | 0.022 |
| HD 27848 | F6 V | 0.018 | 0.025 | 0.012 | 0.016 | HD 29225 | F5 V | 0.009 | 0.022 | -0.009 | 0.016 |
| HD 28205 | F8 V | -0.012 | 0.015 | -0.003 | 0.005 | ||||||
| OTHER | |||||||||||
| HD 151044 | F8 V | 0.088 | 0.0163 | 0.103 | 0.022 | ||||||
| YOUNG FIELD STARS | |||||||||||
| HD 105 | G0 V | 0.143 | 0.026 | 0.167 | 0.008 | HD 177996 | K1 V | 0.019 | 0.024 | 0.042 | 0.017 |
| HD 1405 | G5 | -0.025 | 0.016 | -0.009 | 0.009 | HD 180445 | G8 V | 0.032 | 0.018 | 0.008 | 0.012 |
| HD 35850 | F7 V | 0.049 | 0.014 | 0.050 | 0.012 | HD 197890 | K0 V | 0.002 | 0.021 | 0.006 | 0.009 |
| HD 37484 | F3 V | 0.115 | 0.022 | 0.084 | 0.011 | HD 202917 | G5 V | 0.050 | 0.020 | 0.038 | 0.015 |
| HD 54579 | G0 V | 0.000 | 0.024 | -0.003 | 0.020 | HD 209253 | F6/F7 V | 0.127 | 0.021 | 0.107 | 0.015 |
| HD 134139 | G5 | 0.048 | 0.019 | 0.012 | 0.011 | HD 220140 | G9 V | -0.001 | 0.011 | -0.006 | 0.013 |
| HD 171488 | G0 V | 0.032 | 0.024 | 0.017 | 0.018 | ||||||
Note. — Spectral type information from SIMBAD.
| Target | SpT | mv | B-V | v sini | Distance | Age | Multiplicity |
|---|---|---|---|---|---|---|---|
| (km s-1) | (pc) | (Myr) | |||||
| UPPER SCORPIUS | |||||||
| ScoPMS 214 | K0 IV | 11.2 | 1.24 | 90 | 160 | 2 | |
| CHAMAELEON I: detections | |||||||
| Sz 4 | CTTS | 140 | |||||
| SZ Cha | CTTS | 11.7 | 1.58 | 140 | 8 | Trinary; sep. and | |
| TW Cha | CTTS | 13.3 | 2.02 | 140 | 20 | ||
| CED 110 | WTTS | 11.3 | 1.41 | 75 | 140 | 5 | |
| UZ Cha | WTTS | 14.9 | 1.72 | 140 | |||
| Lk H 332-17 | CTTS | 10.7 | 1.20 | 30 | 140 | 4 | Binary; sep. |
| Glass Ia | WTTS | 12.8 | 1.47 | 140 | 3 | Glass Ib; sep. | |
| WX Cha | CTTS | 14.8 | 1.69 | 140 | 5 | Binary; sep. | |
| WY Cha | CTTS | 14.0 | 1.57 | 140 | 4 | ||
| XX Cha | WTTS | 15.3 | 1.53 | 140 | 40 | ||
| CHX 18N | WTTS | 12.1 | 1.31 | 25 | 140 | 8 | |
| HM Anon | WTTS | 11.1 | 1.15 | 140 | 10 | Binary; sep. | |
| HM 32 | CTTS | 13.5 | 1.44 | 140 | 5 | ||
| RX J0850.1-7554 | WTTS | 10.6 | 0.74 | 45 | 170? | 16 | |
| CHAMAELEON I: non-detected or contaminated stars | |||||||
| HM 5 | WTTS | 140 | |||||
| UX Cha | WTTS | 140 | |||||
| Sz 23 | WTTS | 140 | One of at least 3 companions | ||||
| to VW Cha; sep. | |||||||
| HM 19 | CTTS | 140 | |||||
| VX Cha | WTTS | 140 | |||||
| GK-1 | CTTS | 140 | |||||
| PERSEI | |||||||
| HE 361 | F4 V | 9.7 | 0.43 | 30 | 184.2 | 65 | |
| PLEIADES | |||||||
| HII 1132 | F5 V | 9.4 | 0.45 | 40 | 120 | 120 | |
| HII 3163 | K2 | 12.7 | 0.96 | 60 | 120 | 120 | |
| URSA MAJOR | |||||||
| HD 72905 | G1 V | 5.6 | 0.62 | 10 | 14.3 | 300 | |
| HD 125451 | F5 IV | 5.4 | 0.39 | 40 | 26.1 | 300 | Binary; sep. |
| HD 139798 | F2 V | 5.8 | 0.35 | 35.7 | 300 | ||
| HD 184960 | F7 V | 5.7 | 0.48 | 7 | 25.6 | 300 | |
| COMA BERENICES | |||||||
| HD 107067 | F8 | 8.7 | 0.52 | 6 | 68.8? | 500 | SB? |
| HD 108102 | F8 | 8.2 | 0.49 | 35 | 107.1 | 500 | SB2 |
| HD 108651 | A0 | 6.7 | 0.22 | 18 | 79.0 | 500 | SB2 |
| HYADES | |||||||
| HD 27459 | F0 V | 5.3 | 0.23 | 68 | 47.2 | 625 | |
| YOUNG FIELD STARS | |||||||
| HD 105 | G0 V | 7.5 | 0.60 | 13 | 40.2 | 500 | |
| HD 35850 | F7 V: | 6.3 | 0.50 | 40 | 26.8 | 230 | |
| HD 37484 | F3 V | 7.2 | 0.37 | 42 | 59.5 | 80 | |
| HD 134319 | G5 | 8.4 | 0.64 | 44.3 | 500 | ||
| HD 177996 | K1 V | 7.9 | 0.86 | 4 | 31.8 | 300 | SBaafrom Soderblom, King, & Henry (1998) |
| HD 202917 | G5 V | 8.7 | 0.65 | 12 | 45.9 | 180 | |
| HD 209253 | F6/F7 V | 6.6 | 0.46 | 16 | 30.1 | 400 | |
| OTHER | |||||||
| HD 151044 | F8 V | 6.5 | 0.54 | 5 | 29.4 | ||
| Target | IRAS Fluxes | ISO Fluxes**Photospheric estimates have not been subtracted from the fluxes presented. Upper limits given are 3. | Comment | |||||
|---|---|---|---|---|---|---|---|---|
| 12 | 25 | 60 | 100 | 60 | 100 | |||
| (mJy) | (mJy) | (mJy) | (mJy) | (mJy) | (mJy) | |||
| Sz 4 | 88 | 142 | 241 | 219 | 210 | 240 | ||
| SZ Cha | 260 | 1390 | 3680 | 3410 | 3545 | 2546 | 910 | 1 |
| TW Cha | 238 | 405 | 450 | 110aaFrom co-added IRAS data and DECON Weaver & Jones (1992) | 528 | 267 | 480 | |
| CED 110 | 336 | 140 | 17130 | 7945 | 250 | 2 | ||
| UZ Cha | 112 | 128 | 268 | 229 | 320 | |||
| Lk H 332-17 | 2200 | 3370 | 6450aaFrom co-added IRAS data and DECON Weaver & Jones (1992) | 8550aaFrom co-added IRAS data and DECON Weaver & Jones (1992) | 6715 | 640 | 3 | |
| Glass Ia | 10400 | 14720 | 9570 | 12970 | 7216 | 4120 | ||
| WX Cha | 500 | 514 | 250aaFrom co-added IRAS data and DECON Weaver & Jones (1992) | 232 | 2240 | |||
| WY Cha | 477 | 830aaFrom co-added IRAS data and DECON Weaver & Jones (1992) | 20610aaFrom co-added IRAS data and DECON Weaver & Jones (1992) | 720 | 4 | |||
| XX Cha | 395 | 560 | 590 | 550 | 5 | |||
| CHX 18N | 5 | |||||||
| HM Anon | 790 | 4640 | 831 | 793 | 130 | 6 | ||
| HM 32 | 93 | 212 | 660 | 1080aaFrom co-added IRAS data and DECON Weaver & Jones (1992) | 462 | 353 | 1010 | 7 |
| RX J0850.1-7554 | 20bbRaster measurement at 90 | 6.9 | 8 | |||||
| ScoPMS 214 | 116 | 129bbRaster measurement at 90 | 27.1 | 9 | ||||
| Non-detected or contaminated PMS stars | ||||||||
| HM 5 | 270 | 129 | 10 | |||||
| UX Cha | 114 | 90 | ||||||
| Sz 23 | 11 | |||||||
| HM 19 | 12 | |||||||
| VX Cha | 13 | |||||||
| GK-1 | 14 | |||||||
Notes –
1. Henning et al. (1993) measured a 1.3mm flux. We included for the purpose of
checking calibration of ISO fluxes.
2. Indistinguishable from the nearby reflection nebula in the IRAS beam.
At 60 , our observations indicate a point source. At
100 we are only able to place an upper limit to the flux.
3. Henning et al. (1993) measured a 1.3mm flux. At 60 , our observations
indicate a point source. At 100 the data appear to be
contaminated by flux from the nearby B-type star HD 97048 and we give
only an upper limit.
4. Another TTS, CHX 15a falls on one of the source-frame pixels. IRAS
detected flux from both objects, and we give an upper limit to the
contribution from WY Cha. At 60 , the total fluxes agree with
the IRAS value; at 100 , cirrus confusion is very high.
5. Originally identified as the source of the far-IR emission detected
by IRAS at this position. Subsequent X-ray studies questioned this
association, and Walter (1992) considered nearby CHX 18N (also WTTS,
separation ) to be the IR source. In our ISO
observations, the two stars fall on different pixels in the source
frame. Both pixels show detected emission, and it seems that each
star contributes part of the far-IR emission.
6. Has surrounding nebulosity. Appears to be a point source at
60 , but at 100 appears either extended or
confused with the nebulosity.
7. Henning et al. (1993) measured a 1.3mm flux. Our measurements at 60 and
100 are significantly lower than IRAS co-added data.
Evidence for either extension or nebulosity confusion at
100 .
8. One of the X-ray selected WTTS (Alcala et al., 1995), and it was one of the few
confirmed as PMS by detection of lithium (Covino et al., 1997).
9. An X-ray selected WTTS (Walter et al., 1994). It appears quite extended
in our data at both wavelengths.
10. Hartigan (1993) notes that this source has essentially disappeared since
its first detection.
11. IRAS lists no data for either VW Cha or Sz 23 due to the proximity of
the Infrared Nebula. Both stars fall on the same ISOPHOT pixel and we
provide an upper limit to their combined fluxes.
12. Contaminated with flux from nearby PSC 11072-7727, the Infrared
Nebula.
13. This source appears to be dramatically variable. While Prusti, Whittet, & Wesselius (1992)
give near-IR magnitudes, it went undetected by the recent DENIS
observations (Cambresy et al., 1998).
14. Contaminated with flux from nearby HD 97300.
| Target | IRAS Fluxes | ISO Fluxes**Photospheric estimates have not been subtracted from the fluxes presented. Upper limits given are 3. | Comment | |||||
|---|---|---|---|---|---|---|---|---|
| 12 | 25 | 60 | 100 | 60 | 90 | |||
| (mJy) | (mJy) | (mJy) | (mJy) | (mJy) | (mJy) | |||
| PERSEI | ||||||||
| HE 361 | 36 | 6.2 | ||||||
| PLEIADES | ||||||||
| HII 1132 | 224 | 28 | 26 | 66.0 | 1 | |||
| HII 3163 | 38 | 93.4 | ||||||
| URSA MAJOR | ||||||||
| HD 72905 | 885 | 208 | 77 | 53 | 2.8 | |||
| HD 125451 | 717 | 203 | 170 | aaChopped upper limit at 100 | 0.77 | |||
| HD 139798 | 497 | 127 | 62 | aaChopped upper limit at 100 | 0.33 | |||
| HD 184960 | 605 | 166 | 50 | 46 | 1.0 | |||
| COMA BERENICES | ||||||||
| HD 107067 | 170 | aaChopped upper limit at 100 | 11.5 | 2 | ||||
| HD 108102 | 150 | aaChopped upper limit at 100 | 5.9 | |||||
| HD 108651 | 154 | 177 | aaChopped upper limit at 100 | 1.3 | ||||
| HYADES | ||||||||
| HD 27459 | 530 | 50 | 0.95 | |||||
| YOUNG FIELD STARS | ||||||||
| HD 105 | 143 | 167 | 2.9 | |||||
| HD 35850 | 440 | 80 | 49 | 50 | 0.26 | |||
| HD 37484 | 120 | 120 | 130 | 115 | 84 | 1.6 | ||
| HD 134319 | 48 | 1.6 | ||||||
| HD 177996 | 220 | 42 | 0.47 | |||||
| HD 202917 | 50 | 38 | 2.5 | |||||
| HD 209253 | 290 | 140 | 127 | 107 | 1.0 | |||
| OTHER | ||||||||
| HD 151044 | 321 | 73 | 116 | 88 | 100 | 1.5 | 3 | |
Note. —
1. IRAS FSC has a 12 measurement that is much too high to be photosphere, though there no indication that this has ever been identified as an IR excess source. Our own observations with the UCLA double-beam infrared camera at the Lick 3m Shane telescope show normal magnitudes at J- and K-bands for this star’s spectral type.
2. The SB nature of this source is unconfirmed. Odenkirchen et al. (1998) note that the Hipparcos distance for this object is inconsistent with its photometric distance and placing the star at the cluster distance gives values for its space motion that is more consistent with cluster mean values.
3. Once considered an Ursa Major candidate. Please see text.