Atomic T Tauri disk winds heated by ambipolar diffusion
Abstract
We summarize results on the thermal and ionization structure of self-similar, magnetically-driven, atomic disk winds heated by ambipolar diffusion. We improve upon earlier work by Safier by considering (1) new MHD solutions consistent with underlying cold keplerian disk equilibrium, (2) a more accurate treatment of the micro-physics, and (3) predictions for spatially resolved forbidden line emission (maps, long-slit spectra). The temperature plateau K found earlier is recovered, but ionization fractions are revised downward by a factor of 10, due to previous omission of thermal speeds in ion-neutral momentum-exchange rates. The physical origin of the temperature plateau is outlined. Predictions are then compared with T Tauri star observations, with emphasis on the necessity of suitable beam convolution. Jet widths and variations in line profiles with distance and line tracer are well reproduced. However, predicted maximum velocities are too high, total densities too low, and the low-velocity [O i] component is too weak. Denser, slower MHD winds from warm disks might resolve these discrepancies.
keywords:
magnetohydrodynamics — ISM: jets and outflows — Stars: pre-main-sequence0.1 Introduction
Collimated mass ejection in young T Tauri stars (TTS) is intimately correlated with the accretion process (Cohen et al. 1989; Cabrit et al. 1990; Hartigan et al. 1995; hereafter HEG95). It is currently believed that magnetic forces are responsible for both the high ejection efficiency (/; Hartigan et al. 1994, HEG95) and the high degree of collimation of these winds. Yet, the exact field structure and flow dynamics are not well established. As a result, the role played by magnetized ejection in the physics of TTS, in particular in extracting angular momentum from the circumstellar disk and/or stellar surface, remains a major enigma.
Ejection from a wide range of disk radii has been invoked to explain the compact low-velocity [O i] emission peak observed in accreting TTS (Kwan & Tademaru 1988, 1995; Hirth et al. 1994; HEG95; Kwan 1997). However, it is still unclear whether the high-velocity “microjets” observed towards several TTS could trace the outer collimated regions of the same disk wind, or whether they require a distinct ejection component.
A new tool to discriminate between models consists in confronting theoretical predictions with recent spatially resolved observations of the inner wind structure of TTS in optically thin forbidden lines of [O i], [S ii], and [N ii] (see Bacciotti et al., Dougados et al., Ray et al., this volume, and refs. therein).
Of the wide variety of models available in the literature, only two classes have self-consistent stationary MHD solutions that have been used for detailed observational predictions: (1) ‘disk winds’ from a wide range of disk radii (Blandford & Payne 1982; Ferreira 1997) and (2) ‘X-winds’ from a tiny region of open stellar field lines near the disk corotation radius (Shu et al. 1995). Both are in the regime of “cold” MHD, where ejection is only possible by magneto-centrifugal launching on field lines sufficiently inclined from the disk axis, as thermal energy is insufficient to cross the potential barrier (unlike in the solar wind).
Synthetic maps and long-slit spectra were first presented by Shang et al. (1998) and Cabrit et al. (1999) for X-winds and disk winds respectively, using a parametrized temperature and ionization fraction. More reliable predictions require actually solving for the wind thermal and ionization state, given some local heating mechanism. Shock heating was recently invoked to explain line ratios in the outer regions of microjets (Dougados et al., Lavalley-Fouquet et al. 2000) but this mechanism is not fully consistent with a stationary solution and involves additional free parameters. Other modes of mechanical energy dissipation (e.g. turbulence) have the same drawbacks.
Here, we consider only a heating process intrinsic to MHD winds of low ionization, namely ion-neutral frictional drag (‘ambipolar diffusion heating’), which was first applied to predict integrated forbidden line emission in disk winds by Safier (1993a,b). It requires no extra free parameter and is self-consistently determined by the disk wind MHD structure. It will yield the “minimum” possible emission fluxes and ionization level, but emission maps and line profiles should still provide useful tests of the model collimation and dynamics. A detailed account of our results is given in Garcia et al. (2001).
0.2 Thermal and ionization structure
0.2.1 Method and improvements over previous work
We follow the same general approach as in the pioneering work by Safier (1993a). We follow a fluid cell along a given flow streamline, characterized by , the field line footpoint radius in the disk midplane, and solve for its coupled temperature and ionization evolution, including all relevant heating and cooling terms. We check a posteriori that the single, cold fluid assumptions made in computing the dynamical MHD solution remain valid, i.e. that drift speeds between ions and neutrals are small compared to the bulk flow speed, and that thermal pressure gradients are negligible compared to other forces. Our equations, heating/cooling terms, and self-consistency checks are described in Garcia et al. (2001). Important improvements to the work of Safier (1993a) include:
- Use of new self-similar cold disk winds solutions from Ferreira (1997), where vertical equilibrium of the keplerian accretion disk is treated self-consistently. The mass loading and magnetic lever arm are then fixed by a single parameter: the ejection efficiency in the disk .
- Treatment of the ionization evolution of heavy elements (C, N, O, S, Ca, Mg, Fe, …), photo-ionization heating, and cooling by hydrogen recombination lines, using the MAPPINGS Ic code (Binette et al., 1985, Binette & Robinson 1987).
- Correct computation of ion-neutral momentum exchange rates for ambipolar diffusion, including thermal speeds (cf. Draine 1980).
- Depletion of heavy atoms into grains outside the dust sublimation cavity (?).
0.2.2 MHD solution parameters
To limit the number of free parameters, we fix the disk aspect ratio , as indicated by observations of HH 30 (Burrows et al. 1996), and set the magnetic turbulence level parameter (controlling disk accretion across field lines) to (cf. Ferreira 1997). The central star mass is taken as 0.5 . Thus only 2 free global parameters are left:
- The ejection efficiency parameter , which typically ranges between 0.005 and 0.01 for the above and . Our disk wind extends from to and thus as observed in TTS.
- The disk accretion rate, , which determines both the jet density scalings and the photoionizing UV flux from the accretion disk boundary layer. We consider values between and yr-1, covering the observed range in accreting TTS (HEG95).
0.2.3 Results


Figure 1 presents the computed temperature, electronic density , and proton fraction along two streamlines for a typical solution with an intermediate value of 0.007 and various mass accretion rates. The main results are the following:
- Temperature reaches a plateau around K over most of the jet extent for the range of parameters applicable to T Tauri disk winds.
- The proton fraction rises steeply at the wind base, then freezes out in the far jet region () where densities are low and ionization timescales exceed dynamical timescales. In the temperature plateau, is roughly inversely proportional to and .
- The electron density is dominated by photoionization of heavy elements at the wind base, but is weakly dependent on further out.
- The main heating process is ambipolar diffusion, , and the main cooling term is adiabatic expansion, . A close match between the two terms is established in the temperature plateau region (see Fig. 2).
Remarkably, the same behaviors were found for the solutions investigated by Safier (1993a). In the next section we explain why they are generic properties of self-similar cold MHD disk winds.
0.2.4 Physical origin of the hot temperature plateau

It is useful to write the temperature evolution equation as a function of as:
| (1) | |||||
where is the wind particle density, is a positive function of order 1 before jet recollimation,
| (2) |
is another positive function (before recollimation) that depends only on the MHD wind solution, while
| (3) |
depends only on the local temperature and ionization state of the gas.
One can see that always increases as a function of temperature: either linearly when ionization is fixed (by photoionization or freeze-out), or much more steeply when collisional ionization of H is efficient, around K. These two regimes of are illustrated in Fig. 3 in the case of local ionization equilibrium. The function is also plotted in Fig. 3 for our solutions. It increases very rapidly at the base of the flow and then stabilizes in a plateau beyond the Alfvén point.
Now let us define a temperature such that:
| (4) |
Since increases with temperature, it can be readily seen that if at a given point , then and the gas will cool. Conversely, if , the gas will heat up. Thus, the fact that is a rising function introduces a feedback that tries to bring the temperature near its local equilibrium value , and near .
However, is not necessarily a possible solution of Eq. 1: in that case the right-hand term is close to zero (by definition of in Equ. 4) hence one must also have for consistency: Only when is flat can converge to , and can we have a temperature plateau with .
Indeed, is, for our models, a flat function. We can understand this by differentiating Eq. 4:
| (5) |
Hence is equivalent to . This is fulfilled for our models: Below the Alfvén surface, varies a lot, but collisional H ionization is sufficiently close to ionization equilibrium that still rises steeply around K (cf. Fig. 3). For our numerical values of , we have K and thus . Further out, where ionization is frozen out, we have (because ) but it turns out that in this region is a slowly varying function of , and thus we still have .
The behavior of when can also be understood: in self-similar disk wind models, scales as (). Since (when ) and is a high power of close to ionization equilibrium, most of this scaling is absorbed by , while remains around K for a wide range of model parameters. Note also that inclusion of thermal speeds (cf. Draine 1980) increases by 10 compared to Safier (1993a) and decreases our values of by the same amount, since only the product of these two terms enters in .
We conclude that MHD winds heated by ambipolar diffusion have a hot temperature plateau only when several conditions are met: (1) must be such that happens around K, (2) the wind must be in ionization equilibrium or near it in regions where is a fast function of ; (3) once we have ionization freezing, must vary slowly. For example, in the models of Ruden et al. (1990), ionization is quickly frozen while , hence no temperature plateau can be established (one has instead ).
0.3 Predicted forbidden line emission and comparison with observations
We compute observational predictions assuming that the disk wind extends from 0.07 AU (typical disk corotation radius for a T Tauri star) to 1 AU. Inside corotation, the disk is expected to be truncated by the stellar magnetosphere, while beyond 1 AU, the wind should become molecular and not contribute to forbidden line emission (Safier 1993a).
Given the strong gradients in physical conditions present in the wind, care was taken to convolve synthetic maps and spectra to typical resolutions, to allow meaningful comparison with observations. The successes and failures of our model predictions are outlined below.
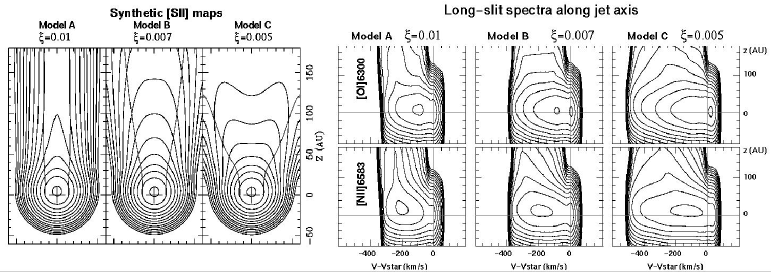
0.3.1 Wind morphology: Emission maps

The predicted maps for our models (Fig. 4) successfully reproduce two features present in observed microjets: (1) an unresolved peak slightly shifted from the stellar position, (2) jet-like emission appearing collimated within 200 AU of the star. Note that the MHD disk wind solutions considered by Safier 1993a did not collimate over such scales.
The shift of the unresolved peak cannot be used as model test because observed shifts are severely biased by accuracy of continuum subtraction (2% errors in subtraction imply AU error for bright jets (?)) and by possible obscuration by a flared disk.
The jet FWHM, in contrast, provides an excellent quantitative test of the model: It is almost independent of the inclination angle, accretion rate and line, but is strongly dependent on the MHD dynamical solution (Figs. 4,5). Note that it is also severely biased by the beam size (Fig. 5), an illustration of the importance of proper convolution before comparing to observations.
Predicted jet FWHM for models A and B () agree very well with observations of T Tauri microjets at the same resolution (Dougados et al., 2000 and in this volume). Models with lower (e.g. model C) are excluded. Note that at sufficiently high spatial resolution, disk jets should appear hollow, hence it would be important to get very high angular resolution data.
0.3.2 Wind kinematics: Line profiles
Typical long-slit spectra are presented in the right panels of Fig. 4, and integrated spectra for a wider range of parameters are plotted in Fig. 6. The predictions are successful in several respects:
- A compact low-velocity component (LVC) is produced near the star (Fig. 4), originating at the base of the slowly rotating outer disk streamlines. The LVC is stronger in [O i] than in [N ii], and is stronger for low accretion rates (Fig. 6), as observed (HEG95).
- An extended high-velocity component (HVC) is also present, tracing the accelerated regions of the wind. It is displaced further from the stellar position than the LVC, and the displacement is larger in [N ii] than in [O i] (Fig. 4), as observed (Hirth et al. 1997). The [N ii] line profile peaks at the blue edge of the [O i] line profile (Fig. 6), as also observed (HEG95).
However, we fail to reproduce some observed features:
- The relative intensity of the LVC with respect to the HVC is too small. At , it does not appear anymore as a distinct component in the [O i] profile. This weakness of the LVC stems from the low temperature and ionization below the Alfvén surface, where low-velocity gas is located.
- Predicted centroid and maximum radial velocities of [O i] profiles agree well with observations of the DG Tau microjet, but are too high compared with typical TTS profiles (HEG95) unless most stars are observed at (see Fig. 6). Terminal velocities in cold disk wind models are , so even our highest (model A) gives excessive speeds.
0.3.3 Integrated line fluxes
Several trends are well reproduced: Predicted integrated fluxes increase linearly with accretion rate, as observed (HEG95). This is an interesting consequence of the weak dependence of in the jet on (cf. Fig. 1): emissivity ( ) is then proportional to total density , instead of as would be the case for a constant ionization fraction. We also find a correlation between integrated fluxes in [O i] and [S ii], with a slope close to that observed (see Cabrit et al. 1990).
Quantitatively, however, integrated fluxes are systematically too weak compared to observations of TTS, for the same range of accretion rates, i.e. yr-1(HEG95). We find L([O i]) in in yr-1. The discrepancy is typically a factor 30 for a given . In the next section, we show that the flux deficit stems from insufficient , but also possibly from insufficient total density in our models.
0.3.4 Forbidden line ratios and total wind densities
As noted by Bacciotti & Eisloeffel (1999), forbidden line ratios of [S ii]6716/6731, [N ii]/[O i], and [S ii]/[O i] reflect directly the values of , , and . Hence, they test mainly the heating mechanism, not the underlying dynamical solution.
Spatially resolved line ratios within 200 AU of the star are available for four TTS microjets: HH 30, Th 28, DG Tau, and RW Aur (Bacciotti & Eisloeffel 1999; Lavalley-Fouquet et al. 2000; Bacciotti et al. and Dougados et al., this volume). Comparison with our predictions, at the same beam resolution and distance from the star, indicates that our models have slightly too high temperatures, and beam-averaged and that are too low by up to a factor 30. Two important remarks are in order:
(1) because of volume effects and strong density gradients, beam-averaged line ratios differ greatly from local line ratios, and give very little weight to the inner densest parts of the wind. Hence it is essential to apply proper convolution to perform meaningful comparison with observed ratios.
(2) No ad-hoc heating rate tuning is present in our model. Predicted line ratios would improve if we include extra mechanical energy deposition, e.g. in shocks, as illustrated in Dougados et al. (this volume), or with a dissipation length prescription, as done in Shang et al. (this volume).
For the latter reason, the total density / is a more useful quantity that can be directly compared with model predictions independently of the ionization process (although it can still be affected by shock compression and by beam averaging). For accretion rates of yr-1, total densities on the innermost streamline for our models are too low by a factor 10-100 compared to observations of the above four bright T Tauri microjets. Shock compression could explain a factor of 10 (Hartigan et al. 1994), but it seems that our models have intrinsically too low density close to the star.

0.4 Concluding remarks

We extended the original work of Safier (1993a,b), and compute the thermal structure of a disk wind jet, assuming current dissipation in ion-neutral collisions– ambipolar diffusion, as the major heating source. Improvements include: a) detailed dynamical models where the disk is self-consistently taken into account; b) ionisation evolution for all relevant “heavy atoms”; c) radiation cooling by hydrogen lines, recombination and photoionisation heating; d) correct momentum exchange rates; and e) more detailed dust description. We still obtain warm jets K but with ionisations fractions 10 to 100 times smaller than Safier, due to larger momentum exchange rates (including the dominant thermal velocity contribution) and to different MHD wind dynamics.
We have presented a complete set of predictions for forbidden line emission, where we have stressed the crucial effect of beam convolution. The model reproduces several observed trends: (1) images show an unresolved peak and an extended high-velocity jet, of width compatible with observations. (2) Line profiles present a low-velocity component (LVC), compact and near the star, and a high-velocity component (HVC), tracing the jet. The systematic differences between [O i] and [N ii] profiles are reproduced. (3) Line fluxes are proportional to , and the [O i]- [S ii]correlation slope is recovered.
Other line ratios ([S ii]6716,6731, [N ii]/[O i]) are not well reproduced, but we stress that they trace only the excitation conditions, which depend mainly on the heating mechanism, and do not test the underlying dynamical model; a better fit could be readily obtained with an extra tunable heating rate, such as done e.g. by Shang et al. (this volume) or with shocks (Dougados et al., this volume).
Two intrinsic properties of our dynamical models are not fully successful: Wind terminal velocities appear too high, and densities at the wind base appear too small, when compared with current estimates in bright microjets. One possible improvement would be to relax the assumption of a cold disk wind, and include heating at the disk surface (?). MHD disk winds with higher density and lower terminal velocities can then be obtained (see Fig. 7). The self-consistent thermal structure of these solutions remains to be investigated.
Acknowledgements.
References
- [Bacciotti & Eilsöffel¡1999¿] Bacciotti, F., Eislöffel, J., 1999, A&A 342, 717.
- [Binette et al.¡1985¿] Binette, L., et al., 1985, ApJ 297, 476.
- [Binette & Robinson¡1987¿] Binette, L. & Robinson, A. 1987, A&A 177, 11.
- [Blandford & Payne¡1982¿] Blandford, R.D., Payne, D.G. 1982, MNRAS 199, 883.
- [Burrows et al., ¡1996¿] Burrows, C. J. et. al., 1996, ApJ 473, 437.
- [Cabrit et al., ¡1990¿] Cabrit, S., et al., 1990, ApJ 354, 687.
- [Cabrit et al., ¡1999¿] Cabrit, S., et al., 1999, A&A 343, L61.
- [Casse & Ferreira¡2000¿] Casse, F., Ferreira, J. 2000, A&A 361, 1178.
- [Cohen et al.¡1989¿] Cohen, M. et al. 1989 ApJ, 339, 455.
- [Dougados et al.¡2000¿] Dougados, C., et al., 2000, A&A 357, L61.
- [Draine¡1980¿] Draine, B. T. 1980, ApJ, 241, 1021.
- [Ferreira¡1997¿] Ferreira, J, 1997, A&A, 319, 340.
- [Garcia et al.¡2001¿] Garcia, P. J. V.,et al., 2001, in preparation.
- [Garcia et al.¡1999¿] Garcia, P. J. V., et al., 1999, A&A, 346, 892.
- [Hartigan et al.¡1994¿] Hartigan, P., Morse, J. Raymond, J. 1994, ApJ 436, 125.
- [Hartigan et al.¡1995¿] Hartigan, P., et al., 1995, ApJ 452, 736 (HEG95).
- [Hirth et al., ¡1994¿] Hirth, G. A., et al., 1994, ApJL, 427, L99.
- [Hirth et al., ¡1997¿] Hirth, G. A., et al., 1997, A&ASS, 126, 437.
- [Kwan, ¡1997¿] Kwan, J., 1997, ApJ, 489, 284.
- [Kwan et Tademaru, ¡1988¿] Kwan, J. et Tademaru, E., 1988, ApJL, 332, L41.
- [Kwan et Tademaru, ¡1995¿] Kwan, J. et Tademaru, E., 1995, ApJ, 454, 382.
- [Lavalley-Fouquet et al.¡2000¿] Lavalley-Fouquet, C., et al., 2000, A&A 356, L41
- [Ruden et al., ¡1990¿] Ruden, S. P., et al., 1990, ApJ, 361, 546.
- [Safier¡1993a¿] Safier, P. N. 1993a, ApJ, 408, 115
- [Safier¡1993b¿] Safier, P. N. 1993b, ApJ, 408, 148
- [Savage & Sembach¡1996¿] Savage, B. D. & Sembach, K. R. 1996, ARA&A, 34, 279
- [Shang et al.¡1998¿] Shang, H., Shu, F., Galdssgold, A. 1998, ApJ 493, L91
- [Shu et al.¡1995¿] Shu, F., et al., 1995, ApJ 455, L155.