Comparative Analysis of GALLEX-GNO Solar Neutrino Data and SOHO/MDI Helioseismology Data; Further Evidence for Rotational Modulation of the Solar Neutrino Flux
Abstract
If the solar neutrino flux is variable, the variability could be caused by modulation of the neutrino flux by an inhomogeneous magnetic field in the solar interior. This modulation, which requires nonstandard physics involving a nonzero neutrino magnetic moment, could lead to an oscillation in the detected neutrino flux with a frequency set by the synodic rotation frequency in the region of the solar interior that contains the magnetic structure. We investigate this possibility by carrying out a comparative analysis of the GALLEX-GNO solar neutrino data and estimates of the solar internal rotation rate derived from the MDI helioseismology experiment on the SOHO spacecraft.
We first carry out a Lomb-Scargle analysis of the data. There is no significant peak in the spectrum that could be associated with the radiative zone. On the other hand, there are peaks that could be associated with the convection zone. We introduce a statistic, which we evaluate as a function of radius and latitude, that is a measure of the degree of “resonance” of oscillations in the neutrino flux and the synodic solar rotation rate at that radius and latitude. If the oscillations are real and caused by an internal magnetic structure, the resonance statistic will indicate the probable location of that structure. A map of this statistic indicates that the probable location is deep in the convection zone near the equator.
We next modify this statistic by integrating it over the equatorial section of the convection zone. This integral resonance statistic provides a measure of the likelihood that the variability of the solar neutrino flux, as measured by the GALLEX-GNO data, has its origin in the equatorial section of the convection zone. We apply the shuffle test, randomly reassigning measurements among runs, to estimate the significance of the value of the statistic computed from the actual data. This test implies that the result is significant at the 0.2% level. When, for comparison, we repeat this analysis for the radiative zone, we find that the integral resonance statistic is not significant. These results support earlier evidence for rotational modulation of the solar neutrino flux.
Subject headings: Sun: interior—Sun: particle emission—Sun—rotation
1 Introduction
There has for some time been great interest in the possibility that the solar neutrino flux is variable. Early tests focused on the possibility that the flux varies with the solar cycle. This period (11 years) is so long that power spectrum analysis is not feasible. Hence the preferred test for variability was an indirect one, namely, the search for a correlation between the solar neutrino flux and an index of solar variability such as the Wolf sunspot number (Bahcall, Field & Press 1987; Bahcall & Press 1991; Bieber et al. 1990; Dorman & Wolfendale 1991), the surface magnetic field strength (Massetti & Storini 1993; Oakley et al. 1994), the intensity of the green-line corona (Massetti & Storini 1996), or the solar wind flux (McNutt 1995). Walther (1997) has criticized such claims—specifically the claim that the neutrino flux is anti-correlated with the sunspot number—on the grounds that the authors used smoothed data and then applied tests that are appropriate only if data points are independent. Snodgrass and Oakley (1999) have in turn criticized Walther’s article, and Walther (1999) has responded to that criticism. The implications of correlation analyses remain in doubt.
Although the overall duration of solar neutrino data (24 years for the Homestake experiment) is not long enough to permit a definitive spectrum analysis for oscillations as slow as the solar cycle, the duration is adequate for a search for oscillations of shorter period. Haubold and Gerth (1990) have used spectrum analysis to search for evidence of oscillations with period of order one year. More recently, Haubold (1998) has used wavelet analysis for this purpose.
It is well known that indices such as sunspot number, surface magnetic field strength, coronal brightness, etc., are strongly influenced by solar rotation. They display oscillations with a basic synodic period of about 27 days and harmonics of this frequency. These oscillations arise from the fact that the solar magnetic field is highly inhomogeneous, and that some components of this field last for several or many solar rotations. Neugebauer et al. (2000) have recently presented evidence of a rotational pattern in the solar wind that lasts for more than three solar cycles. Compared with the duration of neutrino experiments, the solar rotation period is short enough that it is quite reasonable to search for the influence of rotation by means of time-series spectrum analysis.
According to “standard physics,” one would not expect the solar neutrino flux to vary. However, it has been realized for some time that neutrino processes may be governed by “nonstandard physics” (see, for instance, Raffelt 1996). It appears that the currently most popular candidate for the solution of the solar neutrino deficit (see, for instance, Bahcall, Krastev & Smirnov 1998) is the MSW effect (Mikheyev & Smirnov 1986a, 1986b, 1986c; Wolfenstein 1978, 1979), whereby electron neutrinos may be converted into either muon or tau neutrinos as they propagate through matter in the solar interior. The possibility that neutrino magnetic moment may have something to do with the neutrino deficit was first advanced by Cisneros (1971), who considered propagation through magnetic field in the core of the Sun. This leads to spin precession (see also Fujikawa & Schrock 1980), which converts some of the left-handed electron neutrinos, that are produced by nuclear reactions in the core, into sterile right-hand neutrinos which are not detectable. At a later date, Voloshin, Vysotskii, and Okun (1986a, 1986b) and Barbieri and Fiorentini (1988) examined the possible variation of the solar neutrino flux due to propagation through the solar convection zone, taking account of the effect of matter as well as magnetic field. They found that matter tends to suppress spin precession, although spin precession is still possible if the product of the magnetic moment times the magnetic field strength is large enough. This is now known as the “VVO” effect. Schechter and Valle (1981, 1982) considered the effect of a possible flavor-off-diagonal (transition) magnetic moment, and found that this could lead to the simultaneous precession of both spin and flavor (“spin-flavor precession” or “SFP” if neutrinos propagate through a magnetic field. Akhmedov (1988a,b) and Lim & Marciano (1988) analyzed the propagation of neutrinos through matter permeated by magnetic field , with application to propagation through the solar convection zone. They found that, for a given neutrino energy, there is a certain density at which a resonant process occurs, enhancing spin-flavor precession. This is now known as “resonant spin-flavor precession” (RSFP). The implications of RSFP for solar neutrinos have been reviewed more recently by Akhmedov (1997) and Pulido & Akhmedov (2000).
Much of the above analysis was stimulated by the possibility that the solar neutrino flux may vary in the course of the solar cycle, although Voloshin, Vysotskii, & Okun (1986a, 1986b) also drew attention to the possibility that the flux may vary in the course of a year, due to a possible latitude-dependence of the internal magnetic field and to the inclination of the Sun’s rotation axis to the ecliptic. These issues remain important but, for reasons given above, we have become more interested in the possibility that the flux may vary with the solar rotation frequency. Such an effect is most likely to show up if the Sun contains strong, extensive and long-lived magnetic structures, especially if they are situated where the Sun exhibits something close to rigid rotation.
The solar interior is divided into two sharply different region by the “tachocline,” located at about . (Here and elsewhere the radius is normalized to that of the photosphere.) Nuclear burning occurs near the center: 80% of the burning occurs within (see, for instance, Bahcall 1989, p. 147). Between the nuclear-burning core and the tachocline is the radiative zone. According to data derived from helioseismology (Schou et al. 1998), the core and radiative zone are in substantially rigid rotation with a sidereal rotation rate in the range . We find it convenient to measure frequencies in cycles per year, since this leads to a simple relationship between the sidereal and synodic values:
| (1.1) |
At the tachocline, the sidereal rotation rate jumps from about at to about at . Above the tachocline, in the convection zone which extends to the photosphere, the rotation rate varies with radius and latitude, from a minimum of about at at the poles to a maximum of about at at the equator. Early in our research, these considerations led us to focus our attention on the radiative zone since this is larger than the convection zone, contains gas of higher pressure that could contain stronger magnetic field, and is believed to rotate effectively like a rigid body.
In searching for evidence for rotational modulation of the solar neutrino flux by examining radiochemical data, one is faced with the serious difficulty that the timing of the data acquisition is comparable with the period of oscillations one is looking for. These data have been acquired in runs, each lasting two to four weeks, the runs being spaced at intervals of two to four weeks. Aware of this difficulty, we nevertheless proceeded to search for an oscillation in the Homestake data with a frequency comparable with the synodic rotation frequency of the radiative zone (), using a maximum-likelihood procedure (Sturrock et al. 1997). We found a strong peak at . We have also found some evidence that the solar neutrino flux, as measured by the Homestake experiment, exhibits modulation related to heliographic latitude (Sturrock et al. 1998).
The GALLEX (Anselmann et al. 1993, 1995; Hampel et al. 1996, 1997) and GNO (Altman et al. 2000) consortia, working with the same gallium experiment, have also acquired extensive radiochemical measurements of the solar neutrino flux. We have published a preliminary spectrum analysis of the GALLEX data (Sturrock et al. 1999), based on a least-squares procedure (Knight, Schatten, & Sturrock 1979), which shows some evidence of a periodicity that may be related to solar rotation.
As an independent investigation of the question of variability, we have recently studied the histogram of GALLEX-GNO data (Sturrock & Scargle 2001). This histogram certainly appears to be bimodal, but this claim needs further investigation. A bimodal histogram would be incompatible with a stationary time series but could be compatible with a neutrino flux with a large-amplitude oscillation with a period of order a few weeks.
The timing of the radiochemical experiments is (fortunately) not completely regular. Bretthorst (1988) has shown by Bayesian analysis that the Lomb-Scargle technique of spectrum analysis (Lomb 1976, Scargle 1982) is the optimum procedure to apply to irregularly spaced data. He has shown that irregular timing, far from being a drawback, is in fact a great asset, permitting finer frequency resolution and mitigating the adverse effect of aliasing. We present a Lomb-Scargle spectrum analysis of the GALLEX-GNO data in Section 2. We do not find a single dominant peak in the band of frequencies that may be associated with the radiative zone. However, we do find more than one peak in the frequency band associated with the convection zone.
In Section 3, we consider the solar interior on a point-by-point basis, introducing a statistic that measures the degree of resonance between the oscillation of the neutrino-flux measurements and the local rotation. If one were to assume that the oscillation is real and is due to modulation by a magnetic structure (or structures) in the solar interior, this map would indicate the probable location of the structure. We find, from examination of the map, that the modulation (if real) probably occurs in the low-latitude region of the lower half of the convection zone. This finding is compatible with our theoretical expectation that modulation should occur near the equator since, as we discuss in Section 4, neutrinos detected on Earth must have passed through the convection zone in a small band of latitudes.
In Section 4, we carry out a statistical evaluation of the significance of the above result. By integrating the point-by-point resonance statistic over the equatorial section of the convection zone, we form an “integral resonance statistic” that is a measure of the correlation between the structure of the power spectrum and the distribution of rotation rates in the entire convection zone. We compare the actual value of this statistic with the distribution of values found from simulated (“shuffled” data obtained by randomly reassigning the measurements among runs. Of 10,000 simulations, only 16 have values larger than the actual value, indicating that the correspondence between the power spectrum and rotation in the convection zone is significant at the 0.2% level.
For comparison with the above result, we present in Section 5 a similar comparative analysis of the GALLEX-GNO spectrum and the rotation profile of the radiative zone. The shuffle test shows no evidence that the solar neutrino flux is modulated by a structure or structures embedded in the radiative zone.
In Section 6, we comment upon the findings of this article and indicate some of the follow-up research that will be required.
2 Lomb-Scargle Analysis
We here present the results of a Lomb-Scargle spectrum analysis of the GALLEX-GNO data. This analysis will be discussed in more detail in a later article, where we will evaluate the strengths and weaknesses of the procedure as applied to neutrino data, and compare of spectra obtained from GALLEX-GNO data and from Homestake data.
Most of the runs last about four weeks but, on the other hand, the half-life of the capture product is only 11.43 days (Bahcall 1989, p. 343). The survival probability of a germanium nucleus produced on the first day of a run is only 18%. Hence the measurement of each run is weighted towards captures late in the run. We shall show in our forthcoming article that, when we calculate the amplitude of the oscillation of the flux measurements caused by a sinusoidal modulation of the neutrino flux with periods of order four weeks, the measurement of each run is even more heavily weighted in favor of events late in the run. For this reason, we can obtain a satisfactory estimate of the spectrum of the neutrino flux by assigning the measurement made during each run to the end time of that run. This is not to minimize the challenge posed by the goal of extracting the power spectrum of the neutrino flux from measurements acquired from runs lasting three or four weeks. These difficulties will be discussed in our later article. As Bretthorst (1988) has shown, it is a distinct advantage that the timing of data we are analyzing has not been completely regular (although we could have wished the timing to have been more irregular than it actually is).
The result of our Lomb-Scargle analysis of the GALLEX-GNO data is shown in Figure 1, for frequencies in the range 10 to . If modulation were occurring in the radiative zone, we might expect a fairly well defined peak, since that region is believed to be in rigid rotation. According to helioseismology data (Schou et al. 1998), the rotation rate of the radiative zone is in the range 12.5 to , and probably in the range 12.6 to . We see from Figure 1 that there is no significant peak in this range. There is an interesting peak with at which, if real, may be related to the tachocline.
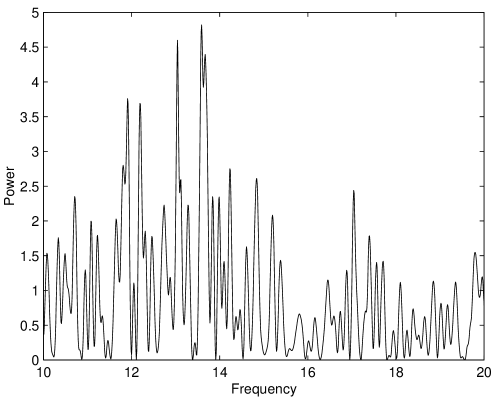
The rotation rate of the equatorial section of the convection zone is in the range 14.3 to sidereal or 13.3 to synodic. This band represents a combination of uncertainty in the measurements and a real variation of the rotation rate with radius. We see, in Figure 1, that there is a prominent double peak in this band, each peak having power of about . For a given frequency, the probability of finding a peak of power or more is (Scargle 1982). If there are indeed two independent peaks, the combined significance would be notable.
3 Map of Resonance Statistic
Our goal is to examine the relationship between the variability of the neutrino flux and internal rotation. It is convenient to begin by introducing a visual display of this relationship. Schou et al. (1998) have tabulated the rotation rate and the error estimate for 101 values of the radius and 25 values of the latitude These data determine a probability distribution function (PDF) of the rotation frequency for each pair of values :
| (3.1) |
Since we wish to compare the rotation frequencies with the neutrino-flux variability as measured on Earth, it is appropriate to inspect the synodic rotation rates rather than the sidereal rates.
We can define a measure of the degree of resonance of the neutrino flux with internal rotation by forming the following “resonance statistic,”
| (3.2) |
where is the Lomb-Scargle spectrum computed in Section 2. In this integral, we need to select limits of integration that are sufficiently wide to cover all significant contributions from the PDF. We have adopted and , but a much smaller range would have been satisfactory. A map of as a function of radius and latitude is presented in Figure 2.
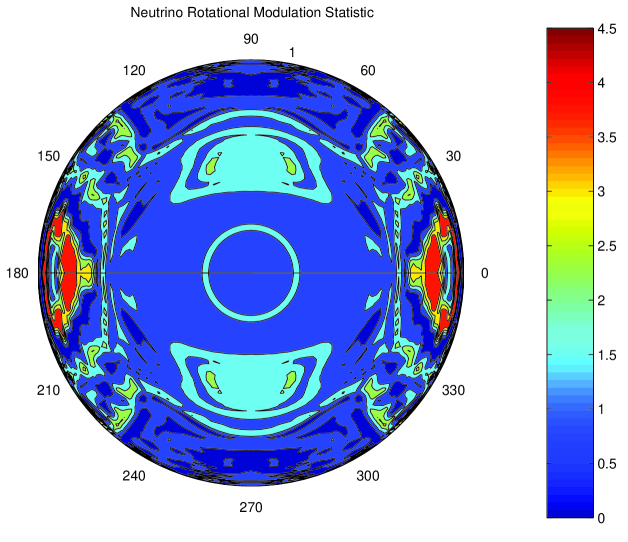
This figure is essentially a mapping of the power spectrum of the solar-neutrino time series onto the solar interior. Where the map is colored yellow or red, is large compared with its average value of unity. This denotes a “resonance” between the neutrino flux and the local solar rotation in the sense that the two “oscillations” (flux variability and rotation) have the same frequency. When the color is blue, there is no such resonance. If two regions of the solar interior have the same rotation rate, they will tend to have the same value of the statistic .
Another way of looking at this figure, which is perhaps physically more significant, is the following:- Let us assume that there is a well-defined oscillation in the neutrino flux, and let us assume that this oscillation is due to modulation of the flux by a structure (such as a magnetic structure) in the solar interior. Then we can attempt to locate that structure by finding the location (or locations) where the rotation rate has just the correct value to account for the dominant oscillation of the neutrino flux. The map shown in Figure 2 may now be viewed as a PDF for the location of the modulating structure.
We see from the map that, if the neutrino flux is variable, and if the variability is due to modulation by some internal solar structure, then that structure is probably in the lower part of the convection zone and (as we would expect) near the equator. The map offers no evidence that such modulation is occurring in the core or in the radiative zone.
4 Significance of the Apparent Convection-Zone Modulation
We now need a statistical evaluation of the significance of the modulation of the neutrino flux by a structure or structures within the convection zone that is suggested by Figure 2.
Most neutrinos detected by the GALLEX-GNO experiment are produced by pp (proton-proton) reactions, and 80% of the pp reactions occur within a radius of 0.15 of the center of the Sun (see, for instance, Bahcall 1989, p. 147). Near the surface of the Sun, this corresponds to a range degrees of heliographic latitude. We also note that the Sun’s axis is tilted at about 7.25 degrees with respect to the ecliptic. Hence most of the neutrinos detected by GALLEX-GNO have passed well within 16 degrees of the solar equator in penetrating the surface of the Sun. Over the maximum range of 16 degrees, the rotation rate varies by less than 1 percent within the convection zone. This variation is not insignificant, and we will examine this effect further in a later article, but we choose to ignore it in the present analysis. We therefore choose, for present purposes, to restrict our attention to the profile of the rotation rate in the equatorial section of the Sun.
It is now necessary to introduce a PDF characterizing the distribution of rotation rates over the entire equatorial section of the convection zone (CZ). This may be formed from the PDF of equation (3.1) as follows:
| (4.1) |
We may verify that
| (4.2) |
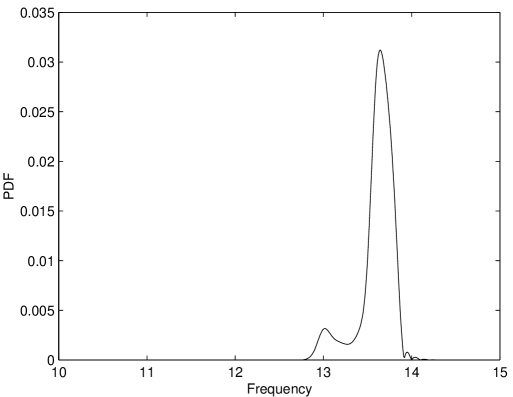
We denote by and the lower and upper limits of the convection zone. The former is set by the upper limit of the tachocline, so , and the latter by the photosphere, so . Over this range the minimum sidereal frequency is , and the maximum is , a range of almost 4%. The resulting PDF is shown in Figure 3.
We now form the “integral resonance statistic”
| (4.3) |
where is the power spectrum computed by the Lomb-Scargle process in Section 2. [This procedure is known in Bayesian parlance (see, for instance, Bretthorst 1988) as an integration over a “nuisance parameter.”] We denote by the actual value of derived from the data, and we find that . We now need to assess the significance of this value.
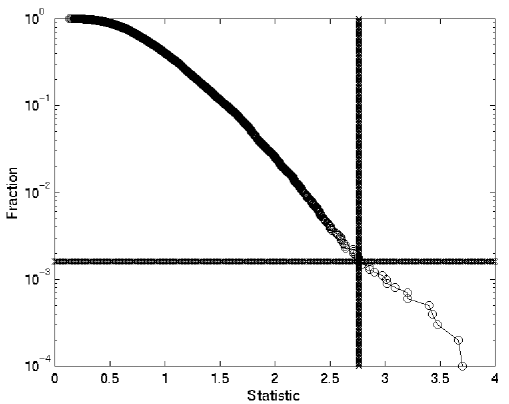
We adopt the method introduced by Bahcall and Press (1991) in their study of the apparent anticorrelation between Homestake measurements and the sunspot number. The procedure is to “shuffle” the data many times, reassigning the flux measurements among runs. We have carried out 10,000 shuffles of the data and the results are shown in Figure 4. We find that, of the 10,000 random simulations, only 16 have values . From this analysis, we infer that there is a probability of less than 0.2% of obtaining the actual value of by chance. We conclude that the modulation of the neutrino flux, as measured by the GALLEX-GNO experiment, in the frequency band corresponding to the solar convection zone, is significant at the 0.2% level.
5 Test of Possible Radiative-Zone Modulation
We have repeated the calculations made in Section 4, applying them to the radiative zone (RZ). We use equation (4.1) to calculate , except that we now adopt and . The resulting PDF is shown in Figure 5.
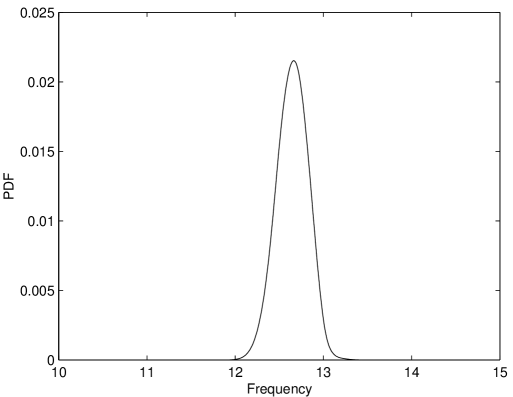
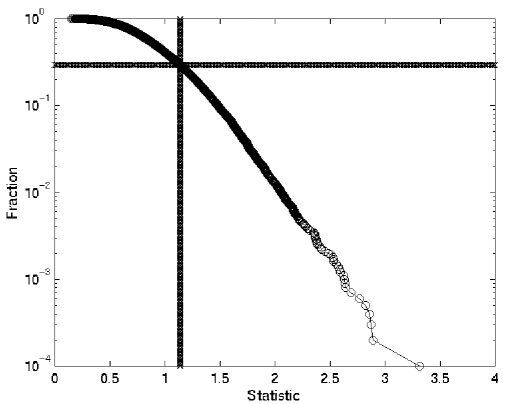
When we calculate the resonance statistic , using equation (4.3), we obtain the value . We have carried out 1,000 shuffles of the data, and the results are shown in Figure 6. We see that, of the 1,000 random simulations, almost 300 have values . From this analysis, we infer that there is no significant resonance between oscillations of the solar neutrino flux and rotation of the radiative zone.
6 Discussion
We shall continue to examine the evidence for rotational or other modulation of the solar neutrino flux using independent tests and, as far as this is possible, independent data sets. We will certainly repeat the resonance-statistic analysis for the Homestake (Davis & Cox 1991; Lande et al. 1992; Cleveland et al. 1995, 1998) and SAGE (Abdurashitov et al. 1999) data, since these data sets are publicly available. We will also carry out a similar analysis of the SNO (Sudbury Neutrino Observatory) data when in due course those data become available, and of the Kamiokande and/or Super-Kamiokande data in the happy event that those data are one day released to the public. Since the GONG (Global Oscillations Network, National Solar Observatory) consortium has recently carried out a new analysis of solar internal rotation, we plan to repeat the previous calculation using the results of that analysis.
As we mentioned in the introduction, spectrum analysis of radiochemical data requires great care. We believe that the Lomb-Scargle analysis as used in this article is trustworthy, but this is not to say that other procedures may not yield superior information. To this end, we plan to develop a modification of the Lomb-Scargle procedure that takes account of the data acquisition process, including the exponential decay of capture products, inherent in radiochemical experiments. This will be similar to, but probably not identical to, the maximum-likelihood procedure that we used to analyze the Homestake data (Sturrock et al. 1997).
In view of the results of this article, it will be interesting to review the claimed correlations between neutrino measurements and familiar solar indices such as sunspot number, surface magnetic field strength, etc., which we discussed in Section 1. If the rotational modulation of the neutrino flux is real, as it now appears to be, this could provide an explanation of these correlations, since almost every solar index also displays such a modulation. If Homestake data were the basis of an earlier study , we will repeat the analysis using GALLEX-GNO data. If it is possible to use an alternative and independent source of data for a solar index, we shall do so. If a new study shows evidence of a significant correlation between the solar neutrino flux and another solar index, we will test to see if that correlation is due partly or completely to the fact that they are both influenced by rotational modulation.
If we accept the evidence that modulation of the solar neutrino flux, as measured by the GALLEX-GNO experiment, occurs in the low convection zone, and if we assume that the modulation is due to a known mechanism such as the VVO or RSFP process, we can begin to estimate the neutrino parameters and magnetic field strength required to explain this result. Once these parameters are estimated, we should be in a position to predict whether or not similar modulation should be detectable by high-energy experiments such as Kamiokande, Super-Kamiokande, and SNO.
7 Acknowledgments
This article is based on work supported in part by NAS grants NSS 8-37334 and NAG5-4038, and NSF grant ATM-9910215. It is a pleasure to acknowledge the interest of and helpful suggestions from Evgeni Akhmedov, Blas Cabrera, Sasha Kosovichev, John Leibacher, Joao Pulido, Jeff Scargle, Guenther Walther, and Mike Wheatland.
References
- [1] Abdurashitov, J.N., et al. 1999, Phys. Rev. C 60, 055801.
- [2] Akhmedov, E. Kh. 1988a, Sov. J. Nucl. Phys. 48, 382.
- [3] Akhmedov, E. Kh. 1988b, Phys. Lett. B 213, 64.
- [4] Akhmedov, E. Kh. 1997, Proc. 4th International Solar Neutrino Conference (Heidelberg, Germany, April 9 - 11 1997) [LANL preprint hep-ph/9705451].
- [5] Altman, M., et al. 2000, Phys. Lett. B (in press).
- [6] Anselmann, P., et al. 1993, Physics Lett. B 314, 445.
- [7] Anselmann, P., et al. 1995, Physics Lett. B 357, 237.
- [8] Barbieri, R., & Fiorentini, G. 1988, Nucl. Phys. B 304, 909.
- [9] Bahcall, J.N. 1989, Neutrino Astrophysics (Cambridge University Press).
- [10] Bahcall, J.N., Field, G.B, & Press, W.H. 1987, Ap.J. Lett. 320, L69.
- [11] Bahcall, J.N., & Press, W.H. 1991, Ap.J. 370, 730.
- [12] Bahcall, J.N., Krastev, P.I., & Smirnov, A. Yu. 1998, Phys. Rev. D 58, 096016-1.
- [13] Bieber, J.W., Seckel, D., Stanev, T. & Steigman, G. 1990, Nature 348, 407.
- [14] Bretthorst, G.L. 1988, Bayesian Spectrum Analysis and Parameter Estimation, Vol. 48 of Lecture Notes in Statistics (eds. J. Berger, S. Fienberg, J. Gani, K.Krickeberg, and B. Singer; Berlin: Springer-Verlag).
- [15] Cisneros, A. 1971, Astrophys. Sp. Sci. 10, 87.
- [16] Cleveland, B.T., et al. 1995, Proc. Nucl. Phys. B (Proc. Suppl.) 38, 47.
- [17] Cleveland, B.T., et al. 1998, Ap.J. 496, 505.
- [18] Davis Jr, R., & Cox, A.N. 1991, Solar Interior and Atmosphere (eds. A.N. Cox, W.C. Livingston and M.S. Matthews; Tucson: Univ. Arizona Press), 51.
- [19] Dorman, L.I., & Wolfendale, A.W. 1991, J. Phys. G: Nucl. Part. Phys. 17, 789.
- [20] Fujikawa, K., & Schrock, R.E. 1980, Phys. Rev. Lett. 45, 963.
- [21] Haubold, H.J. 1998, Astrophys. Sp. Sci. 258, 201.
- [22] Haubold, H.J., & Gerth, E. 1990, Solar Phys. 127, 347.
- [23] Hampel, W., et al. 1996, Phys. Lett. B 388, 384.
- [24] Hampel, W., et al. 1997, Phys. Lett. B 447, 127.
- [25] Knight, J.W., Schatten, K.H., & Sturrock, P.A. 1979, Ap.J. Lett. 227, L153.
- [26] Lande, K., et al. 1992, AIP Conf. Proc., No. 243. Particles and Nuclear Physics (ed. W.T.H. van Oers; New York: American Institute of Physics), 1122.
- [27] Lim, C.-S. & Marciano, W.J. 1988, Phys. Rev. D 37, 1368.
- [28] Lomb, N. 1976, Astrophys. Sp. Sci. 39, 447.
- [29] Massetti, S., & Storini, M. 1993, Solar Phys. 148, 173.
- [30] Massetti, S., & Storini, M. 1996, Ap.J. 472, 827.
- [31] McNutt, R.L., Jr. 1995, Science 270, 1635.
- [32] Mikhevev, S.P. & Smirnov, A. Yu. 1986a, Sov. J. Phys. 42, 913.
- [33] Mikhevev, S.P. & Smirnov, A. Yu. 1986b, Sov. Phys. - JETP 64, 4.
- [34] Mikhevev, S.P. & Smirnov, A. Yu. 1986c, Nuovo Cimento 9C, 17.
- [35] Neugebauer, M., Smith, E.J., Ruzmaikin, A., Feynman, J., & Vaughan, A.H. 2000. J.G.R. 105, 2315.
- [36] Oakley, D.S., Snodgrass, H.B., Ulrich, R.K., & VanDeKop, T.L. 1994, Ap.J. Lett. 437, L63.
- [37] Pulido, J., & Akhmedov, E.Kh. 2000, Astroparticle Physics 13, 227.
- [38] Raffelt, G.R. 1996, Stars as Laboratories for Fundamental Physics (Chicago: Univ. Chicago Press).
- [39] Sakurai, K. 1981, Solar Phys. 74, 35.
- [40] Scargle, J.D. 1982, Ap.J. 263, 835.
- [41] Schechter, J., & Valle, J.W.F. 1981, Phys. Rev. D24, 1883.
- [42] Schechter, J., & Valle, J.W.F. 1982, Phys. Rev. D25, 283 (erratum).
- [43] Schou, J., et al. 1998, Ap.J. 505, 390.
- [44] Snodgrass, H.B., & Oakley, D.S. 1999, Phys. Rev. Lett. 83, 1894.
- [45] Sturrock P.A., & Scargle, J.N. 2001, Ap.J. Lett. (in press).
- [46] Sturrock, P.A., Walther, G., & Wheatland, M.S. 1997, Ap.J. 491, 409.
- [47] Sturrock, P.A., Walther, G., & Wheatland, M.S. 1998, Ap.J. 507, 978.
- [48] Sturrock, P.A., Scargle, J.D., Walther, G., & Wheatland, M.S. 1999, Ap.J. Lett. 523, L177.
- [49] Voloshin, M.B., Vysotskii, M.I., & Okun, L.B. 1986a, Sov. J. Nucl. Phys. 44, 440.
- [50] Voloshin, M.B., Vysotskii, M.I., & Okun, L.B. 1986b, Sov. Phys. - JETP 64, 446.
- [51] Walther, G. 1997, Phys. Rev. Lett. 79, 4522.
- [52] Walther, G. 1999, Phys. Rev. Lett. 83, 1895.
- [53] Wolfenstein, L. 1978, Phys. Rev. D 17, 2369.
- [54] Wolfenstein, L. 1979, Phys. Rev. D 20, 2634.