Physical Conditions in the Foreground Gas of Reflection Nebulae: NGC 2023, vdB 102, and NGC 7023
Abstract
High resolution optical spectra of HD 37903 and HD 147009, which illuminate the reflection nebulae, NGC 2023 and vdB 102, were obtained for comparison with our results for HD 200775 and NGC 7023. Ground-based measurements of the molecules, CH, C2, and CN, and the atoms, Na I and K I, were analyzed to extract physical conditions in the foreground cloud. Estimates of the gas density, gas temperature and flux of ultraviolet radiation were derived and were compared with the results from infrared and radio studies of the main molecular cloud. The conditions are similar to those found in studies of diffuse clouds. The foreground material is less dense than the gas in the molecular cloud behind the star(s). The gas temperature was set at 40 K, the temperature determined for the foreground gas in NGC 7023. The flux of ultraviolet radiation was found to be less intense than in the molecular material behind the star(s). The column densities of Na I and K I were reproduced reasonably well when the extinction curve for the specific line of sight was adopted. We obtained NEWSIPS data from the archive for HD 37903 and HD 200775. The ultraviolet data on C I and CO allow extraction of the physical conditions by alternate methods. General agreement among the various diagnostics was found, leading to self-consistent pictures of the foreground photodissociation regions.
An Appendix describes checks on the usefulness of NEWSIPS data for interstellar studies. Equivalent widths are compared with a previous analysis of observations for interstellar gas toward 20 Aquilae. Excellent agreement is found with NEWSIPS results having smaller errors. A comparison of NEWSIPS data for C I toward X Per with data acquired with the Hubble Space Telescope shows similar levels of agreement in equivalent widths and that the derived column densities from results are accurate to better than a factor of 2 for absorption lines of moderate strength.
1 Introduction
Stars form under the gravitational collapse of gas and dust in interstellar molecular clouds. When a newly-formed star interacts with the surrounding material, the cloud’s physical conditions are altered. For instance, early type stars create photodissociation regions (PDRs), which are boundary layers between a source of far ultraviolet (FUV) radiation and the predominantly neutral cloud (Jaffe et al. 1990). These boundaries also exist between H II regions produced by O stars and the ambient material surrounding them. In photodissociation regions, the FUV radiation dominates the heating and chemical processes (Tielens & Hollenbach 1985a, 1985b; Hollenbach & Tielens 1999, HT99) and controls which atoms and molecules are observed. The observed relative abundances of atomic and molecular species and the use of chemical models yields the physical conditions in the PDR. These conditions provide clues to processes that occurred immediately following star formation. In this paper, we describe results for foreground PDR’s in three reflection nebulae based on measurements of absorption at visible and ultraviolet wavelengths occurring at the velocity of the PDR behind the illuminating source seen via emission lines. While absorption is sometimes seen at other velocities, the main components all have velocities consistent with the molecular cloud. From this fact, we infer an association with the material behind the star.
PDRs in molecular clouds and reflection nebulae have been studied extensively at all wavelengths. Analyses have been based on measurements from x-rays to radio wavelengths. Specific observations on the nebulae studied here are given below. In an effort to obtain a comprehensive understanding of the conditions that prevail in these regions, one dimensional, time-independent models have been developed (e.g., Tielens & Hollenbach 1985a, 1985b; van Dishoeck & Black 1986; Hollenbach, Takahashi & Tielens 1991; Draine & Bertoldi 1996, 1999). More realistic PDR models with clumpy structure and time dependent effects have been attempted as well (Meixner & Tielens 1993; Hollenbach & Natta 1995; Bertoldi & Draine 1996). Hollenbach & Tielens (1999) provide a comprehensive review of observations and modeling efforts for photodissociation regions.
Little attention has been given to studying PDRs through atomic and molecular absorption in the visible and ultraviolet portions of the spectrum observed along the line of sight to the central or illuminating star(s) . Federman et al. (1997 - hereafter Paper I) analyzed visible spectra for the line of sight toward HD 200775, which illuminates the reflection nebula NGC 7023. In an effort to expand upon this work, we obtained high resolution visible spectra toward NGC 2023 and vdB 102 as well as ultraviolet data on atoms and CO molecules in the reflection nebulae, NGC 2023 and NGC 7023. The ultraviolet data were obtained from the () archive, which was recalibrated with the New Spectral Image Processing System (NEWSIPS). The visible and UV absorption spectra yield information about the chemical composition and the physical conditions present in the foreground PDR. A more complete picture of PDRs emerges when the physical conditions in front of the star are compared to those inferred from analyses of data obtained at other wavelengths of the main molecular cloud behind the star.
1.1 NGC 2023
NGC 2023 is a reflection nebula embedded in the L1630 molecular cloud (Jaffe et al. 1990) in the constellation of Orion. Infrared images of the nebula (Gatley et al. 1987; Field et al. 1994, 1998) show that it has a 6′ extent with visible filamentary structures throughout and is approximately centered on the star HD 37903. In a far-infrared study, Harvey, Thronson, & Gatley (1980) showed that the molecular cloud lies behind HD 37903, which is located at a distance of 470 pc (Perryman et al. 1997). Several Herbig-Haro objects, which are associated with pre-main sequence stars, are observed in the nebula. Two Herbig-Haro objects (HH4 and HH5) in the southeastern part of the nebula are illuminated by star C (Malin, Ogura & Walsh 1987). Star C is thought to be a T Tauri star based on spectroscopy and its near infrared excess. Many embedded infrared sources have also been detected (Strom et al. 1975). Wyrowski et al. (2000) detected a ultra-high density clump ( 107 cm-3) which they propose could be the early stages of a protostar. Thus, NGC 2023 is an active region of star formation (Strom et al. 1975; Malin et al. 1987; Lada et al. 1991; Freyberg & Schmitt 1995).
The primary illuminating source for this nebula is HD 37903, a B1.5 V star with an effective temperature of approximately 22,000 K (Field et al. 1998). The radiation from this star has enough energy at 912 Å to form an H II region, 0.015 pc in size, detected by radio continuum emission at the star’s position within the nebula (Pankonin & Walmsley 1976, 1978; Wyrowski et al. 2000). The photons with 912 Å create a photodissociation region between the H II region and the rest of the neutral cloud. The proximity of the nebula and its bubble shaped geometry (Gatley et al. 1987) make it an ideal target for studying the interaction of the UV radiation from HD 37903 with the molecular material in L1630. tHE reflection nebula and its PDR have been extensively studied via x-ray (Freyberg & Schmitt 1995), ultraviolet (Witt, Bohlin, & Stecher 1984 - hereafter WBS84; Cardelli, Clayton, & Mathis 1989 - hereafter CCM89; Buss et al. 1994), infrared (e.g., Martini, Sellgren, & DePoy 1999 and references therein), millimeter (Jaffe et al. 1990), and radio observations (Fuente, Martín-Pintado & Gaume 1995; Lebrón & Rodríguez 1997; Wyrowski et al. 1997, 2000). The studies relevant to our work will be discussed in detail later.
1.2 vdB 102
The central star of vdB 102 is HD 147009, an A0 V star, with an effective temperature of about 9,500 K (de Geus, de Zeeuw & Lub 1989 - hereafter GZL89). This nebula was first catalogued and photometrically studied (van den Bergh 1966; Racine 1968) in the late 1960’s. The nebula is 160 pc away (Perryman et al. 1997) and is one of 10 reflection nebulae in the Sco OB2 Association (van den Bergh 1966; Vallée 1987; Eggen 1998). The stars in Sco OB2 illuminate different portions of the same molecular cloud. Radio observations reveal the presence of the parent molecular cloud (Kutner et al. 1980; Vallée 1987). Few observational efforts have examined the reflection nebula and its illuminating star (Chaffee & White 1982; Cappa de Nicolau & Pöppel 1986; Vallée 1987; Federman et al. 1994). For this reason, the present study greatly improves upon our knowledge of PDRs around relatively cool stars.
The remainder of the paper is organized in the following manner. In §2 we discuss the optical and ultraviolet observations obtained for this study, as well as the consistency of our measurements with previous efforts. We describe the chemical and atomic analyses performed here and the results of these analyses as well as a comparison with our earlier results on HD 200775 (Paper I) in §3. We discuss in §4 the derived physical conditions and compare them with the physical conditions obtained through diagnostics at other wavelengths. Our conclusions are found in §5. An Appendix describes checks on the usefulness of NEWSIPS data for interstellar studies such as ours.
2 Observations and Data Reduction
2.1 Ground-based Observations
2.1.1 McDonald 2dcoudé Data
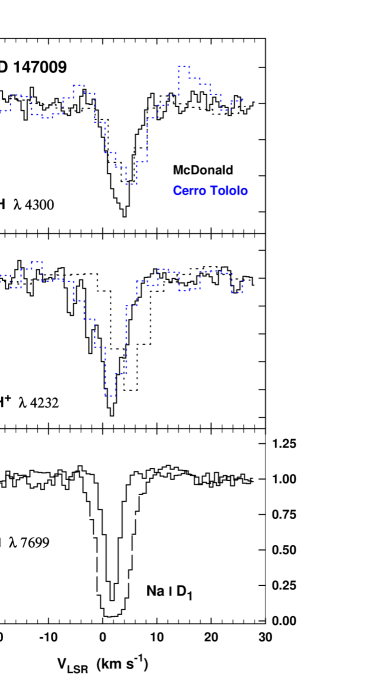
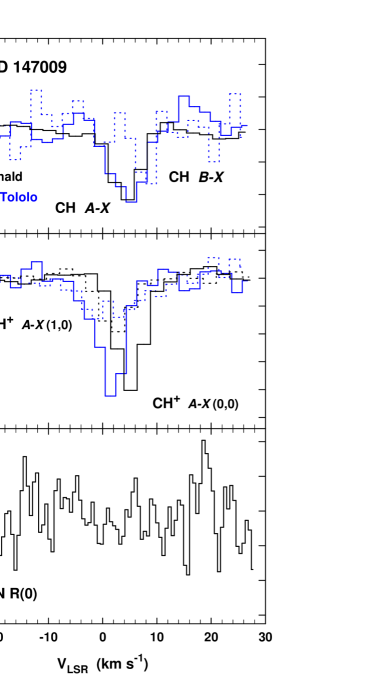
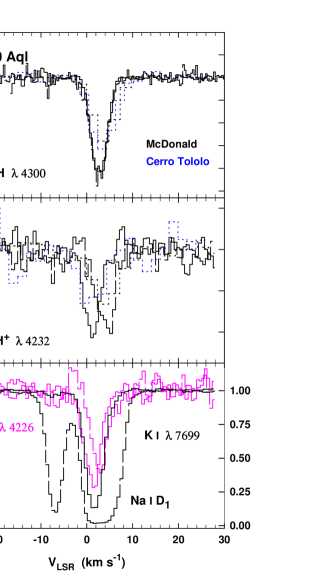
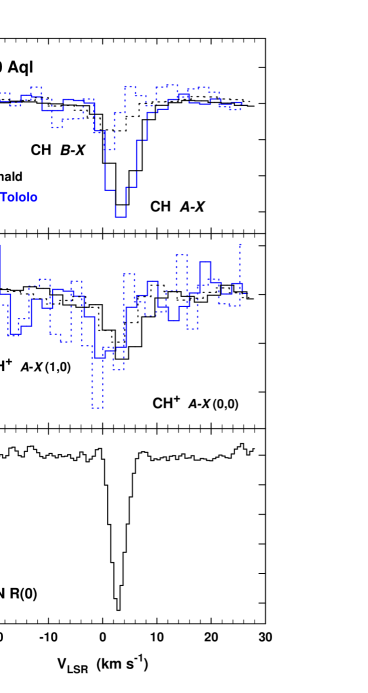
High-resolution echelle spectra of HD 37903, HD 147009 and 20 Aql were taken with the 2.7 m telescope of the University of Texas McDonald Observatory during June 1996, July 1997, and January 1998. Observations of 20 Aql were made since it allows for the comparison of our optical data with others and it is located behind a relatively isolated cloud for an additional test of the atomic analysis discussed below. The “2dcoudé” spectrograph (Tull et al. 1995) was used with 2 camera setups and a Tektronix charge coupled device (CCD) was the detector. One camera provided high spectral resolution with a resolving power at 4000 Å of R 180,000 (v 2 km s-1) and covered the wavelength range 3800 Å to 4400 Å. This high resolution mode yielded spectra containing 8 disjoint echelle orders approximately 15 Å wide, separated by approximately 65 Å. This setup provided spectra on the following interstellar species CH+, CH, CN, Ca II K, and Ca I. The second camera setting resulted in moderate spectral resolution with a resolving power at 7000 Å of R 52,000 (v 6 km s-1) and covered a wavelength range from 3600 Å to 9700 Å. The moderate resolution spectra consisted of 59 orders with an overlap of about 15 Å at the blue end. The inter-order separation increased with wavelength until there was approximately 150 Å between orders at near infrared wavelengths. In addition to observing the same species obtained from the high resolution spectra, we also obtained data on Ca II H, Na I D1, K I, and C2. The resolution was determined from the full width at half maximum (FWHM) of Thorium-Argon (Th-Ar) lines.
The data were reduced in a standard way utilizing the NOAO SUN/IRAF software (Revision 2.10.4). Dark, bias, and flat lamp exposures were taken each night to remove any instrumental effects due to the CCD detector. Comparison spectra were taken periodically throughout the night, typically every two hours. The average bias exposure was subtracted from all raw stellar, comparison (Th-Ar) and flat images. The scattered light was fitted by a low order polynomial, in both the dispersion direction and perpendicular to it for the multi-order observations, and removed. The pixel to pixel sensitivity was removed by dividing the normalized average flat into the stellar spectra. Next, the pixels perpendicular to the dispersion were summed in each order for each stellar and comparison lamp exposure. The extracted spectra were placed on an appropriate wavelength scale with the Th-Ar comparison spectra, and Doppler-corrected. The spectra were coadded and normalized to unity yielding a final spectrum with high signal to noise (based on the root-mean-square deviations in the continuum), typically 100:1.
2.1.2 McDonald Observations with the 6-Foot Camera
The 6-foot camera of the coudé spectrograph on the 2.7 m telescope was used to acquire high-resolution spectra of HD 147009 and 20 Aql. Observations, at R 200,000, of interstellar Na I D 5896, 5890, K I 7699, CH+ 4232, and Ca I 4226 were obtained in June 1990, Ca II K 3933 observations were made in June 1991 and CH 4300 observations were obtained in June 1992. The TI2 CCD with 15 pixels was used in all setups. Since no cross disperser was used, single orders of the echelle grating were detected in the vicinity of the line of interest. Appropriate interference filters were placed at the entrance slit to remove light from unwanted orders. Scattered light was found to be negligible since only one order was observed. Comparison spectra from a Th-Ar hollow cathode were taken throughout the night, while biases and flat fields were acquired each night. Dark frames were also obtained as a check on the amount of thermal noise from the cooled CCD. The slit was imaged onto 2.5 pixels for all setups, providing a resolution of 1.6 to 1.8 km s-1. The data were reduced in the standard manner described above. The resulting signal-to-noise ratios ranged from 30 to 200.
2.1.3 CTIO Observations
The stars, HD 147009 and 20 Aql, were observed with the Bench Mounted Echelle on the 1.5 m telescope in July 1991. The setup involved the 590 mm long camera, the Ritchey Chrétien grating from the 4-m telescope as a cross disperser, the TI1 800 800 pixel CCD, and a CuSO4 blocking filter. The entrance slit at the end of the 200 m fiber optic feed was set at 45 m, illuminating 2.6 pixels as determined by the full width at half maximum of Th-Ar lines. The resulting instrumental resolving power was about 65,000. The setup allowed measurement of lines between 3800 Å and 4400 Å. Bias frames and flat fields were acquired each night. The wavelength scale was determined from spectra of a Th-Ar hollow cathode taken throughout the night. The data were reduced in the standard manner described above. The extracted spectra had signal-to-noise ratios between 40 and 150.
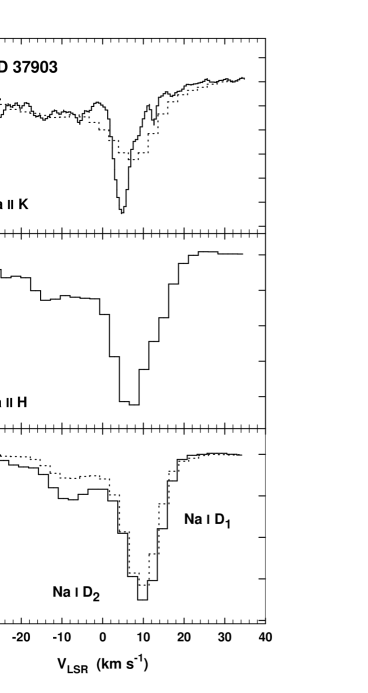
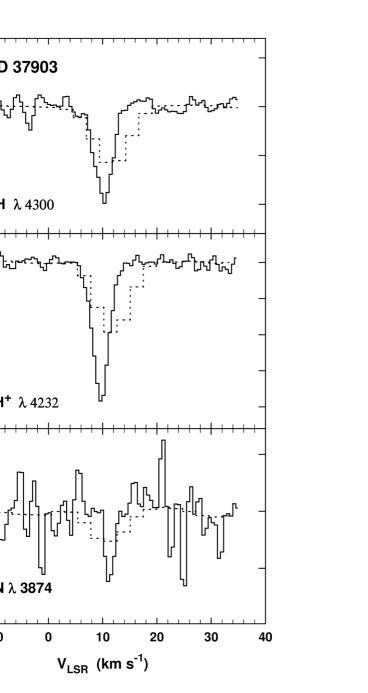
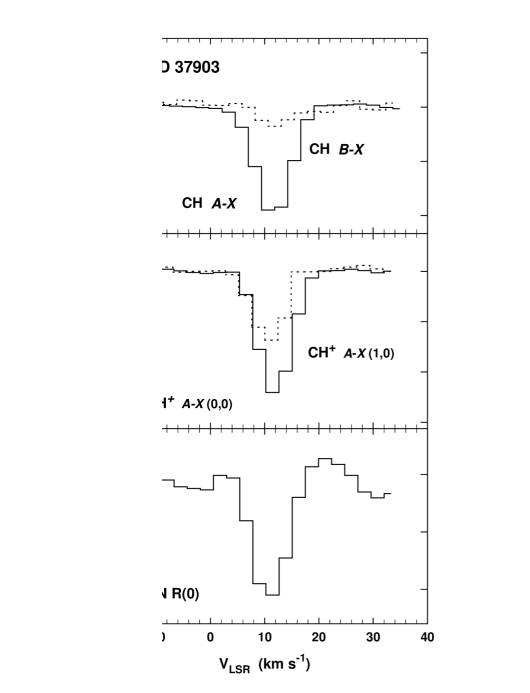
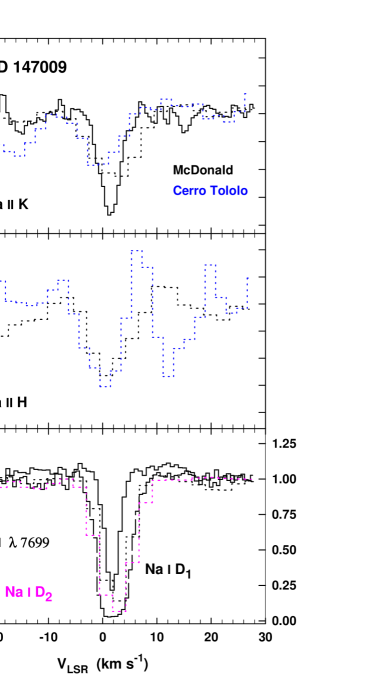
A sample of the rectified ground-based spectra for atoms and molecules toward HD 37903 are shown in Figures 1 3 and Figures 4 6 exhibit spectra of HD 147009. The equivalent width, , for a line was determined by a Gaussian fit; single Gaussians were adequate for all except the atomic species Na I and Ca II toward HD 37903. The measured equivalent widths and for the ground-based results toward HD 37903 and HD 147009 are shown in Tables 1 3. Where applicable, measurements taken from the literature are also shown. All ’s for a given line agree within measured uncertainties. The differences in are attributed to differences in spectral resolution and to systematic effects involving the wavelength solution. Where no interstellar absorption was detected, a 3- upper limit is given.
Each was converted into a column density utilizing curves of growth. The column densities for each species were consistent within the errors from individual measurements. The final column densities reported in Tables 4 and 5 for HD 37903 and HD 147009, respectively, are the weighted average of all detections reported in this work and the literature. For the C2 results reported in Table 3, the most restrictive upper limits for a rotational level were summed to get the total upper limit in column density.
The Doppler parameter (b-value) was set at 1 km s-1 for all lines except those of Ca II and CH+, where a b-value of 2.5 km s-1 was used (e.g., Welty, Morton, & Hobbs 1996). For Na I and K I absorption associated with the molecular material of the PDR, b-values of 2.0 km s-1 toward HD 37903 and 1.5 km s-1 toward HD 147009 were required by the atomic analysis discussed below. These -values are similar to other sightlines studied in Orion and the Sco OB2 association based on high resolution surveys of interstellar Na I D1 and K I (Welty, Hobbs, & Kulkarni 1994; Welty & Hobbs 2000). The change in -value affected only the column of Na I since the optical depth at line center is larger for Na I than for K I. This resulted in a 20 % decrease in (Na I) toward HD 37903 and a 10 % decrease toward HD 147009; no change in (K I) occurred with the change in -value.
Editor place figures 1-6 here. Editor place tables 1-5 here.
2.2 Ultraviolet Data
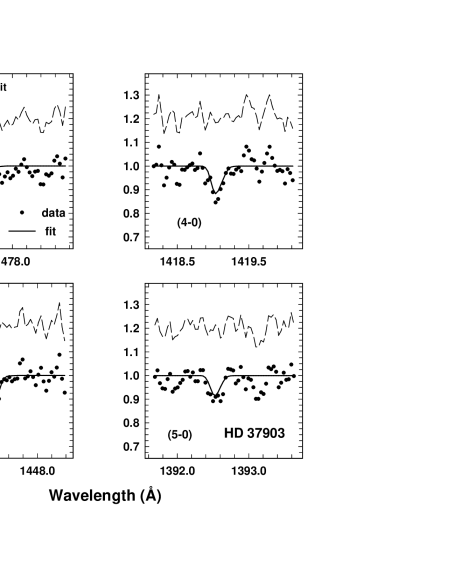
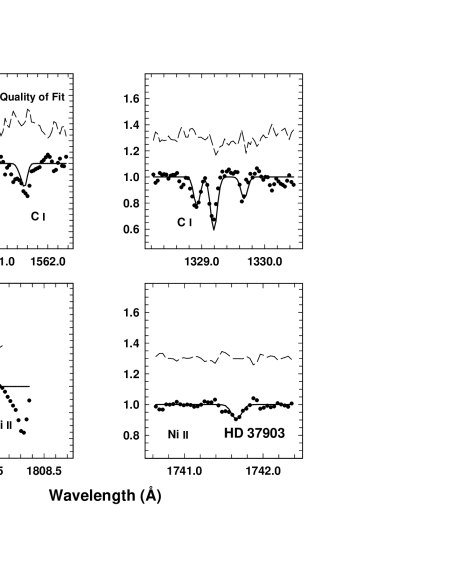
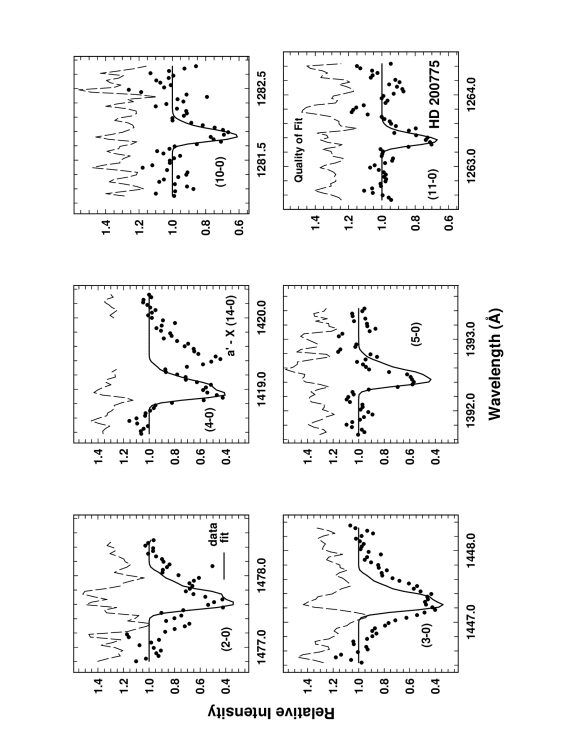
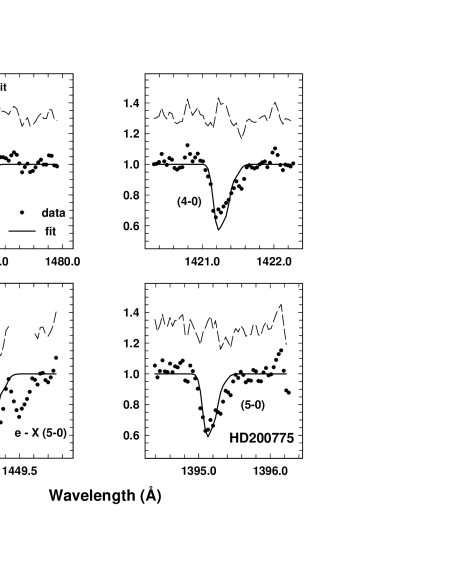
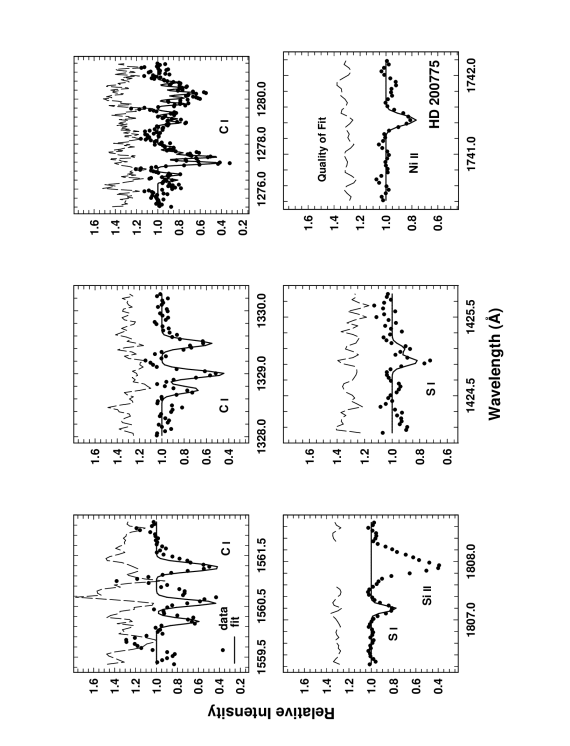
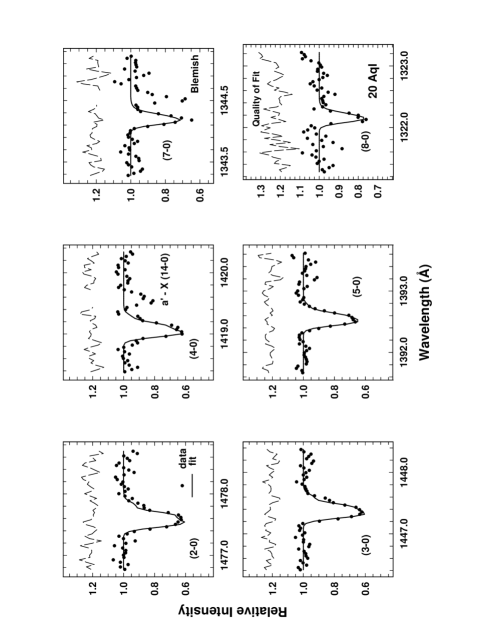
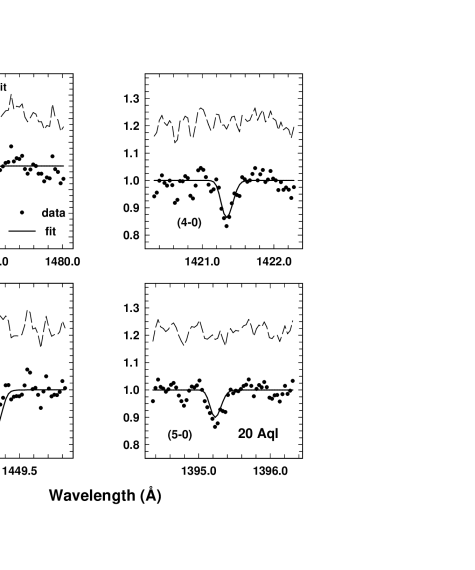
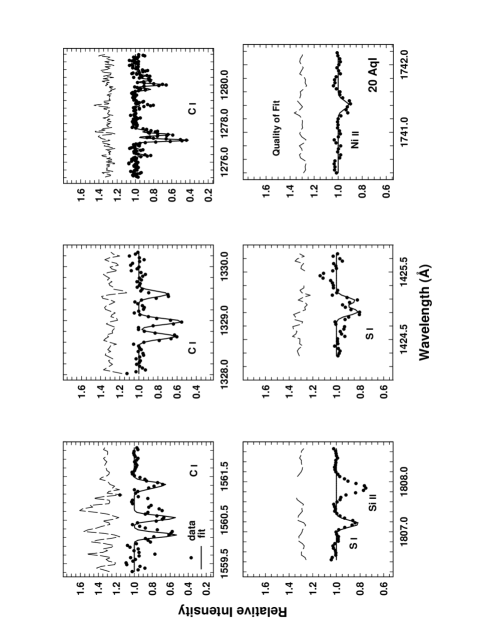
High-resolution ultraviolet spectra of HD 37903 and HD 200775 were available in the NEWSIPS archive. Table 6 lists the short-wavelength spectral images used in our study. The data were extracted with the set of programs in IUERDAF. For features that appeared in two orders, the cleaner looking spectrum was used for further analysis. Once extracted, the spectra were analyzed with the IRAF package in much the same way as described above for the ground-based measurements. Our focus was on absorption from 12CO, 13CO, C I, S I, and Ni II; sample spectra are shown in Figures 7 8. Since C I and S I represent minor constituents for their respective elements and have similar ionization potentials, the S I lines provided a check on the C I lines. On the other hand, Ni II is the dominant form of Ni in cloud envelopes; the synthesis of Ni II lines allowed for a comparison of -values which could elucidate the relative volumes occupied by dominant versus minor forms of an element.
Editor place table 6 here. Editor place figures 7 - 8 here.
The compilation of values appears in Table 7. Joseph et al. (1986) reported results for HD 37903 from the same spectra, but with an earlier version of the archiving process. The overall agreement between the two sets of is good; the NEWSIPS data used here produce spectra with higher signal to noise, as seen by the smaller uncertainties in . We performed several checks on ’s measured from NEWSIPS spectra; these are described in the Appendix. For the features considered in our study, we are confident that they have been measured reliably.
Profile synthesis was used to extract -values and column densities from the spectra. A chi-squared minimization procedure was adopted for the fits. The syntheses were based on the following set of oscillator stengths: Morton & Noreau (1994) for 12CO and 13CO; Morton (1991) and Zsargó, Federman, & Cardelli (1997) for C I; Federman & Cardelli (1995) for S I; and Morton (1991) and Zsargó & Federman (1998) for Ni II. The resulting column densities appear in Table 8. For the synthesis of the CO bands, the excitation temperature was set at 4 K (Lambert et al. 1994) and the -value was found to be somewhat less than 1 km s-1. For the atomic lines, the -value was determined by fits to several lines. There was no discernible difference in -value between neutral atoms and ions; we found km s-1. Since CO is expected to occupy a more restricted volume than even neutral atoms, a smaller -value for this species is appropriate.
Editor place tables 7 - 8 here.
3 Analysis and Results
3.1 Chemical Modeling
The chemistry of the simple molecular species, CH, C2, and CN, is relatively well understood (van Dishoeck & Black 1986; Federman et al. 1994) and relevant reaction rates are known or have been calculated. The purpose of obtaining data on several species of carbon-bearing molecules is to glean information about the physical conditions where these species reside. In particular, gas density (n), gas temperature (T), and the enhancement of the ultraviolet flux over the average interstellar value given by Draine (1978), Iuv, can be extracted from the measurements.
The analysis is based on steady-state chemical rate equations, which were successful in reproducing data for quiescent diffuse interstellar clouds (e.g., Federman et al. 1994) and the PDR toward HD 200775 (Paper I). In this analysis, the three quantities, n, T, and Iuv are inferred from observed column densities of CH, C2 and CN. However, only upper limits to the column densities are available for the C2 molecule toward HD 37903 and HD 147009 and for CN toward HD 147009, and as a consequence, the physical conditions in the foreground gas are not as well constrained as in other clouds (e.g., Paper I).
The rate equations used here are based on our earlier work. Federman and Huntress (1989) developed the chemistry for C2 in diffuse clouds, while Federman, Danks, and Lambert (1984) and Federman and Lambert (1988) did the same for CN. The incorporation of NH by Federman et al. (1994) into the rate equation for CN was the result of the discovery of NH in cloud envelopes (Meyer & Roth 1991). The respective equations for C2 and CN are:
| (1) |
| (2) |
In these equations, the reaction rate constants are denoted by ki (see Table 9); the abundance of species X relative to the proton abundance and the column density of species X are given by x(X) and N(X), respectively. The total proton density [n(H) + 2n(H2)] is given by n; the photodestruction rate of species X is G(X); and accounts for the conversion of C+ into CO (Federman et al. 1994). The rate constants for neutral-neutral reactions include a factor, (T/300)0.5, to account for the velocity term in the rate constant. The attenuation of radiation by dust is included in the photodissociation rate, G(X) = Go Iuvexp(-), where Go is the rate at the surface of the cloud, and is the optical depth at 1000 Å. A wavelength of 1000 Å for was chosen because it is in the middle of the range of wavelengths that leads to photodissociation of C2 and CN (912 Å 1200 Å) (Pouilly et al. 1983; Lavendy, Robbe, & Gandara 1987). The observed values of N(CH) and N(C2) were used in determining the predicted values of N(C2) and N(CN). The value of N(NH) was set to 0.041N(CH) since N(NH) scales with N(CH) (Meyer & Roth 1991; Federman et al. 1994).
Editor place table 9 here.
The following considerations apply to the parameters, , , and (X). From knowledge of the ratio of total to selective extinction, Rv = Av/E(B V), and the ultraviolet extinction curve (CCM89; Buss et al. 1994), information on can be derived. For the direction toward HD 37903, was set at 2, with an somewhat larger than average (Buss et al. 1994). Since the extinction curve for HD 147009 is similar to that seen for Oph, toward Oph (Federman et al. 1994) was scaled by ( ) to obtain the value for the sight line to HD 147009. For optical depths greater than 2, an additional term of the form, = [1 + 14( 2)/5]-1 (Federman et al. 1994), was added to account for the trends between the predicted and observed (C2) and caused by C+ being converted into CO (Federman & Huntress 1989). Fractional interstellar abundances of 1.4 10-4 (Sofia et al. 1997), 7.5 10-5 (Meyer, Cardelli, & Sofia 1997), and 3.2 10-4 (Meyer, Jura, & Cardelli 1998) for C+, N, and O, respectively, were adopted from measurements with the Hubble Space Telescope (HST). These abundances account for modest depletion of the elements onto interstellar grains in cloud envelopes. These values are somewhat different than the fractional abundances quoted in Paper I: while the O and N abundances differ by 10%, the C+ abundance is almost a factor-of-2 less. The lower fractional abundance of carbon requires a higher density for self-consistent chemical results, mainly because C2 is formed through reactions involving C+ and CH.
The column densities derived from the rate equations compare favorably with the observed columns for C2 and CN. The predicted column densities and inferred physical conditions are found in Table 10. The Table also displays predictions for the molecular columns toward HD 200775 based on the atomic abundances adopted here; the greatest effect was on the extracted density. Changing the temperature did not significantly alter the predicted column densities in the chemical analysis above. The temperature used in this analysis was 40 K, the average value obtained from the C I excitation analysis ( 50 K) and the temperature determined from CO fractionation ( 30 K). The average of these two temperatures is reasonable in light of the fact that C I is more extended than CO in the cloud. The value of Iuv/n is the most important parameter in PDRs (HT99); it controls the chemistry and structure. When n was increased in our model, Iuv had to be increased in order to obtain the best match to the observed column densities. The ratio Iuv/n remained unchanged (see eqn. 1 and 2).
Editor place table 10 here.
3.2 Atomic Analysis
In this analysis, only the columns of Na I and K I associated with the molecular material (i.e., at the same velocity as the molecules CH, CN, and C2) are used. The atoms Na and K are predominantly singly ionized in interstellar space. Through ionization balance, we can analyze the neutral columns with the equation,
| (3) |
In this equation, A(X) is the elemental abundance, Ntot(H) is the total proton column density, N(H) + 2N(H2), (X) is the radiative recombination rate constant (Péquinot & Aldrovandi 1986), G(X) is the photoionization rate for species X, and ne is the electron density. A(X) includes depletion onto grains at about 25% for alkali elements (Phillips, Pettini & Gondhalekar 1984) and incorporates the conversion of C+ into CO in the molecular material (as opposed to in the chemical analysis which is an average for the total amount of neutral material). This conversion is a significant effect only when the fraction of molecular gas is 50% of the neutral gas. The form of is + (1 ), where is the H2 fraction (2(H2)/(H)) and is described in §3.1. Many of the uncertain factors (e.g., ne and depletion) in the above equation can be eliminated by taking the ratio of N(Na I) to N(K I). This ratio can be written as
| (4) |
The appropriate value for A(Na)/A(K) is 16 and (Na I)/(K I) is 1.05. The latter ratio was incorrectly given in Paper I; the change results in a 10% increase in the predicted ratio of Na I and K I columns. The predicted ratio mainly depends on the photoionization rates. The photoionization rates for Na I and K I at the cloud surface were determined from the measured ionization cross sections of Hudson & Carter (1967a) and of Hudson & Carter (1965, 1967b), Marr & Creek (1968) and Sandner et al. (1981), respectively.
To complete the atomic analysis, details about the extinction curve are needed. The main difference for the two sight lines studied here involves the effect of extinction from interstellar grains. The pair method (WBS84) was used to derive the extinction curve for the central star in the nebula vdB 102, HD 147009. Extinction curves for two other stars, HD 37023 and HD 37903, were computed for comparison with extinction curves derived by Fitzpatrick & Massa (1990 - hereafter FM90). Stellar spectra of HD 31726, HD 37023, HD 37903, HD 55857, HD 64802, HD 147009 and Aql were obtained from the Archive; the filenames are listed in Table 6. The unreddened standard stars used in FM90 are used in this work, with the exception of Aql (Witt, Bohlin, & Stecher 1981), in order to obtain the most consistent results. The extinction curves for HD 37023 and HD 37903 derived by FM90 are similar to those derived by us, demonstrating that the extinction curve for HD 147009 derived here is reliable.
The extinction curves for HD 37903 and HD 147009 were found to be anomalous when compared to the one representing typical Galactic extinction, that for Per (Savage & Mathis 1979). For this analysis, the extinction curve for Per was scaled to the same reddening parameter of the observed star. Figure 9 displays the resulting extinction curves. Since the photoionization rates were determined for Per (Paper I), the difference between extinction toward the reddened line of sight compared to the average is used to derive an attenuated photoionization rate for the reddened star. Changes in extinction introduce a multiplicative factor to the photoionization rates of the form 10β. For the wavelengths where the curve for Per shows more (less) extinction, the exponent is positive (negative). Since the two extinction curves can intersect, for some wavelength intervals the extinction can be enhanced and diminished for others. The total rate is the sum of the rates for each wavelength interval.
Editor place figure 9 here.
3.3 Atomic Results
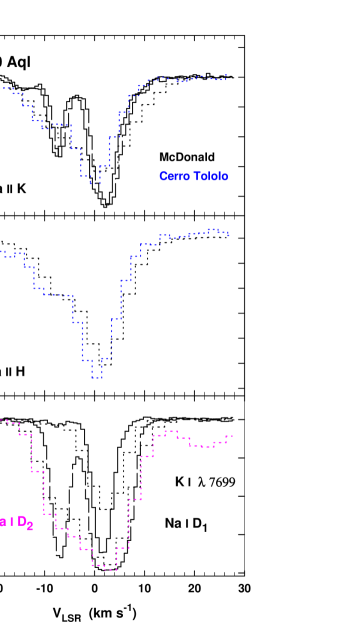
The atomic spectra for Ca II H and K and Na I D exhibit 6 velocity components along the line of sight toward HD 37903 (see Figure 1). There is no molecular absorption seen in 5 of them. The atomic gas not associated with molecular absorption is attributed to Orion’s Cloak. Orion’s Cloak is a rapidly (35 v 120 km s-1) expanding shell of gas centered on the Orion OB1 association (Cowie, Songaila & York 1979). While the 5 velocity components toward HD 37903 have lower velocities ( 30 km s-1) than is seen in Orion’s Cloak, this velocity structure is observed toward many other stars in Orion (Cowie et al. 1979; Welty et al. 1994; Welty et al. 1996) showing the high velocity gas of Orion’s Cloak. Our atomic analysis involves only absorption associated with the molecular material in the nebula.
The atomic observations yield information on the photoionization rates present in the gas (see eqn. 4) because eqn. 4 is not dependent on the physical conditions. Toward Per, an observed ratio Na I/K I of 100 6 was obtained. For the predicted ratio a refined analysis was performed. The difference in grain attenuation between 2400 and 2900 Å ( = 0.2) was taken into account. This resulted in a predicted ratio of 67. Toward HD 200775, the observed ratio is 54 9, which is in excellent agreement with the predicted ratio of 54 when the effects of the extinction curve are applied. (Note that the sum of all velocity components of Na I and K I are used for this sight line, see §4.4.)
The observed column densities were (1.1 0.2) 1013 cm-2 and 1.1 1011 cm-2 for Na I and K I toward HD 37903, giving an observed ratio of 100 18. The inferred Na I and K I photoionization rates are 1.2 10-11 s-1 and 4.4 10-11 s-1, which yield a predicted ratio of 62. For the line of sight to HD 147009, the observed column densities of (1.5 0.3) 1013 cm-2 and (2.3 0.1) 1011 cm-2 for Na I and K I, respectively, were determined. These columns produce an observed ratio of 65 13. The Na I and K I photoionization rates for this gas are 2.9 10-10 s-1 and 9.7 10-10 s-1, respectively. These values lead to a predicted ratio of 56. As expected the correspondence between observed and predicted (Na I)/(K I) ratios is good.
Editor place table 11 here.
Another useful way to study the observed atomic abundances is to compare, for a specific atom, the column density obtained toward the program stars to the column density obtained toward Per. In this way we check for potential differences in depletion onto grains and ne (see eqn. 3). Curves of growth with b = 1.5 km s-1 for the weak Na I doublet at 3302 Å (Crutcher 1975) as well as the strong D-lines at 5889, 5895 (Hobbs 1974a, 1974b; Welty et al. 1994; Andersson, private communication) and the weak K I doublet at 4044, 4047 (Knauth et al. 2000) yielded weighted average column densities for Na I of (7.3 0.3) 1013 cm-2 and (7.3 0.3) 1011 cm-2 for K I toward Per. Our precise column density measurements of K I 4044, 4047 yield similar results to the column density obtained from the K I 7699 line. The photoionization rates of Na I and K I toward Per are 4.5 10-12 s-1 and 1.8 10-11 s-1 (Paper I). For this analysis we require the total proton density toward each star. The proton density is (1.6 0.3) 1021 cm-2 toward Per (Bohlin, Savage, & Drake 1978) and is (3.6 0.7) 1021 cm-2 toward HD 37903 (Buss et al. 1994). Toward HD 147009, the total proton column density was determined from several sources. From radio observations of CH, the column density of H2 was found to be 2.5 1020 cm-2 (Vallée 1987) using the relationship derived by Federman (1982) and Danks, Federman, & Lambert (1984). A value of N(H I) = 1.1 1021 cm-2 was determined from the 21-cm results of Cappa de Nicolau & Pöppel (1986), indicating Ntot(H) = 1.6 1021 cm-2. Also from 21-cm observations, de Geus & Burton (1991) derived N(H I) = 1.8 1021 cm-2, which yields Ntot(H) = 2.3 1021 cm-2. The average proton column density toward HD 147009 is therefore (1.9 0.4) 1021 cm-2. In our analysis, we adopted a 20 % error in (H) for all stars except HD 200775 where the observed precision was higher.
Most of the total proton density is assumed to lie in front of HD 147009, since most of (H I) resides in one component (Cappa de Nicolau & Pöppel 1986) and the star is at high galactic latitude, = 20.894 (GZL89). The relationship of Bohlin et al. (1978), (H)/( ) = 5.8 1021 atoms cm-2 mag-1, supports this assumption. This relationship yields (H) = 2.2 1021 cm-2, which is similar to the column density determined above. Therefore it is reasonable to assume all of the neutral hydrogen resides in front of the star.
Estimates for gas density, temperature and UV field strength are needed to complete this analysis. The values of n, T, and Iuv toward Per (Federman et al. 1994) were re-derived with the new values for the fractional abundances of C+, N, and O, resulting in 1200 cm-3, 40 K, and 1. For the gas toward HD 37903 and HD 147009, the adopted values of n and T are from the chemical analysis above for Iuv = 1 (see Table 10). Here we set ne = n (C+), since the electrons mostly come from ionized carbon. The predicted ratios toward HD 200775 are 0.05 0.01 and 0.06 0.01 for Na I and K I, respectively. The observed ratios are 0.08 0.01 and 0.15 0.02 for Na I and K I, respectively. (These ratios are based on our refined analysis and differ somewhat from the ratios in Paper I.) For the case of HD 37903, the effect of needed to be included since the fraction of molecular gas is 50 %. This resulted in a predicted ratio N(Na I)/N(Na I) of 0.23 0.06 and 0.21 0.06 for K I. The observed ratios are 0.15 0.03 for Na I and 0.15 0.01 for K I. As for the PDR toward HD 147009, the analysis gives a ratio of 0.01 0.01 for both ratios. The observed column density ratios are 0.21 0.04 for Na I and 0.32 0.02 for K I.
The results of our analysis are summarized in Table 11. It can be seen from the ratios of Na I and especially K I that a modest change in ne and/or depletion onto grains is needed to bring the predictions and observations for the foreground PDR of NGC 7023 into agreement. This change from Paper I is caused by the decrease in (C+). Since the observed and predicted results for Na I and K I toward HD 37903 with respect to Per agree within the errors, our estimates for and depletion for the foreground material toward HD 37903 are reasonable. The situation is more extreme for the foreground PDR of vdB 102. A factor-of-20 increase in ne is needed to bring the predictions into agreement with the observations. While the flat FUV extinction curve for HD 147009 allows more radiation to permeate the nebula, ne is limited by the elemental abundance of carbon. Because HD 147009 is an A0 V star, enhanced ionization in an H II region is not expected, unless the enhanced ionization arises from the combined effects of other, earlier type, stars in Sco OB2.
3.4 UV Results
The data on C I and CO provide additional constraints on the physical conditions for the foreground PDR. The relative populations of fine structure levels in the electronic ground state of C I arises from a combination of collisional excitation and de-excitation, radiative decay, and in enhanced radiation fields, UV pumping. Analysis of the observed distribution via statistical equilibrium yields pressure ( ) and sometimes . Here, is the density of collision partners, (H) + (H2). If the kinetic temperature is known from another diagnostic, can be obtained and compared with [(H) + 2 (H2)] inferred from the chemistry. The ratio of (12CO)/(13CO) is affected by chemical fractionation. When the gas is cold ( 40 K) and is permeated by a strong UV radiation field so that the abundance of C+ is high, the ratio of columns is less than the ratio of ambient 12C/13C (about 60) because 13CO has the lower zero-point energy (cf. Watson, Anicich, & Huntress 1976). If the gas in not especially cold, but still affected by UV photons, selective isotopic photodissociation enhances (12CO) relative to (13CO) (e.g., Bally & Langer 1982; van Dishoeck & Black 1988). The enhancement is the result of 12CO self-shielding itself from photodissociation because its lines are more optically thick.
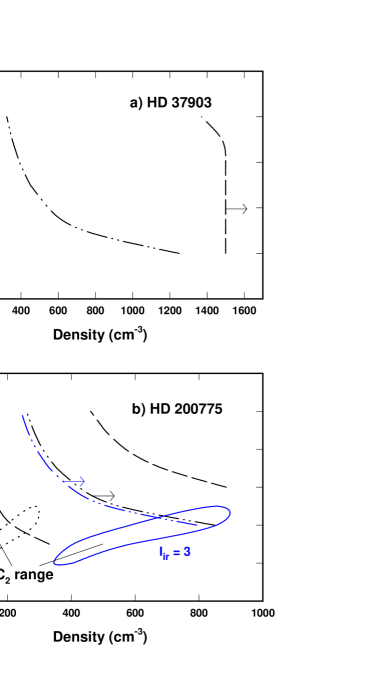
The analysis of C I excitation described by Lambert et al. (1994) forms the basis of our results. In particular, their collisional rate constants and radiative rates are adopted here. The fractional abundances of collisional partners are based on the observations of Buss et al. (1994) - see Table 12, with the added assumption that 10% of the gas is He. The analysis also assumes that absorption from each fine structure level, J, arises from the same parcel of gas. Figure 10 shows the results of our calculations. Here we plot the density and temperature consistent with the observed column density ratios, (J 1)/(J 0) dashed curves and (J 2)/(J 0) dash-dotted curves. The upper and lower bounds are based on 1- errors in column density. For HD 37903, results for of 3 are indistinguishable from those with of 1. The strongest constraint comes from (2)/(0): lies between 300 and 500 cm-3 and about 50 K. Based on the observed columns of H and H2, the inferred value for is 400 to 700 cm-3. As for the foreground PDR toward HD 200775, the lower limits from (2)/(0) and the upper limits from (1)/(0) indicate that is about 700 cm-3 (or is 850 cm-3) for between 40 and 60 K. Analysis of C2 excitation from the data in Paper I is consistent with the C I results if is 3. For C2, optical pumping to an excited electronic state involves absorption of infrared radiation; hence the use of . [Again, the curves for of 3 are essentially those for of 1, except for the lower range allowed by (2)/(0).]
Editor place table 12 here. Editor place figure 10 here.
The inferred values for agree with the chemical results for the two foreground PDRs. The gas containing C I toward HD 37903 appears to have a density most consistent with the chemical results for 1. Since C I may occupy a larger volume of material than the molecules C2 and CN, the inferred average density from C I excitation could be smaller by about a factor of 2 compared to the density in CN-rich gas. This seems to be the case for Oph (Lambert et al. 1994). In other words, the chemical results for of 1 3 are still consistent with the results from C I. The situation is different for the gas toward HD 200775. Here, the C I results are most consistent with the chemical results for of 3. Since this comparison also applies to the results for C2 with of 3, the strengths of the UV and IR fields seem to scale together for the foreground PDR.
The observations of HD 200775 reveal that (12CO)/(13CO) is about 20. An enhancement in (13CO) arises when the gas is cold, yet contains an appreciable fraction of C+. Lambert et al. (1994) described the amount of fractionation in terms of the quantity , the column density ratio divided by the ambient 12C/13C ratio. When the ratio of columns is smaller than the ambient ratio, equals exp(-35/T). Since the gas toward HD 200775 has of 0.33, the CO observations indicate a temperature of 30 35 K. The need for C+ suggests that the UV radiation field is somewhat higher than in a typical diffuse cloud, consistent with the results described above. Since 13CO was not detected toward HD 37903, no meaningful analysis is possible.
4 Discussion
4.1 Structure of PDRs
Since Iuv/n determines the structure of PDR’s (HT99), we can estimate the fraction of foreground material in the PDR. We use eqn. 7 from Hollenbach & Tielens (1999), which approximately relates the formation rate of H2 to the photodissociation rate, for (H) 1021 cm-2. Due to its approximate nature, we assume that the use of this equation for lines of sight with (H) of a few times 1021 cm-2 to be valid as well. This steady state expression is used to reproduce the column of H2, assuming the observed H2 is completely within the PDR:
| (5) |
In this equation, No is the column density at which self-shielding becomes important (No = 1 1014 cm-2), is the formation rate of H2 on grains ( = 3 10-17 cm3 s-1), and Idiss(0) is the photodissociation rate (4 10-11Iuv s-1). Table 12 shows that the predicted values for Iuv are 30 to 60 times greater than the values derived from the chemical analysis. The determined from the chemistry must be the same as that determined from the above equation for H2; these results suggest that only a small fraction ( 3%) of the foreground material is actually associated with the PDR in front of the star.
The linear extent of the foreground PDR (Ltr) can be compared to that in the background molecular cloud. We adopted the expression for Ltr of Federman, Glassgold, & Kwan (1979):
| (6) |
For the foreground PDR of NGC 2023, this equation yields an extent of 0.002 0.007 pc for densities of 500 1500 cm-3 and respective values for Iuv of 1 3. For the background cloud with n of 105 cm-3 and Iuv of 104 (Rouan et al. 1997), the extent is 0.0086 pc. For NGC 7023, the range in extent is 0.008 0.03 pc when n of 300 900 cm-3 and respective Iuv of 1 3 are used for the foreground cloud. Utilizing the density (104 cm-3) and Iuv of 103 from Rogers, Heyer & Dewdney (1995) for the background cloud indicates a length scale of 0.086 pc. The extent of the PDR into the molecular cloud behind the stars is comparable to its extent in the lower density foreground gas. For vdB 102 information is only available for the foreground gas; an extent of 0.004 0.01 pc is found from densities and Iuv of 400 1200 cm-3 and 1 3, respectively.
From the column of neutral hydrogen and the density of the cloud, one can estimate the size of the neutral cloud in front of the star, assuming all the hydrogen is associated with the cloud. Toward HD 37903, a neutral cloud size of 0.8 2.3 pc is derived. A cloud size of 0.5 1.5 pc toward HD 147009 and toward HD 200775 a cloud size of 0.8 2.5 pc are obtained. These simple calculations show that the PDR does indeed reside in a small fraction ( 1 %) of the neutral cloud.
4.2 NGC 2023
In order to arrive at a consistent model of PDR’s associated with these reflection nebulae, it is necessary to compare the results obtained here to the physical conditions inferred from diagnostics at other wavelengths of the background molecular cloud. As noted in §1.1, there have been many studies of NGC 2023 whose focus was the molecular cloud behind HD 37903. Here, we highlight those studies that relate to our measurements.
Infrared H2 observations (Martini et al. 1999 and references therein) of this nebula show that there is a neutral shell of molecular material 0.13 0.20 pc from the star. However, this neutral shell is not seen in the H I data. The H I emission is observed to be centered on HD 37903 (Lebrón & Rodríguez 1997). Clumps of material have been detected in the nebula on less than parsec size scales (Martini et al. 1999). This implies that there are two components within the nebula. Steiman-Cameron et al. (1997) determined that the densities for the low and high density components are 750 cm-3 and 105 cm-3, respectively, with a temperature range of 250 K 750 K and a radiation field of 1.5 104 times the average interstellar radiation field. For the gas directly behind HD 37903, Wyrowski et al. (1997) found a density of 3 104 cm-3, a radiation field 500 times the average interstellar radiation field (ISRF) and a temperature of 125 K.
Martini et al. (1999) measured the near-infrared emission from H2 in two regions, 60′′ south and 160′′ north of HD 37903. Their results show that these regions are of relatively high density, n 105 106 cm-3, with a ratio of radiation field to density Iuv/n 0.1 0.01 cm3. These measurements are in agreement with other studies which find high density clumps (105 107 cm-3) in a slightly less dense interclump medium ( 104 105 cm-3) with a enhancement of the UV radiation field over the average ISRF of 103 104 for NGC 2023 (Martini et al. 1999, Takami et al. 2000).
Our chemical analysis reveals that the radiation field is weaker in the foreground material, Iuv 1 3, than the values determined in previous work for the molecular cloud behind the star (Field et al. 1994, 1998; Fuente et al. 1995; Steiman-Cameron et al. 1997; Wyrowski et al. 1997). The density of the foreground gas has a range of a few times 102 to 103 cm-3, a factor of 10 to 1000 less dense than the gas in the molecular cloud behind HD 37903. The temperature of the foreground gas is a factor-of-2 less than the material behind the star. These observations of the foreground material indicating lower densities support the idea that HD 37903 formed near the edge of the molecular cloud and rapidly dispersed the material at the edge of the cloud. NGC 2023 could be a face-on example of star formation by the blister model (Zuckerman 1973; Israel 1978).
Burton et al. (1998) indicate clump densities of 104 cm-3 and a far ultraviolet radiation field about 103 times the ambient interstellar value at a projected distance of 0.18 pc. Buss et al. (1994) measured a stellar flux at 1050 Å of 1.5 10-11 erg cm-2 s-1 Å-1. Using an average interstellar flux of 2.65 10-6 ergs cm-2 s-1 Å-1, = 2.9, and a distance to the star of 470 pc (Perryman et al. 1997), we find a distance to the foreground gas of 2.5 4.5 pc for our values of Iuv between 1 and 3. Therefore the radiation field at a distance of 0.1 0.2 pc from the star would be 500 2000 times the average radiation field, which is consistent with Burton et al.’s (1998) value of Iuv 1000 (usually denoted by Go) at a distance 0.18 pc from the star.
From maps of CN = 1 0 (113.5 GHz) and HCN = 1 0 (88.6 GHz) emission, Fuente et al. (1995) detected an enhanced amount of CN in the molecular shell in NGC 2023. The CN/HCN ratio inside the H2 shell was found to be 25 times larger than outside. Outside the shell this ratio is close to the interstellar value for molecular clouds ( 2). HCN photodissociation plays an important role because it produces CN and because the photodissociation rate of HCN is greater than that of CN. While we previously found an enhancement in the abundance of CN toward HD 200775 (Paper I), consistent with radio observations of NGC 7023 (Fuente et al. 1993), our chemical results for the foreground PDR of NGC 2023 show no such enhancement. Most of the CN is in the envelope of the molecular cloud, not in the foreground PDR.
4.3 vdB 102
The chemical analysis for HD 147009 matches well with the observed upper limits for C2 and CN, but the physical conditions derived in our chemical analysis could not be constrained well. Unfortunately, little is known about the physical conditions in this nebula. Kutner et al. (1980) mapped CO emission in reflection nebulae and determined that the peak CO emission is offset, about 3.3 arcmin to the north-east, from the star. From radio observations of CH in the cloud, a column density N(CH) = (1.0 0.3) 1013 cm-2 was obtained (Vallée 1987). This is comparable to the column density obtained from our measurements, N(CH) = (1.5 0.1) 1013 cm-2. The peak CH emission reported by Vallée is at the same offset as Kutner’s CO observations. Since there is a proportional relationship between N(CH) and N(H2) (Federman 1982; Danks et al. 1984; Mattila 1986), Vallée inferred that N(H2) = 2.5 1020 cm-2. Vallée used a length of 0.13 pc to convert column density to space density. This length was determined from the fact that the CH abundance extends over 0.3 magnitudes in blue absorption, . There could easily be a factor-of-2 error in this estimate. With this length, Vallée obtained n(H2) = 600 cm-3 and then converted n(H2) into a total proton density of n = 1300 cm-3 with the relation n = 2.2 n(H2), assuming 10% of the gas is He. Vallée’s density, which is similar to ours for Iuv = 3, may not represent the molecular cloud behind the star as he reported, since his CH abundance is comparable to ours. The molecular material may in fact reside in front of HD 147009. Moreover, this density is similar to densities found in the diffuse component in the reflection nebulae NGC 2023 (this work) and NGC 7023 (Paper I and this work).
4.4 Optical Results for Three Nebulae
The reflection nebulae NGC 2023 and NGC 7023 are relatively bright extended objects, located at the edges of their respective molecular clouds. For these reasons they have been extensively studied at a variety of wavelengths. The two nebulae have been shown to have clumpy, filamentary structure from infrared observations. The central stars, HD 37903 and HD 200775, of these nebulae have similar spectral types, B1.5 V and B3e V, and similar distances of 470 pc and 430 pc (Perryman et al. 1997), respectively. The peak infrared emission is offset from the stars in both nebulae. As for vdB 102, the illuminating source, HD 147009, is of later spectral type (A0 V) and is closer to the Sun at a distance of 160 pc (Perryman et al. 1997). The extent of filamentary structure is unknown.
The physical conditions obtained from optical spectra toward the illuminating stars in the reflection nebulae NGC 2023 and vdB 102 are similar to those obtained from an earlier study of NGC 7023 (Paper I) and updated here. The physical conditions n, , and Iuv inferred for NGC 7023 are 300 900 cm-3, 40 K, and 1 3, respectively, once the effects of a lower (C+) are included (Table 10). These physical conditions are similar to those obtained from grain scattering observations of NGC 7023 (Walker et al. 1980; Witt & Cottrell 1980a, 1980b; Witt et al. 1982). The physical conditions found toward NGC 2023 are 500 1500 cm-3, 40 K, and 1 3 and toward vdB 102 400 1200 cm-3, 40 K, and 1 3, for , , and , respectively. Therefore, the material in front of the stars in the reflection nebulae NGC 2023, vdB 102, and NGC 7023 is relatively diffuse.
In Paper I, an enhancement in the CN abundance over that described in eqn. 2 was (and is still needed) to explain the observed CN abundance in the foreground PDR of NGC 7023. This enhancement of CN in the foreground material of NGC 7023 is the result of a contribution from dark cloud chemistry (Paper I) HCN CN through photodissociation. If we really are seeing an effect of dark cloud chemistry from the molecular cloud behind the star, the foreground PDR may be closer to the star than our estimates suggest, even for an enhancement by a factor-of-3 in the radiation field. This enhancement is not detected toward either HD 37903 or HD 147009, unless the amount of C2 in the gas is much less than our current upper limit. This could be a consequence of the different distances between each star and its foreground gas.
In the case of NGC 7023, an hourglass shaped cavity has been detected (Lemaire et al. 1996; Fuente et al. 1998) around the star. CO radio maps reveal (Gerin et al. 1998) that the 13CO emission profiles are relatively smooth and centered at 2.5 km s-1, while the 12CO profiles indicate more complicated structure. This structure shows a gradual shift in the velocity of the gas from 2.5 km s-1 to 1.5 km s-1, which is the velocity of the foreground molecular material reported in Paper I. This suggests that there should be a diffuse 12CO component in the cavity or the foreground material. We associate this diffuse component with the CO seen in UV absorption. Lemaire et al. (1999) report redshifted H I with respect to H2 in the molecular cloud behind the star. This trend is also detected in atomic absorption (Paper I) which is blueshifted compared to the foreground molecular material. This is consistent with an expanding PDR around the star (Gerin et al. 1998; Fuente et al. 1998).
The analysis of atomic data provides insight into the processes taking place in the foreground gas. Using the extinction curve for the line of sight in our model, the observed ratio of Na I to K I toward NGC 7023 and vdB 102 matched the predicted ratio. In the cases for Per and NGC 2023, the observed ratio was about twice the predicted value. Adjustments to the photoionization rates would bring the predicted ratios into better agreement with observations. In particular, a finer grid for computing the differences in extinction relative to the extinction for Per may be more appropriate; we only considered average differences over wavelength regions where the curves intersected. In the comparison of the column density of each species toward the reflection nebulae and Per, a small change in or an extra source of depletion is needed toward NGC 7023 to match the observed and predicted results. Toward HD 147009, a fairly substantial modification is required. A significant increase in ne, possibly provided by protons in diffuse ionized gas created by earlier type stars in Sco OB2, is needed to account for the differences found between the nebula vdB 102 and gas toward Per.
The analysis of ultraviolet data provides additional pieces to the picture for the gas associated with NGC 2023 and NGC 7023. It appears that the foreground PDR in NGC 7023 is more homogeneous (because C I excitation, C2 excitation, CO fractionation, and chemical analysis yield very similar physical conditions) and is permeated by a slightly stronger radiation field compared to that for NGC 2023.
5 Conclusions
We presented the first chemical results for foreground material associated with the PDRs of NGC 2023 and vdB 102. The foreground material in NGC 2023 is more diffuse than the molecular cloud behind HD 37903 and is subjected to a less intense radiation field. The results are similar to what we found for NGC 7023 (Paper I). As for vdB 102, our analyses are the most comprehensive to date and will be the basis for other studies of nebulae illuminated by A-type stars.
Future studies should incorporate details that extend the treatment presented here. The effects of a clumpy distribution of material and a more extensive set of chemical reactions in the framework of a time-dependent model need to be considered. These models have to include the “anomalous” extinction law found for both stars in this work (see also FM90; WBS84). The consequences of NGC 2023 and vdB 102 being located in active star-forming regions is another area for future analysis. Other absorption measurements of species detected at ultraviolet wavelengths, such as H2, are needed to place more stringent constraints on physical conditions. Observations with the Far Ultraviolet Spectroscopic Explorer will soon be obtained. This combination of visible and UV data, on the one hand, and more sophisticated modeling efforts, on the other, will provide a clearer description of the interaction between a star’s radiation field and the surrounding molecular cloud.
References
- (1) Allen, M. M. 1994, ApJ, 424, 754
- (2) Bally, J., & Langer, W. D. 1982, ApJ, 255, 143
- (3) Bertoldi, F., & Draine, B. T. 1996, ApJ, 458, 222
- (4) Bohlin, R. C., Savage, B. D., & Drake, J. F. 1978, ApJ, 224, 132
- (5) Burton, M. G., Howe, J. E., Geballe, T. R., & Brand, P. W. J. L. 1998, PASA, 115, 194
- (6) Buss, R. H. Jr., Allen, M., McCandliss, S., Kruk, J., Liu, J., & Brown, T. 1994, ApJ, 430, 630
- (7) Cappa de Nicolau, C. E., & Pöppel, W. G. L. 1986, A&A, 164, 274
- (8) Cardelli, J. A., Clayton, G. C., & Mathis, J. S. 1989, ApJ, 345, 245 (CCM89)
- (9) Chaffee, F. H. Jr., & White, R. E. 1982, ApJ, 50, 169
- (10) Cowie, L. L., Songaila, A., & York, D. G. 1979, ApJ, 230, 469
- (11) Crutcher, R. M. 1975, ApJ, 202, 634
- (12) Danks, A. C., Federman, S. R., & Lambert, D. L. 1984, A&A, 130, 62
- (13) de Geus, E. J., & Burton, W. B. 1991, A&A, 246, 559
- (14) de Geus, E. J., de Zeeuw, P. T., & Lub, J. 1989, A&A, 216, 44 (GZL89)
- (15) Draine, B. T. 1978, ApJ, 36, 595
- (16) Draine, B. T., & Bertoldi, F. 1996, ApJ, 468, 269
- (17) Draine, B. T., & Bertoldi, F. 1999, ESASP, 427, 783
- (18) Eggen, O. J. 1998, AJ, 1314
- (19) Federman, S. R. 1982, ApJ, 257, 175
- (20) Federman, S. R., & Cardelli, J. A. 1995, ApJ, 452, 269
- (21) Federman, S. R., Danks, A. C., & Lambert, D. L. 1984, ApJ, 287, 219
- (22) Federman, S. R., Glassgold, A. E., & Kwan, J. 1979, 227, 466
- (23) Federman, S. R., & Huntress, W. T. Jr. 1989, ApJ, 338, 140
- (24) Federman, S. R., Knauth, D. C., Lambert, D. L., & Andersson, B-G, 1997, ApJ, 489, 758 (Paper I)
- (25) Federman, S. R., & Lambert, D. L. 1988, ApJ, 328, 777
- (26) Federman, S. R., Strom, C. J., & Good, J. C. 1991, AJ, 102, 1393
- (27) Federman, S. R., Strom, C. J., Lambert, D. L., Cardelli, J. A., Smith, V. V., & Joseph, C. L. 1994, ApJ, 424, 772
- (28) Field, D., Gerin, M., Leach, S., Lemaire, J. L., Pineau des Forêts, G., Rostas, F., Rouan, D., & Simons, D. 1994, A&A, 286, 909
- (29) Field, D., Lemaire, J. L., Pineau des Forêts, G., Gerin, M., Leach, S., Rostas, F., & Rouan, D. 1998, A&A, 333, 280
- (30) Fitzpatrick, E. L., & Massa, D. 1990, ApJ, 163 (FM90)
- (31) Freyberg, M. J., & Schmitt, J. H. M. M. 1995, A&A, 296, L21
- (32) Fuente, A., Martín-Pintado, J., Cernicharo, J., & Bachiller, R. 1993, A&A, 276, 473
- (33) Fuente, A., Martín-Pintado, J., & Gaume R. 1995, ApJ, 442, L33
- (34) Fuente, A., Martín-Pintado, J., Rodríguez-Franco, A., & Moriarty-Schieven, G. D. 1998, A&A, 339, 575
- (35) Gatley, I., Hasegawa, T., Suzuki, H., Garden, R., Brand, P., Lightfoot, J., Glencross, W., Okuda, H., & Nagata, T. 1987, ApJ, 318, L73
- (36) Gerin, M., Phillips, T. G., Keene, J., Betz, A. L., & Boreiko, R. T. 1998, ApJ, 500, 329
- (37) Gonzalez-Riestra, R., Cassatella, A., Solano, E., Altamore, A., & Wamsteker, W. 2000, A&A, 141, 343
- (38) Gredel, R., van Dishoeck, E. F., & Black, J. H. 1993, A&A, 269, 477
- (39) Harvey, P. M., Thronson, H. A. Jr., & Gatley, I. 1980, ApJ, 235, 894
- (40) Hanson, M. M., Snow, T. P., & Black, J. H. 1992, ApJ, 392, 571
- (41) Hobbs, L. M. 1974a, ApJ, 188, L67
- (42) Hobbs, L. M. 1974b, ApJ, 191, 381
- (43) Hollenbach, D., & Natta, A. 1995, ApJ, 455, 133
- (44) Hollenbach, D. J., Takahashi, T., & Tielens, A. G. G. M. 1991, ApJ, 377, 192
- (45) Hollenbach, D. J., & Tielens, A. G. G. M. 1999, Rev. Mod. Phys., 71, 173 (HT99)
- (46) Hudson, R. D., & Carter, V. L. 1965, Phys. Rev., 139, A1426
- (47) Hudson, R. D., & Carter, V. L. 1967a, J. Opt. Soc. Am., 57, 651
- (48) Hudson, R. D., & Carter, V. L. 1967b, J. Opt. Soc. Am., 57, 1471
- (49) Israel, F. P. 1978, A&A, 70, 769
- (50) Jaffe, D. T., Genzel, R., Harris, A. I., Howe, J. E., Stacey, G. J., & Stutzki, J. 1990, ApJ, 353, 193
- (51) Joseph, C. L., Snow, T. P. Jr., Seab, C. G., & Crutcher, R. M. 1986, ApJ, 309, 771
- (52) Knauth, D. C., Federman, S. R., Lambert, D. L., & Crane, P. 2000, Nature, 405, 656
- (53) Kutner, M. L., Machnik, D. E., Tucker, K. D., & Dickman, R. L. 1980, ApJ, 237, 734
- (54) Lada, E. A., DePoy, D. L., Evans II, N. J., & Gatley, I. 1991, ApJ, 371, 171
- (55) Lambert, D. L., Sheffer, Y., Gilliland, R. L., & Federman, S. R. 1994, ApJ, 420, 756
- (56) Lavendy, H., Robbe, J. M., & Gandara, G. 1987, J. Phys. B, 20, 3067
- (57) Lebrón, M., & Rodríguez, L. F. 1997, RMxAA, 22, 165
- (58) Lemaire, J. L., Field, D., Gerin, M., Leach, S., Pineau des Forts G., Rostas, F., & Rouan, D. 1996, A&A, 308, 895
- (59) Lemaire, J. L., Field, D., Maillard, J. P., Pineau des Forts G., Falgarone, E., Pijpers, F. P., Gerin, M., & Rostas, F. 1999, A&A, 349, 253
- (60) Malin, D. F., Ogura, K., & Walsh, J. R. 1987, MNRAS, 227, 361
- (61) Marr, G. V., & Creek, D. M. 1968, Proc. R. Soc. London, A304, 233
- (62) Martini, P., Sellgren, K., & DePoy, D. L. 1999, ApJ, 526, 772
- (63) Mattila, K. 1986, A&A, 160, 157
- (64) Meixner, M., & Tielens, A. G. G. M. 1993, ApJ, 405, 216
- (65) Messing, I., Filseth, S. V., Sadowski, C. M., & Carrington, T. 1981, J. Chem. Phys., 74, 3874
- (66) Meyer, D. M., Cardelli, J. A., & Sofia, U. J. 1997, ApJ, 490, 103
- (67) Meyer, D. M., Jura, M., & Cardelli, J. A. 1998, ApJ, 493, 222
- (68) Meyer, D. M., & Roth, K. C. 1991, ApJ, 376, L49
- (69) Morton, D. C. 1991, ApJS, 77, 119
- (70) Morton, D. C., & Noreau, L. 1994, ApJS, 95, 301
- (71) Nichols, J.S. 1998, in “Ultraviolet Astronomy beyond the IUE Final Archive,” ESA SP-413, eds. W. Wamsteker and R. González-Riestra, 671
- (72) Pankonin, V., & Walmsley, C. M. 1976, A&A, 48, 341
- (73) Pankonin, V., & Walmsley, C. M. 1978, A&A, 67, 129
- (74) Péquinot, D., & Aldrovandi, S. M. V. 1986, A&A, 161, 169
- (75) Perryman, M. A. C. et al. 1997, A&A, 323L, 49
- (76) Phillips, A. P., Pettini, M., & Gondhalekar, P. M. 1984, MNRAS, 206, 337
- (77) Pouilly, B., Robbe, J. M., Schamps, J., & Roueff, E. 1983, J. Phys. B, 16, 437
- (78) Racine, R. 1968, AJ, 73, 233
- (79) Rogers, C., Heyer, M. H., & Dewdney, P. E. 1995, ApJ, 442, 694
- (80) Rouan, D., Field, D., Lemaire, J. L., Lai, O., Pineau des Forêts, G., Falgarone, E., and Deltorn, J. M. 1997, MNRAS, 284, 395
- (81) Sandner, W., Gallagher, T. F., Safinya, K. A., & Gounard, F. 1981, Phys. Rev., A23, 2732
- (82) Savage, B. D., & Mathis, J. S. 1979, ARA&A, 17, 73
- (83) Savage, B. D., Massa, D., Meade, M., & Wesselius, P. R. 1985, ApJS, 59, 397
- (84) Schmatjko, K. J., & Wolfrum, J. 1976, 16th Symposium (International) on Combustion, (Pittsburgh: The Combustion Institute), 819
- (85) Sofia, U. J., Cardelli, J. A., Guerin, K. P., & Meyer, D. M. 1997, ApJ, 482, 105
- (86) Steiman-Cameron, T. Y., Haas, M. R., Tielens, A. G. G. M., & Burton, M. G. 1997, ApJ, 478, 261
- (87) Strom, K. S., Strom, S. E., Carrasco, L., & Vrba,F. J. 1975, ApJ, 196, 489
- (88) Takami, M., Usuda, T., Sugai, H., Kawabata, H., Suto, H., & Tanaka, M. 2000, ApJ, 529, 268
- (89) Tielens, A. G. G. M., & Hollenbach, D. 1985a, ApJ, 291, 722
- (90) Tielens, A. G. G. M., & Hollenbach, D. 1985b, ApJ, 291, 747
- (91) Tull, R. G., MacQueen, P. J., Sneden, C, & Lambert, D. L. 1995, PASP, 107, 251
- (92) Vallée, J. P. 1987, Ap&SS, 137, 217
- (93) van den Bergh, S. 1966, AJ, 71, 990
- (94) van Dishoeck, E. F., & Black, J. H. 1986, ApJS, 62, 109
- (95) van Dishoeck, E. F. 1987, in IAU Symposium 120, Astrochemistry, ed. M. S. Vardya & S. P. Tarafdar (Dordrecht:Reidel), 51
- (96) van Dishoeck, E. F., & Black, J. H. 1988, ApJ, 332, 995
- (97) Walker, G. A. H., Yang, S., Fahlman, G. G., & Witt, A. N. 1980, PASP, 92, 411
- (98) Watson, W. D., Anicich, V. G., & Huntress, W. T. Jr. 1976, ApJ, 205, 165
- (99) Welty, D. E., Hobbs, L. M., & Kulkarni, V. P. 1994, ApJ, 436, 152
- (100) Welty, D. E., & Hobbs, L. M. ApJS(in press 2001)
- (101) Welty, D. E., Morton, D. C., & Hobbs, L. M. 1996, ApJS, 106, 533
- (102) Witt A. N., Bohlin, R. C., & Stecher, T. P. 1981, ApJ, 244, 199
- (103) Witt A. N., Bohlin, R. C., & Stecher, T. P. 1984, ApJ, 279, 698 (WBS84)
- (104) Witt A. N., & Cottrell, M. J. 1980a, AJ, 85, 22
- (105) Witt A. N., & Cottrell, M. J. 1980b, ApJ, 235, 899
- (106) Witt A. N., Walker, G. A. H., Bohlin, R. C., & Stecher, T. P. 1982, ApJ, 261, 492
- (107) Wyrowski, F., Walmsley, C. M., & Tielens, A. G. G. M. 1997 A&A, 324, 1135
- (108) Wyrowski, F., Walmsley, C. M., Goss, W. M., & Tielens, A. G. G. M. 2000, ApJ, 543, 245
- (109) Zsargó, J., & Federman, S. R. 1998, ApJ, 498, 256
- (110) Zsargó, J., Federman, S. R., & Cardelli, J. A., 1997, ApJ, 484, 820
- (111) Zuckerman, B. 1973, ApJ, 183, 863
![[Uncaptioned image]](/html/astro-ph/0103151/assets/x1.png)
![[Uncaptioned image]](/html/astro-ph/0103151/assets/x2.png)
![[Uncaptioned image]](/html/astro-ph/0103151/assets/x3.png)
![[Uncaptioned image]](/html/astro-ph/0103151/assets/x4.png)
![[Uncaptioned image]](/html/astro-ph/0103151/assets/x5.png)
![[Uncaptioned image]](/html/astro-ph/0103151/assets/x6.png)
![[Uncaptioned image]](/html/astro-ph/0103151/assets/x7.png)
![[Uncaptioned image]](/html/astro-ph/0103151/assets/x8.png)
![[Uncaptioned image]](/html/astro-ph/0103151/assets/x9.png)
![[Uncaptioned image]](/html/astro-ph/0103151/assets/x10.png)
![[Uncaptioned image]](/html/astro-ph/0103151/assets/x11.png)
![[Uncaptioned image]](/html/astro-ph/0103151/assets/x12.png)
![[Uncaptioned image]](/html/astro-ph/0103151/assets/x13.png)
![[Uncaptioned image]](/html/astro-ph/0103151/assets/x14.png)
![[Uncaptioned image]](/html/astro-ph/0103151/assets/x15.png)
![[Uncaptioned image]](/html/astro-ph/0103151/assets/x16.png)
![[Uncaptioned image]](/html/astro-ph/0103151/assets/x17.png)
![[Uncaptioned image]](/html/astro-ph/0103151/assets/x18.png)