On The Parent Population of Radio Galaxies and the FR I–II Dichotomy
The most promising explanation for the nuclear activity of galaxies is the presence of gas accretion around a massive black hole, and it seems clear now that all galaxies have a massive black hole in their center (Richstone et al. 1998; van der Marel 1999). This suggests that all elliptical galaxies have the basic ingredient for becoming active.
Here we test the possibility that all elliptical galaxies can host radio sources of any power and radio class. In particular, we test whether it is possible to link the optical luminosity function (LF) of non-radio and radio galaxies. To do that, we note that ellipticals of different luminosity might well have different probabilities of forming strong radio sources. Indeed in complete samples of radio sources (Ledlow & Owen 1996; Govoni et al. 2000) a roughly constant number of radio galaxies (RG) is observed between mag, indicating the probability of observing radio emission increases strongly with the optical luminosity, . To constrain this probability function, we start from the following general assumptions based on empirical result for RG:
(1) The optical LF of non-radio ellipticals is a Schechter function: . We set (or in the Cousins R band; H km/s/Mpc; q) and , as found for elliptical galaxies in the Stromlo-APM experiment (Loveday et al. 1992).
(2) All elliptical galaxies of all optical luminosities have the potential of being radio sources, with a probability . Where sets the overall normalization of the function, and S(L) is dimensionless.
(3) Regardless of , once activated, all ellipticals produce radio sources with the same power-law distribution (in units of ; Toffolatti et al. 1987; Urry & Padovani 1995)
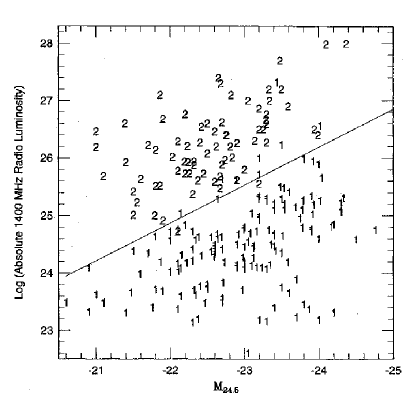
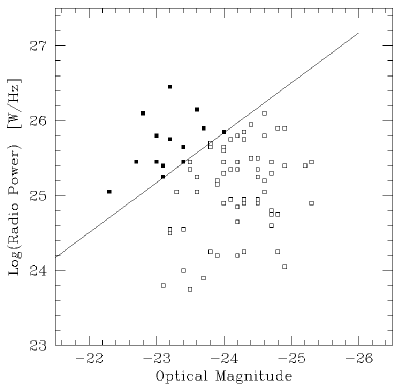
(4) In the radio-optical luminosity plane FR I and FR II are separated by a transition line roughly proportional to , with normalization depending on the frequency under consideration.
From hypothesis 1 and 2, the normalized cumulative distribution of RG in luminosity is given by the incomplete gamma function . Both constants and cancel out, leaving as the only free parameter. The best fit to the observations is obtained for (Fig 1).
Having fixed , we then use assumptions 3 and 4 to populate the radio-optical luminosity plan and see whether the introduction of this probability function can explain some known property of RG. In Figures 2 and 3, it is shown that it is indeed possible to reproduce the observed distribution of RG in this plane starting from the LF of non-radio ellipticals. Moreover, our result is consistent with a picture in which FR I and FR II radio sources are hosted by galaxies extracted from the same parent population. No intrinsic differences are necessary to explain the well known difference of mag. in optical luminosity between the two classes of radio galaxies (Fig. 4). This is due to the transition region being a increasing function of the optical luminosity (Bicknell 1995).
The physical interpretation for this continuity of elliptical galaxy properties across all radio powers is that all ellipticals have a central black hole and therefore have the potential to generate radio sources. Once the radio source is created, its power should depend mainly on accretion rate, which should depend on the availability of gas and stage of development of the accretion activity. It is not too surprising, therefore, that the radio power is largely independent from .


References
- [1] Bicknell G.V. 1995, ApJS 101, 29
- [2] Govoni F., Falomo R., Fasano G. & Scarpa R. 2000, A&A 353, 507
- [3] Ledlow M.J. & Owen F.N. 1996, AJ 112, 9
- [4] Loveday J., Peterson B.A., Efstathious G. &
- [5] Maddox S.J. 1992, ApJ 390, 338
- [6] Richstone D., Ajhar E.A., Bender R. et al. 1998, Nature 395, 14
- [7] Smith E.P. & Heckman T.M. 1989, ApJ 341, 658
- [8] Toffolatti L., Franceschini A., Danese L & de
- [9] Urry C.M. & Padovani P. 1995, PASP 107, 803
- [10] van der Marel R. 1999, AJ 117, 744