The Star Formation Histories of Local Galaxies: Continuous or Intermittent?
Guinevere Kauffmann1, Stéphane Charlot2,1, Michael L. Balogh3
1Max-Planck Institut für Astrophysik, D-85748 Garching, Germany
2 Institut d’Astrophysique du CNRS, 98 bis Boulevard Arago, F-75014 Paris, France
3 Department of Physics, University of Durham, South Road, Durham DH1 3LE, UK
We explore a model in which efficient star formation in galaxies is triggered by merging satellites. We show that the merger/interaction rates predicted by hierarchical galaxy formation models depend strongly on galaxy mass. If a merger of a satellite larger than 1% the mass of the primary triggers efficient star formation, low-mass dwarf galaxies experience strong bursts separated by quiescent periods lasting several Gyr. Massive galaxies, such as our own Milky Way, are perturbed by a 1% satellite every few hundred million years, and thus have fluctuating, but relatively continuous star formation histories. We study the spectral signatures of a population of galaxies undergoing intermittent star formation by combining the models with the latest version of the Bruzual & Charlot spectral synthesis code. We concentrate on spectral indicators that are sensitive primarily to stellar age, rather than to metallicity and extinction. We show that if a population undergoes intermittent rather than continuous star formation, the signatures of the bursts should be evident from the observed dispersion in the star formation rates, H equivalent widths and gas mass fractions of galaxies with 4000 Å break strengths indicative of recent or ongoing star formation.
Keywords: galaxies:formation–galaxies:interactions–galaxies:stellar content
–galaxies:starburst
1 Introduction
There is considerable evidence that the star formation rates in many galaxies have not been monotonic with time, but have instead exhibited significant fluctuations. Analyses of the colour-magnitude diagrams of stars in Local Group galaxies show that no two Local Group members have identical star formation histories (see Tolstoy 2000, Grebel 2000 for recent reviews). The lowest-mass systems, the dwarf spheroidals and the dwarf irregulars, appear to have formed stars in one or two discrete episodes or ‘bursts’. More massive dwarf galaxies, such as the Large and Small Magellanic Clouds, seem to have formed stars continuously, but at a variable rate (Dolphin 2000; Olsen 2000). Recent studies have indicated that star formation in our own Milky Way has also been variable. Rocha-Pinto et al (2000) analyzed chromospheric age indicators in a sample of solar neighbourhood stars and found fluctuations in the star formation rate with amplitudes greater than a factor of 2–3 on timescales of 0.2–1 Gyr. These results were confirmed by an analysis of solar neighborhood data from the Hipparcos catalogue by Hernandez, Valls-Gabaud & Gilmore (2000).
It is not yet possible to derive star formation histories for galaxies outside the Local Group. Instead, measurements of colours and spectral features provide a ‘snapshot’ of the stellar populations and current star formation rates of these objects. Traditionally, galaxies are subdivided according to morphology, luminosity, or local overdensity, and trends in spectral properties or colour are studied. Analyses of the global star formation rates (SFRs) of galaxies have been carried out by studying the H, ultraviolet continuum and far-infrared emission from galaxies (see Kennicutt 1998 for a review). Their relative star formation rates (normalized to unit mass or luminosity) have been found to depend strongly on morphological type (Cohen 1976; Kennicutt & Kent 1983), on stellar mass (Gavazzi & Scodeggio 1996; Gavazzi et al 1998) and on environment (Kennicutt 1983; Loveday, Tresse & Maddox 1999; Couch et al 2000). Late-type galaxies, low-mass galaxies and galaxies in low-density regions form stars at higher relative rates than massive, early-type galaxies in groups and clusters. Only a few studies address the question of variability in star formation (Glazebrook et al 1998; Sullivan et al 2000). This is because the galaxy samples analyzed so far have been small or inhomogeneously selected. This situation will change dramatically with the next generation of large redshift surveys such as the Sloan Digital Sky Survey (SDSS) (York et al 2000) and Two Degree Field (2dF) galaxy redshift survey (Folkes et al 1999), which will obtain colours and spectra of millions of galaxies over the next years.
The physical processes that control how rapidly a galaxy is able to convert its available gas into stars are not well understood. One popular idea is that there are two basic ‘modes’ of star formation: 1) an underlying, low-efficiency, continuous mode that is present in all galaxies; and 2) a more efficient ‘burst’ mode that is triggered when gas is compressed as a result of a merger or other dynamical disturbance.
Low surface brightness galaxies (LSBs) may be examples of objects that have have formed all or most of their stars in the low-efficiency mode. Analyses of the stellar populations of LSBs indicate that these galaxies do not experience a delayed onset of star formation as proposed by McGaugh & Bothun (1994), but have formed their stars slowly over a Hubble time (van Zee et al 1997; van den Hoek et al 1999; Matthews, Gallagher & van Driel 1999). In addition LSBs have higher gas mass fractions than normal spirals (De Blok et al 1996), further supporting the idea that the efficiency of star formation is lower in LSBs than in high surface brightness spirals. Finally, LSBs are also clustered much more weakly than normal galaxies on scales less than 2 Mpc, indicating that they are not located in environments where interactions and mergers are common (Mo, McGaugh & Bothun 1994).
The ultra-luminous infrared galaxies (ULIRGs) are the most dramatic examples of galaxies that form stars in the burst mode. Their star formation rates are estimated at hundreds of solar masses per year and most of these objects have turned out to be interacting or merging galaxies (Borne et al 2000). Numerical simulations have demonstrated that a merger of two equal mass disk galaxies is extremely effective at channelling gas to the centre of the remnant, where it can fuel a nuclear starburst (Barnes & Hernquist 1991). These mergers also result in the formation of elliptical galaxies.
Simulations have also shown that the distribution of gas in disk galaxies may also be strongly perturbed during minor mergers. Hernquist & Mihos (1995) simulated mergers between gas-rich disks and companions a tenth the mass of the primary, and found that the disk developed strong spiral structure. The gas lost angular momentum as a consequence of the formation of strong shocks, and a significant fraction was driven into the inner regions of the disk. Byrd & Howard (1992) showed that satellites larger than 1% the mass the primary galaxy could excite large-scale tidal arms in the disk of the primary, which were able to survive as long as six disk edge rotations. If minor mergers lead to gas compression in disk galaxies and if stars form more efficiently in regions of higher gas density (Kennicutt 1999), then these events may be responsible for the fluctuating star formation rates observed in galaxies.
In this paper, we explore a model in which efficient star formation is triggered by mergers. We compute galaxy merging rates as a function of mass and of redshift using the predictions of hierarchical galaxy formation models (Kauffmann, White & Guiderdoni 1993; Kauffmann & Charlot 1998). A similar model for star formation has been applied to the high-redshift galaxy population by Somerville, Primack & Faber (2001). Here we focus on the star formation histories of present-day galaxies as a function of their luminosity or mass. In §2 and §3, we show that low-mass galaxies are triggered much less frequently than high-mass galaxies. As a result, efficient star formation occurs much more intermittently in low-mass galaxies and a larger percentage of these objects will have low surface brightness and high gas-to-stellar mass ratios. In §4, we explore the spectral signatures of a bursting population of galaxies by combining our models with the latest version of the Bruzual & Charlot (1993) spectral synthesis code. We show that if a population of galaxies undergoes intermittent rather than continuous star formation, the signatures of the bursts should be apparent in the widths of the distributions of 4000 Å break strengths, Balmer absorption line equivalent widths, current star formation rates and gas mass fractions.
2 Merging/triggering rates as a function of mass
In hierarchical theories of structure formation, large structures such as galaxies, groups and clusters form through the continuous aggregation of non-linear halos of dark matter into larger and larger units. Merging trees that track the merger paths of dark matter halos as a function of time can be generated using the extended Press-Schechter theory (Cole & Lacey 1993; Kauffmann & White 1993; Kolatt & Somerville 1999; Cole et al 2000) or directly from N-body simulations (Roukema et al 1997; Kauffmann et al 1999; Van Kampen et al 1999).
As discussed in Kauffmann & White (1993), the merging histories of dark matter halos depend both on cosmological parameters, such as , and , and on the mass of the halo. In particular, high-mass halos have formed through more late mergers than low-mass halos. This is illustrated in the left-hand panel of Fig. 1, where we plot the average time to the last merger of an object with at least a tenth the mass of the primary halo as a function of the circular velocity of the halo at the present day. Here and in the rest of the paper we adopt a CDM cosmology with , , and km s-1 Mpc-1. The procedure for computing the merging histories is described in detail in Kauffmann & White (1993). The right-hand panel of Fig. 1 shows the fraction of halos that have not experienced a merger with another halo greater than a tenth of their mass for a significant fraction (two-thirds) of a Hubble time. Note that below km s-1, the fraction of undisturbed halos rises steeply.

In hierarchical models, galaxies do not merge with each other at the same time as their surrounding dark matter halos. N-body plus smoothed particle hydrodynamics simulations show that as dark matter halos coalesce, the embedded galaxies merge on a timescale that is consistent with dynamical friction estimates based on their total (gas plus surrounding dark matter) mass (Navarro et al 1995). In semi-analytic models of galaxy formation, the halo merging trees and dynamical friction-based estimates of galaxy merging rates are combined to estimate how frequently satellite galaxies merge with central galaxies of given luminosity or stellar mass.

In the left panel of Fig. 2, we plot the average time to the last merger of a satellite with at least a third and a hundredth the mass of the central galaxy, as a function of the stellar mass of the central galaxy at the present day. As discussed in the introduction, 1:3 mergers are major events that trigger strong nuclear starbursts and lead to the formation of elliptical galaxies. However, major mergers are rare. The majority of galaxies with present-day stellar masses less than never experienced a major merger. Only galaxies with masses in excess of have typically undergone a major merger since redshift 1. Minor mergers are much more common. Milky-Way-type galaxies with masses of typically have a 1:100 merger every 500 million years. On the other hand, dwarf galaxies with masses typically experienced their last 1% merger more than 5 billion years ago. The mass dependence of late-time mergers is illustrated again in the right panel of Fig. 2, where we plot the fraction of galaxies that have not been disturbed by a 1:100 event for the past two-thirds of a Hubble time. As can be seen, the fraction of unperturbed galaxies is a strong function of galaxy mass, rising from near zero for galaxies to nearly a third for dwarfs.
In traditional models for the formation of disk galaxies, low surface brightness (LSB) galaxies are assumed to form in halos with high angular momentum (Dalcanton, Spergel & Summers 1997; Mo, Mao & White 1997). It is generally assumed that a fixed fraction of the baryons in the halo cool to form the disk and that all disks have the same mass-to-light ratio. This implies a relation between the central surface brightness of the disk and the mass of its halo, . Because the angular momentum distribution of dark matter halos depends only weakly on local overdensity (Lemson & Kauffmann 1999), LSB galaxies are not expected to be clustered any differently from high surface brightness galaxies in such models. This disagrees with direct observational evidence that low surface brightness galaxies are much more weakly clustered on small scales (Mo, McGaugh & Bothun 1994). Another weakness of the models is that they predict a luminosity-surface brightness relation that is much shallower than the one derived by Driver (1999) for galaxies in the Hubble Deep Field, which has the form .
We suggest here that both problems may be solved in a scenario where mergers trigger efficient star formation and increase the surface brightness of galactic disks. Because low-mass galaxies are triggered less often, they will have larger gas fractions and higher mass-to-light ratios than high-mass galaxies (see §4). In addition, LSBs would not survive in dense environments where the probability of an encounter with another galaxy is high.
In summary, merging rates depend strongly on mass in hierarchical cosmologies. Low mass galaxies experience fewer recent mergers than high-mass galaxies. If mergers trigger efficient star formation, the star formation histories of dwarf galaxies should be characterized by much more widely-spaced bursts than those of massive galaxies.
3 A Toy Representation of Intermittent Star Formation
Detailed N-body plus hydrodynamic simulations are necessary in order to understand the triggering effects of mergers in detail. Mihos & Hernquist (1995) have demonstrated that the nature of the gas inflows are sensitive not only to the orbital parameters of the infalling satellite, but also to the structure of the primary galaxy, for example the presence of a bulge. Detailed modelling of the effects of mergers is beyond the scope of this paper. Our goal is to study the spectral signatures of a population of galaxies undergoing intermittent rather than continuous star formation. To do this, we construct a toy model of merger–triggered star formation. We appeal to standard semi-analytic models of galaxy formation, which follow the formation and evolution of galaxies within a merging hierarchy of dark matter halos. These models include simple ‘recipes’ that describe gas cooling, star formation, supernova feedback and galaxy-galaxy merging (see for example Kauffmann et al 1999; Somerville & Primack 1999; Cole et al 2000).
Semi-analytic models have traditionally adopted a star formation law of the form , where is the mass of cold gas in the disk, is the dynamical timescale of the galaxy, and is a free parameter controlling the efficiency of the conversion of cold gas into stars. is controlled by the cooling rate from the surrounding halo, by the rate at which gas is turned into stars, and by the rate at which supernovae reheat cold gas. The star formation efficiency parameter is tuned in order to match the -band luminosity and the gas mass of a Milky Way–type galaxy in a halo of circular velocity 220 km s-1 at the present day. This star formation law results in a roughly continuous rate of star formation in galaxy disks with a redshift–dependence that is similar for galaxies of different mass or circular velocity. This is illustrated in Fig. 3, which also shows that this star formation law results in very little scatter in the current star formation rates of disk galaxies of fixed present-day circular velocity.

One simple way to obtain fluctuating star formation histories in galaxies is to allow the efficiency parameter to vary if the galaxy experiences a merger. In the semi-analytic models of Kauffmann et al (1999) and Cole et al (2000), this only happens if a galaxy experiences a ‘major’ merger with an object of at least a third of its mass. In this case, all the available cold gas is converted into stars on a timescale of years. However, as we have seen, major mergers occur infrequently, particularly in low-mass galaxies. In addition, they cannot explain fluctuations in star formation rates on timescales of less than several Gyr in high-mass galaxies. Recently, Somerville, Primack & Faber (2001) considered a model in which every galaxy merger triggered a starburst with an efficiency that scaled as a weak power-law function of the mass-ratio of the merging galaxy pair. The parameters controlling the burst efficiency were tuned to match the simulation results of Mihos & Hernquist (1994; 1996).
We will follow Somerville et al (2001) in assuming that all mergers induce starbursts. However, we choose to keep things conceptually simple by assuming that disks only form stars in two ‘modes’: a low-efficiency mode () and a high-efficiency mode () that occurs for duration after a merger with a satellite with mass at least 1% that of the primary galaxy. Note that this is actually not very different to the prescription adopted by Somerville at al (2000). According to their parametrization, the starburst efficiency depends only weakly on the mass ratio: the efficiency of a burst triggered by a 1:100 merger is only half that of a burst triggered by a 1:1 merger.
In our analysis, we explore the effect of changing the relative efficiencies of the burst and quiescent modes by varying (the absolute normalization of these parameters is always chosen to obtain the same -band luminosity for central galaxies in present-day halos of 220 km s-1). We also explore the effect of the the choice of burst timescale on a variety of spectral features. Otherwise, the models are the same as in Kauffmann & Charlot (1998) and Kauffmann et al (1999), to which we refer for more details.
Fig. 4 shows the star formation histories of the central galaxies in three halos with 220 km s-1 at the present day (i.e., Milky Way-type galaxies). Here we have assumed that the efficiency of the triggered mode is 10 times the efficiency of the quiescent mode (). We have further assumed that the burst duration scales with dynamical time, , with Gyr at . For comparison, Fig. 5 shows the star formation histories of 3 central galaxies in halos of 70 km s-1 (i.e., dwarf-type galaxies).
Because galaxies in 220 km s-1 halos are triggered several times every Gyr on average, their star formation histories are continuous over long periods. Occasional ‘gaps’ occur, but galaxies form stars in the efficient burst mode most of the time. ‘Dwarf’ galaxies in 70 km s-1 halos behave very differently. They experience quiescent periods of many Gyr, punctuated by shorter bursts. At fixed cosmic time , if there has been a long gap since the last episode of efficient star formation, the burst is stronger because the galaxy has had longer to accumulate more cold gas. We also note that triggering is more frequent at early times.


The physical processes regulating star formation in satellite galaxies are likely to be different to the processes that determine the star formation histories of central galaxies. In the semi-analytic models of Kauffmann et al (1999), the star formation rates of satellites decline exponentially on a timescale of 1 Gyr because these objects no longer accrete cold gas from the halo. Ram-pressure stripping has been proposed as another mechanism that can rid a galaxy of its gas and lead to the cessation of star formation in cluster spirals (Gunn & Gott 1972). This is not included in the models presented here.
We also assume here that satellite galaxies within a halo can merge only with the central galaxy of that halo. Springel et al (2001) used high-resolution N-body simulations to study the rate at which two satellite galaxies merge with each other and found it to be low (5%) compared to that of satellite–central galaxy mergers. ‘Non-sticking’ collisions between satellite galaxies are much more frequent (Tormen, Diaferio & Syer 1998; Kolatt et al 2000) and these events may also excite bursts of star formation (Moore et al 1996). In fact, there is evidence that the last significant burst of star formation in the LMC may have been caused by a tidal interaction with our Galaxy (Lin, Jones & Klemola 1995). Because we cannot follow galaxy orbits using our semi-analytic approach, we are not able to model the influence of collisions on the star formation histories of individual satellite systems. Instead, we assume that satellite galaxies form stars in the high-efficiency mode for a time every time their parent dark matter halo merges with another more massive halo, i.e. efficient star formation is triggered at the time of collapse of the next level of the hierarchy. This is very similar to the prescription adopted by Lacey & Silk (1991) in their model of tidally triggered galaxy formation. We will concentrate on the properties of star-forming field galaxies in this paper. These are mostly the central objects of their halos, so the prescriptions adopted for star formation in satellite systems will not be important for most of our results.
We will explore four models with different ratios of burst–to–quiescent mode efficiency ( and different burst timescales . The properties of the models are summarized in Table 1. Model Q is our ‘reference model’ in which all star formation takes place in the quiescent mode (). In this model, central galaxies form stars at a rate that is regulated by the amount of gas that cools from the surrounding dark matter halo. Satellite galaxies do not accrete any gas, and as a result they always have lower star formation rates and redder colours than the central galaxy in their halo. In models A–C, central galaxies form stars both quiescently and in a burst mode, which is triggered by galaxy-galaxy mergers. Merging of the parent halo with a more massive halo triggers star formation in satellite galaxies, as described above. Comparison of model B to model A illustrates the effect of increasing . Comparison of model C to model A illustrates the effect of decreasing the burst timescale .
In order to develop some intuition for how star formation occurs in these models, we define 3 different ‘regimes’ in which stars form:
-
1.
Low efficiency: star formation that occurs in an unperturbed galaxy.
-
2.
High efficiency burst: high-efficiency star formation that is triggered by a merger, but that continues for less than 1 Gyr.
-
3.
High efficiency continuous: high-efficiency star formation that is triggered by a series of mergers and that continues for longer than 1 Gyr.
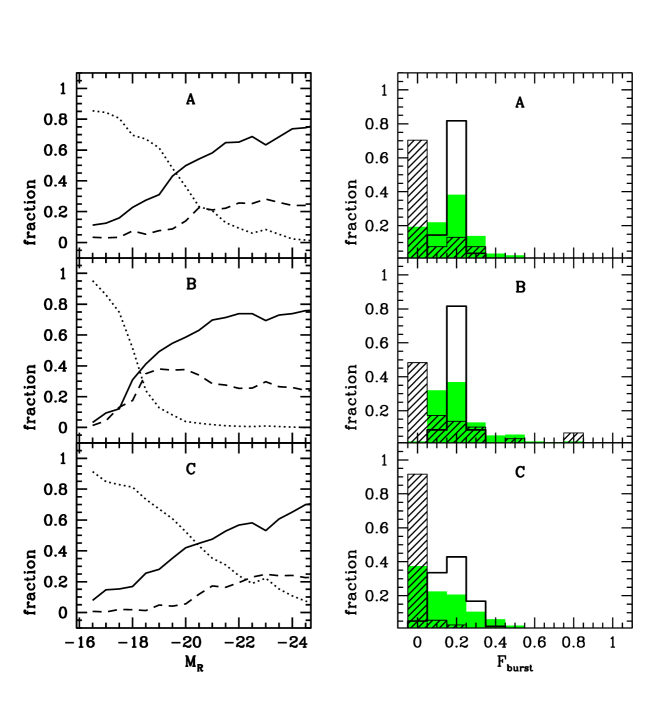
In the left-hand panels of Fig. 6, we plot the average fraction of stars formed in the past 4 Gyr in each of these 3 regimes as a function of the luminosity of the galaxy. Results are shown for central galaxies in models A, B, and C (in model Q, the fraction of stars formed in the low efficiency regime is unity at all luminosities). In the right-hand panels, we show the distribution of galaxies as a function of the mass fraction of stars formed in the burst mode (). The hatched histograms are for galaxies of low luminosity (), the shaded histograms are for galaxies of intermediate luminosity () and the open histograms are for bright galaxies ().
In all three models where efficient star formation is triggered by mergers, low-luminosity galaxies form most of their stars in the low-efficiency regime and bright galaxies in the high-efficiency continuous regime. The contribution of bursts is greatest in galaxies of intermediate and high luminosities. In model B, where is larger than in model A, the fraction of stars formed in bursts increases and the fraction formed quiescently decreases, particularly for galaxies with low and intermediate luminosities. Unlike model A, Model B has an extended tail of low-luminosity galaxies that have formed most of their stars in the burst mode. In model C, where the burst timescale is shorter than in model A, a larger fraction of stars in bright galaxies form in the low-efficiency regime. In §4, we show how these differences between the three models translate into differences in the distributions of strengths of spectral features such as the H equivalent width.
4 Spectral Signatures of Bursts
4.1 Spectral Indicators
In this section, we introduce a number of spectral indicators that are useful diagnostics of the star formation histories of galaxies. Our choice of indicators is motivated by the following considerations:
-
1.
Sensitivity of the indicator to stellar age, rather than to metallicity and dust extinction.
-
2.
Existence of measurements of the indicator for magnitude-limited samples of galaxies.
-
3.
Ability of models to predict the behaviour of the index as a function of stellar age.
4.1.1 The 4000 Angstrom Break:
Discontinuities in the spectra of galaxies are produced by the accumulation of a large number of spectral lines in a narrow wavelength region, which produces a sharp opacity edge reflected as a break in the spectrum. The main contribution to the opacity comes from ionized metals. In hot stars, the elements are multiply ionized and the opacity decreases at optical wavelengths, so the optical breaks are small for young stellar populations and large for old, metal-rich galaxies.
The break occurring at 4000 Å is the strongest discontinuity in the spectrum and the one for which the most galaxy data are available. A break index has been defined by Bruzual (1983) as the ratio of the average flux density Fν in the bands 4050–4250 Å and 3750–3950 Å. A definition using a narrower continuum band has recently been adopted by Balogh et al (1999). The principle advantage of the narrow definition is that the index is then less sensitive to reddening effects.
Fig. 7 illustrates the accuracy of the index as a stellar age indicator in comparison to broadband colours. We have used the latest version of the Bruzual & Charlot (1993) population synthesis models to compute the value of the index for galaxies with a wide range of different star formation histories. Galaxies are assumed to form stars according to the law SFR from redshift to the present day. We pick randomly over the interval 0.2–10 and over the interval – (this allows the SFR to either decrease or increase with time). In order to obtain as wide a range of SFR histories as possible, we also superimpose random ‘bursts’ with amplitude 2–100 times the underlying star formation rate and with duration 0.1–1 Gyr. In Fig. 7, we plot the value of the index versus the -light weighted mean stellar age of the galaxies. Results are shown for two metallicities: solar and 20% solar. Here and in the rest of the paper, we have adopted a Kennicutt (1983b) initial mass function with upper and lower mass cutoffs at 0.1 and 100 .
There is an excellent, metallicity-independent correlation between and -light weighted age for galaxies with mean stellar ages less than Gyr and . The index depends more strongly on metallicity at ages older than a few Gyr. In contrast, optical-infrared colours such as depend on metallicity at all ages. This is because the infrared emission is always dominated by giant stars (supergiants, AGBs or RGBs) with temperatures that are sensitive to metallicity. The colour is a much better age indicator. Its main drawback is the uncertainty introduced by dust. Wang & Heckman have shown that the mean -band optical depth of a spiral galaxy is . This implies that the typical correction to the colour from dust is , implying a factor uncertainty in derived age for blue, star-forming galaxies. This amount of extinction introduces an 8% correction to , corresponding to a factor uncertainty in mean age. This can be further improved by adopting the narrower definition of the break used by Balogh et al (1999), for which the extinction correction is only 3.4%.
Fig. 7 shows that the dynamic range in at ages less than a few Gyr is small. However, the index can easily be measured with errors of only a few hundredths. Emission from the H-recombination continuum blueward of the break is negligible except for stars with ages less than years, so we expect that the model predictions will be accurate for all but the most strongly star-forming galaxies.

4.1.2 The post-burst indicator
Strong H absorption lines arise in galaxies that have experienced an intense burst of star formation that ended 1–2 Gyr ago. The peak occurs once hot O and B stars, which have weak intrinsic absorption, have terminated their evolution, and the optical light from the galaxy is dominated by late-B to early F-type stars. The spectral resolution of the Bruzual & Charlot models is too low to measure the H absorption feature reliably. We adopt the standard procedure of parameterizing absorption-line strengths as functions of stellar effective temperature, gravity, and metallicity (e.g., Worthey et al. 1994). Worthey & Ottaviani (1997) derive two alternative parameterizations of the absorption feature using the Lick/IDS stellar spectral library. These correspond to narrow (H) and wide (H) definitions of the central bandpass bracketed by two pseudo-continuum bandpasses. Since the H index is closer in definition to the index used in most observational analyses, we adopt it as our standard in this paper. We compute the index strengths of the galaxies in our model by weighting the contributions from individual stars by their level of continuum (see, e.g., Bressan, Chiosi & Tantalo 1996 for a description of this standard procedure).
We also account for the contamination of stellar H absorption by nebular emission in galaxies containing young massive stars. We adopt case-B recombination to compute the H emission produced by the ionizing radiation from these stars. If emission lines were attenuated by dust in the same way as continuum radiation, the emission correction to the equivalent width would not depend on extinction. However, observations of nearby starburst galaxies indicate that the attenuation inferred from the ratio of H to H is often higher than that inferred from the spectral continuum (e.g., Fanelli, O’Connell & Thuan 1988; Calzetti, Kinney & Storchi-Bergmann 1994). The most likely reason for this apparent discrepancy is the finite lifetime of the dense clouds in which stars form, which causes the effective -band absorption optical depth of the dust to be typically a few times larger for emission lines than for the continuum radiation (Charlot & Fall 2000). For , this implies a difference of at least a factor of 2 in the attenuation of H line and continuum photons. We account for this in the models by reducing our dust-free H emission corrections by a factor of two. Because the H emission line is weak (compared to H or H), the actual emission correction makes only a small difference to our results. Changing the value of the emission correction can shift the values of H reached by galaxies with ongoing star formation by Å, but does not affect the values attained by galaxies once they have ceased forming stars.
The time evolution of H following an instantaneous burst of star formation is shown in Fig. 8. The solid line shows the result for solar metallicity and the dashed line for 20% solar metallicity. We adopt the convention of positive index values for absorption and negative values for emission. As can be seen, the dependence of the H index on metallicity is very weak. Note that H appears to be in ‘emission’ at late ages because the pseudo-continuum bandpasses surrounding the line are depressed by strong metallic absorption lines (see Fig. 6 of Worthey & Ottaviani 1997).
In Fig. 9, we show the correlation between the H index and the quantity (defined as a the fraction of stars formed in bursts over the past 4 Gyr; see §3) for central galaxies of all luminosities in models A, B and C. There is a reasonably good correlation between and H, albeit with large scatter. The scatter arises because the value of the H index depends both on the mass of stars formed in the burst and time at which the burst occurred. Nonetheless, it is still possible to extract some information about the past star formation history of an individual galaxy from the value of its H index. Fig. 9 shows that galaxies that have formed stars continuously over the past 4 Gyr (i.e. ) have H equivalent widths in the range –. For galaxies with H Å, a significant ( %) fraction of recent star formation must have occurred in a burst. For galaxies with H Å, most ( %) recent star formation occurred in burst(s). Note that the reverse does not hold. Just because a galaxy is observed with H Å today, does not mean it experienced only continuous star formation over the last 4 Gyr. We will show in §5 that the index analysis becomes more powerful if one considers the distributions predicted for a population of galaxies with similar star formation histories.


4.1.3 Emission line indicators
Hydrogen recombination lines, such as H, provide a measure of the current star formation rate in galaxies. The conversion factor beween emission-line luminosities and star formation rate is usually computed using an evolutionary synthesis model. Only stars with masses greater than about 10 M⊙ and lifetimes less than 30 Myr contribute significantly to the ionizing flux, so the recombination lines provide a nearly instantaneous measure of the star formation rate, independent of the previous star formation history of the galaxy. Extinction is the most important source of error in H-derived star formation rates. Using integrated H and radio fluxes of a sample of nearby galaxies, Kennicutt (1983c) derives a mean extinction A(H) = 0.8–1 mag.
The [OII]3727 forbidden-line doublet is also sometimes used as a star formation rate indicator. It has been calibrated empirically (through H) as a quantitative SFR tracer (Gallagher, Hunter & Bushouse 1989; Kennicutt 1992). The main advantage of [OII] is that it can be observed in the visible out to redshifts , and it has been measured in several large surveys of faint galaxies (e.g. Cowie et al 1996; Ellis 1997). The main disadvantage is that the luminosities of collisionally-excited lines are not directly coupled to the ionizing luminosity, and their excitation is sensitive to metallicity and to the ionization state of the gas. Recently, Jansen, Franx & Fabricant (2000) have found that the relation between H and [OII] depends strongly on magnitude. They attribute this to systematic variations in reddening and metallicity as a function of galaxy luminosity.
Charlot & Longhetti (2001) have quantified the errors in SFR estimates based on optical emission lines by exploring a comprehensive set of models that reproduced the observed properties of nearby galaxies. They showed that the H and [OII] luminosities produced per unit SFR can vary by more than an order of magnitude depending on the parameters of the ionized gas (metallicity, dust-to-heavy element ratio, ionization state) and on the absorption by dust in the neutral interstellar medium. The large uncertainties in the derived SFR can be reduced to a factor of only 2–3 when comparing the H or [OII] emission to that of other lines such as H, [OIII], [NII], and [SII]. Such detailed spectral information is not currently available for large samples of galaxies, but this situation will change after completion of future surveys such as SDSS and 2dF.
5 Burst Signatures in the Models
In this section, we explore different ways of evaluating whether a population of galaxies observed at a single redshift has been forming stars continuously or intermittently. We generate catalogues of galaxies complete to for models Q, A, B and C. To achieve this, we first compute many realizations of the galaxy populations in halos of different masses using the techniques described in §3. We then obtain the number density of galaxies of given luminosity, colour, star formation rate and spectral index by convolving these realizations with the abundance of halos calculated using the Press-Schechter (1974) theory.
We first study global distributions of spectral indicators, such as and H. In Fig. 10, we plot the distribution of 4000 Å break strengths as a function of absolute magnitude for models Q, A, B, and C. The solid circles indicate the median value of , while solid and dotted error bars indicate the 25th–75th and 10th–90th percentiles of the distributions. In the pure quiescent model Q, the distribution of break strengths of faint galaxies extends to larger values than it does for bright galaxies. This is because a large fraction of the faint objects are satellite galaxies that have run out of gas and that have little ongoing star formation, whereas most bright objects are central galaxies which accrete gas from the surrounding halo and form stars at a roughly constant rate (Fig. 3). The break distributions of bright galaxies exhibit significantly more scatter in models A, B and C than in model Q. The break strengths of faint galaxies are larger in models where bursts are important. As noted in §2, faint galaxies are triggered infrequently at late times, so they will have larger mean stellar ages in the burst models than in the quiescent model.

As discussed in §3, the physical processes regulating star formation in satellite galaxies are likely to be different to the processes that determine the star formation histories of central galaxies. Ideally, one would like to separate satellite from central galaxies when analyzing the spectral index distributions of galaxy populations. This can be done if one has environmental information about the galaxies in the survey. Alternatively, one can use the index strengths to select only those galaxies with young stellar populations. In the models, these are mostly central galaxies.
We showed in §4 that the index is a good mean stellar age indicator up to ages of a few Gyr and corresponding break strengths of 1.5–1.6. In Fig. 11, we plot the H distribution as a function of absolute magnitude for galaxies with and for the same models as in Fig. 10. In model Q, these cuts select actively star-forming central galaxies. Because the star formation in this model is determined only by cooling rates in dark matter halos, the H distributions exhibit very little scatter and do not depend on galaxy luminosity. The H distributions of the burst models are very different. In model A, galaxies with show the strongest dispersion in H absorption. Fainter galaxies are triggered infrequently, so star-forming galaxies are seen mainly in the quiescent mode. Brighter galaxies are triggered very frequently, so individual bursts overlap and the resulting star formation history is once again quasi-continuous (see Fig. 6). If the burst timescale is shortened (model C), bright galaxies also exhibit strong H absorption. If the star formation efficiency in the quiescent model is very small (model B), the fraction of faint galaxies undergoing strong bursts increases, and this is reflected in the fraction of H-strong galaxies at magnitudes below . In all the models, galaxies with the strongest H absorption have break values in the range . At smaller break strenghs, the H line is increasingly seen in emission rather than absorption.

There is currently only one data set containing measurements of 4000 Å break strengths and H equivalent widths for a large sample of local galaxies. This is the Las Campanas Redshift Survey (LCRS; Schectman et al 1992,1996), which consists of 23700 galaxy spectra with a mean redshift of 0.1 in six slices of 1.5 80 degrees. The galaxies are selected to have Kron-Cousins R-band isophotal magnitudes between and surface brightnesses within the 3.5” fiber aperture of mag arcsec-2. Zabludoff et al (1996) have developed an automated procedure for measuring the equivalent widths of [OII]3727, Balmer lines (H, H and H) and the 4000 Å break. A catalogue of these measurements was kindly made available to us by A.Zabludoff.
In Fig. 12, we plot the distribution of H equivalent widths of galaxies in the LCRS sample as a function of R-band absolute magnitude and compare these with the distributions given by models A, B and C. In both the data and the models, we have selected galaxies with . The mean error on the EW(H) measurements in the LCRS is 0.85 Å, with strong dependence on the strength of the feature but not on the absolute magnitude of the galaxy. In our analysis, we have added errors to the values of H calculated in the models by drawing from the distribution of errors as a function of H equivalent width in the LCRS sample. We note that Zabludoff et al (1996) did not measure the H index, but adopted a different procedure for estimating the equivalent width, which involved finding the line center and integrating outwards over 100 pixels on either side of the line, where the continuum was assumed to be reached. This procedure should in general lead to larger measured equivalent widths, but unfortunately we are unable to quantify how much difference this would make in practice. In future work, it will be very important to adopt consistent index definitions when comparing observations with theory.
Nevertheless it is interesting that in the LCRS the distribution of EW(H) does appear to depend on galaxy luminosity. The width of the distribution of EW(H) increases towards fainter magnitudes, reaching an apparent “peak” for galaxies with . The observations are in strong disagreement with the pure quiescent model Q, where the H distribution does not depend on galaxy luminosity and where all galaxies have H Å. However, it is probably premature to attempt to use the data to distinguish between the various burst models. The number of faint galaxies in the LCRS survey is small, so the decrease in H-strong galaxies at fainter magnitudes is not very significant. In addition, because the uncertanties in the measurements of EW(H) are of the same order or larger than the variations as a function of luminosity, a large sample of galaxies with uncertainties less than would be extremely useful for this type of analysis.

We now turn to an analysis of the information that could be provided by the distributions of emission line strengths. In Fig. 13, we plot the instantaneous star formation rates of galaxies in the models normalized by their -band luminosity. Once again the distributions in model Q exhibit little scatter and are independent of luminosity. At small break strengths () models A,B and C have “tails” of bursting objects that form stars at many times the mean rate. These tails are more pronounced for galaxies of intermediate luminosity, which are the most likely to be forming stars in the burst rather than the low efficiency or high efficiency continuous regime at the present day (Fig. 6). At intermediate break strengths () the burst models are characterized by a shift towards star formation rates lower than the mean. This is because many of the galaxies in the sample are caught just after the peak of the burst, when the massive stars producing the ionizing radiation have disappeared, but the break strengths are still quite small. This shift is strongest for bright galaxies in model C, which experience frequent bursts of short duration.
We conclude that although emission lines cannot be used as burst indicators in individual galaxies, in the analysis of galaxy populations they can serve as useful diagnostics of the past history of star formation. Note, however, that the derived star formation rates must be accurate for this kind of analysis to be useful and that star formation rates based on standard conversions using only [OII] or H, which have a factor of 10 or more error (Charlot & Longhetti 2001), will not suffice.

Important complementary information on the variability of star formation in galaxies may be obtained by correlating the stellar properties of galaxies with their gas masses. Although very little data currently exist, the combination of the HI Parkes All-Sky Survey of extragalactic HI (Barnes et al 2000) and deep optical and near-infrared imaging should produce strong constraints on burst models. This is illustrated in Fig. 14, where we plot the distribution of for galaxies with . Once again, the distributions of in model Q do not depend on galaxy luminosity and exhibit very little scatter. In the burst models, faint galaxies are more gas rich than bright galaxies and also exhibit greater dispersion in gas fraction. Models with long burst timescales (models A and B) produce tails of faint, gas-poor galaxies with small break strengths. Such objects are missing in model C, which has a shorter burst timescale. If the quiescent mode is extremely inefficient (model B), there will be a large number of extremely gas-rich, but optically faint galaxies that should be easily detected by surveys such as HIPASS.

6 Discussion and summary
The use of observations at high redshift to reconstruct the formation histories of the galaxies we see today has been a important goal of modern observational cosmology. In practice, this has turned out to be quite difficult. High-redshift galaxies differ from local galaxies in size, mass and morphology, and there is no unambiguous way to identify the distant progenitors of normal spiral and elliptical galaxies in the local Universe. The use of stellar colour-magnitude diagrams to unravel the past star formation histories of galaxies in the Local Group has proved remarkably successful, but the extension of this technique to more distant galaxies will not be possible for many years.
The analysis of galaxy populations provides another way of constraining average star formation histories. To this end, analyses of the H distributions of cluster galaxies have been carried out by Barger et al (1996) and Poggianti et al (1999), but so far there have been no similar studies of field galaxies. The key assumption is that all galaxies in the sample can be regarded as Monte Carlo realizations of the same set of underlying physical processes. The list of processes becomes extremely large if one considers the entire population of field galaxies. However, by judiciously choosing subsamples, such as splitting galaxies by luminosity or environment, one is able to test the basic assumptions of the model. Another important consideration is that the completeness limits on the survey must be well understood. If, for example, a galaxy forming stars with low efficiency falls below the surface brightness detection limits of the survey and this effect is not taken into account, erroneous conclusions will be obtained.
In this paper, we have focused on the spectral rather than the photometric properties of galaxy populations. As we have emphasized, the advantage of using spectral indicators such as or H over broadband colours, is that they are sensitive to stellar age, rather than to some combination of age, metallicity and extinction. The main disadvantage of using spectra in the analysis of future large surveys such as SDSS or 2dF is the problem of aperture bias (Kochanek, Pahre & Falco 2000). This may be overcome to some extent by selecting only galaxies small enough in angular diameter so that a significant fraction of their total light has entered the fiber.
Finally, it would be interesting to explore other signatures of starbursts in galaxies and see how well they correlate with spectral properties. For example, it is known that a significant fraction of the star formation in local starburst galaxies occurs via the creation of super star clusters (SSCs), each with hundreds to thousands of OB stars concentrated within a few parsecs (Whitmore et al 1999). At least some SSCs are gravitationally bound and their masses suggest they may be globular clusters in their infancy. If clustered star formation is a generic feature of the high-efficiency ‘triggered’ mode of star formation, then studying these systems may provide another way of probing the importance of bursts in the star formation histories of nearby galaxies.
In summary,
we have explored a model in which star formation occurs in two modes: 1) a
low-efficiency continuous mode; and 2) a high-efficiency mode
triggered by an interaction with a satellite more than 1% of the primary’s mass.
Merger/interaction rates are specified using the predictions of
hierarchical galaxy formation models.
With these assumptions, the star formation histories of low-mass galaxies
are characterized by intermittent bursts of formation separated
by quiescent periods lasting several Gyr; massive field galaxies are perturbed
on timescales of several hundred million years and have more continuous
star formation histories.
We have explored the distribution of spectral indicators such as and
H
by combining the models with the latest version of the Bruzual & Charlot (1993)
spectral synthesis code. In models where stars form only in the continuous mode,
the star formation rate, H equivalent width and gas fraction distributions of
young galaxies with
are narrowly peaked and do not depend on
luminosity. In the burst models, the distributions have much larger
dispersion and depend strongly on galaxy luminosity.
The widths and shapes of the distributions place strong constraints on
the relative efficiency of the burst mode, as well as the typical duration of
the bursts. We conclude that the analysis of spectral indicators
in future large redshift surveys will provide important new constraints on the nature of
the star formation histories of local galaxies.
Acknowledgments
We thank Jay Gallagher for helpful discussions and for convincing us to carry out this
project, and Ann Zabludoff for providing
the table of spectral indices for the LCRS survey.
References
Balogh, M.L., Morris, S.L., Yee, H.K.C., Carlberg, R.G. & Ellingson, E., 1999, ApJ, 527, 54
Barger, A.J., Aragon-Salamanca, A., Ellis, R.S., Couch, W.J., Smail, I. & Sharples, R.M., 1996, MNRAS, 279, 1
Barnes, D.G., Staveley-Smith, L., de Blok, W.J.G., Osterloo, T., Stewart, I.M., Wright, A.E., Banks, G.D., Bhathal, R. et al, 2000, MNRAS in press
Barnes, J.E. & Hernquist, L.E., 1991, ApJ, 370, 65
Borne, K.D., Bushouse, H., Lucas, R.A. & Colina, L., 2000, ApJ, 529, 77
Bressan, A., Chiosi, C. & Tantalo, R., 1996, A&A, 311, 425
Bruzual, A.G., 1983, ApJ, 273, 105
Bruzual, A.G. & Charlot, S., 1993, ApJ, 405, 538
Byrd, G.G. & Howard, S., 1992, AJ, 103, 1089
Calzetti, D., Kinney, A.L. & Storchi-Bergmann, T., 1994, ApJ, 429, 582
Charlot, S. & Fall, S.M., 2000, ApJ, 539, 718
Charlot, S. & Longhetti, M., 2001, MNRAS in press (astro-ph/0101097)
Cohen, J.G., 1976, ApJ, 203, 587
Cole, S., Lacey, C.G., Baugh, C.M. & Frenk, C.S., 2000, MNRAS, 319, 168
Couch, W.J., Balogh, M.L., Bower, R.G., Smail, I., Glazebrook, K., & Taylor, M., 2001, ApJ in press (astro-ph/0010505)
Cowie, L.L., Songaila, A., Hu, E.M. & Cohen, J.G., 1996, ApJ, 112, 839
Dalcanton, J.J., Spergel, D.N. & Summers, F.J., 1997, ApJ, 482, 659
de Blok, E., van der Hulst, T. & McGaugh, S.S., 1996, MNRAS, 283, 18
Ellis, R.S., 1997, ARA&A, 35, 389
Dolphin, A.E., 2000, MNRAS, 313, 281
Driver, S.P., 1999, ApJ, 526, 69
Fanelli, M.N., O’Connell, R.W. & Thuan, T.X., 1988, ApJ, 334, 665
Folkes, S., Ronen, S., Price, I., Lahav, O., Colless, M., Maddox, S., Deeley, K., Glazebrook, K. et al, 1999, MNRAS, 308, 459
Gallagher, J.S., Hunter, D.A. & Bushouse, H, 1989, AJ, 97, 700
Gavazzi, G. & Scodeggio, M., 1996, A&A, 312,29
Gavazzi, G., Catinella, B., Carrasco, L., Boselli, A. & Contursi, A., 1998, AJ, 115, 1745
Glazebrook, K., Abraham, R., Santiago, B., Ellis, R.S. & Griffiths, R., 1998, MNRAS, 297, 885
Gunn, J.E. & Gott, J.R., 1972, ApJ, 176, 1
Hernandez,X., Valls-Gabaud, D. & Gilmore, G., 2000, MNRAS, 316, 605
Hernquist, L. & Mihos, C.J., 1995, ApJ, 448, 41
Jansen, R.A., Franx, M. & Fabricant, D., 2000, ApJ in press (astro-ph/0012485)
Kauffmann, G. & White, S.D.M., 1993, MNRAS, 261, 921
Kauffmann, G., White, S.D.M. & Guiderdoni, B., 1993, MNRAS, 264, 201
Kauffmann, G. & Charlot, S., 1998, MNRAS, 294, 705
Kauffmann, G., Colberg, J.G., Diaferio, A. & White, S.D.M., 1999b, MNRAS, 307, 529
Kennicutt, R.C., 1983, AJ, 88, 483
Kennicutt, R.C., 1983b, ApJ, 272, 54
Kennicutt, R.C., 1983c, A&A, 120, 219
Kennicutt, R.C., 1992, ApJ, 388, 310
Kennicutt, R.C., 1998, ARA&A, 36, 189
Kennicutt, R.C., 1999, ApJ, 525, 1165
Kennicutt, R.C. & Kent, S.M., 1983, AJ, 88, 1094
Kochanek, C.S., Pahre, M.A. & falco, E.E., 2000, ApJ submitted (astro-ph/0011458)
Kolatt, T.S., Bullock, J.S., Dekel, A., Primack, J.R., Sigad, Y., Kravtsov, A.V. & Klypin, A.A., 2000, MNRAS submitted (astro-ph/0010222)
Lacey, C. & Silk, J., 1991, ApJ, 381, 14
Lacey, C. & Cole. S., 1993, MNRAS, 262, 627
Lemson, G. & Kauffmann, G., 1999, MNRAS, 302, 111
Lin, D.N.C., Jones, B.F. & Klemola, A.R., 1995, ApJ, 439, 652
Loveday, J., Tresse, L. & Maddox, S., 1999, MNRAS, 310, 281
Matthews, L.D., Gallagher, J.S. & van Driel, W., 1999, AJ, 118, 2751
McGaugh, S.S. & Bothun, G.D., 1994, ApJ, 107, 530
Mihos, J.C. & Hernquist, L., 1994, ApJ, 437, 611
Mihos, J.C. & Hernquist, L., 1996, ApJ, 464, 641
Mo, H.J., Mao, S. & White, S.D.M., 1998, MNRAS, 295, 319
Mo, H.J., McGaugh, S.S. & Bothun, G.D., 1994, MNRAS, 267, 129
Moore, B., Katz, N., Lake, G., Dressler, A. & Oemler, A., Nature, 379, 613
Navarro, J.F., Frenk, C.S. & White, S.D.M., 1995, MNRAS, 275, 56
Olsen, K.A.G., 2001, AJ, in press (astro-ph/9902031)
Poggianti, B.M., Smail, I., Dressler, A., Couch, W.J., Barger, A.J., Butcher, H., Ellis, R.S. & Oemler, A., 1999, ApJ, 518, 576
Press, W.H. & Schechter, P. 1974, ApJ, 187, 425
Rocha-Pinto, H.J., Maciel, W.J., Scalo, J. & Flynn, C., 2000, ApJ, 531, 115
Roukema, B.F., Peterson, B.A., Quinn, P.J., Rocca-Volmerange, B., 1997, MNRAS, 292, 835
Shectman,S.A., Landy, S.D., Oemler, A., Tucker, D.L., Lin, H., Kirshner, R.P. & Schechter, P.L., 1996, ApJ, 470, 172
Somerville, R.S. & Kolatt, T.S., 1999, MNRAS, 305, 1
Somerville, R.S. & Primack, J.R., 2000, MNRAS, 310, 1087
Somerville, R.S., Primack, J.R. & Faber, S.M., 2001, MNRAS, 320, 504 (SPF)
Springel, V. , White, S.D.M., Tormen, G. & Kauffmann, G., 2001, MNRAS submitted (astro-ph/0012055)
Sullivan, M., Treyer, M.A., Ellis, R.S., Bridges, T.J., Milliard, B. & Donas, J., 2000, MNRAS, 312, 442
Tolstoy, E., 2000, preprint (astro-ph/0010028)
Tormen, G., Diaferio, A. & Syer, D., 1998, MNRAS, 299, 728
van den Hoek, L.B., de Blok, W.J.G., van der Hulst, J.M. & de Jong, T., 2000, A&A, 357, 397
van Kampen, E., Jiminez, R. & Peacock, J.A., 1999, MNRAS, 310, 43
van Zee, L., Haynes, M.P. & Salzer, J.J., 1997, AJ, 114, 2479
Wang, B. & Heckman, T.M., 1996, ApJ, 457, 645
Whitmore, B.C., Zhang, Q., Leitherer, C., Fall, S.M., Schweizer, F. & Miller, B.W., 1999, AJ, 118, 1551
Worthey, G., Faber, S.M., Gonzalez, J.J. & Burstein, D., 1994, ApJS, 94, 687
Worthey, G. & Ottaviani, D.L., 1997, ApJS, 111, 377
Yee, H,K,C., Ellingson, E. & Carlberg, R.G., 1996, ApJS, 102, 269
York, D.G., Adelman, J., Anderson J.E., Anderson, S.F., Annis, J., Bahcall, N.A., Bakken, J.A., Barkhouser, R. et al, 2000, AJ, 120, 1579
Zabludoff, A.I., Zaritsky, D., Lin, H., Tucker, D., Hashimoto, Y., Shectman, S.A., Oemler, A. & Kirshner, R.P, 1996, ApJ, 466, 104
Table 1: The parameters for the models
| (Gyr) | ||
| Model Q | 0 | 1 |
|---|---|---|
| Model A | 10 | 1 |
| Model B | 100 | 1 |
| Model C | 10 | 0.4 |