Disk/corona model of the mean spectra of radio-quiet and radio-loud QSO
Abstract
We test the disk/corona model of Janiuk et al. (2000) against the composite mean optical/UV/soft X-ray spectrum of radio loud and radio quiet quasars from Laor et al. (1997) which applies to faint quasars. The model well represents the optical/UV continuum if the hardening of the locally emitted spectrum is included, with the color to effective temperature ratio in the inner 20-30 Schwarzschild radii. Comptonization seen in the soft X-ray band is well explained by the adopted corona model in the case of radio loud objects. However, this Comptonization is much stronger in radio quiet objects and additional ad hoc assumed Comptonizing medium must be present. We speculate that perhaps in both types of quasars there is a strong outflow of the hot plasma; this plasma is collimated in radio loud objects but not collimated in the radio quiet objects so it is present along the line of sight, serving as the required Comptonizing medium. Hard X-ray power law is not explained by the model and it may come from non-thermal component of electron plasma, as it is the case for galactic black holes in their soft states.
keywords:
Accretion, accretion disks , Galactic nuclei , Active galaxies , Quasars , Radiation mechanismsPACS:
98.62.Mw , 98.2.Js, 98.54.Cm , 98.54.Aj , 95.30.Gv,
1 Introduction
The standard model of central engine of active galactic nuclei (AGN) consists of a massive black hole, an accretion disk, and a distant molecular torus. A major problem, however, is the location of the source of X-ray emission not expected from this simple picture. X-ray emission carries a significant fraction of the bolometric luminosity. In Seyfert 1 galaxies it is mostly in the form of a hard X-ray power law component with the high energy cut-off at about 100 keV. In Narrow Line Seyfert 1 galaxies and quasars the hard X-ray power law contains much lower fraction of the bolometric luminosity but there is a second component in those sources - large soft X-ray excess - which carries large fraction of the luminosity. This X-ray emission comes from a relatively compact region located not too far from the accretion disk, as suggested by the fast variability in X-ray band and the presence of X-ray reflection component. However, even the extensive monitoring campaigns did not solve yet the problem of exact geometry of this region and, subsequently, of the physical process leading to the formation of the hot plasma.
In the present paper we consider a particular model of the origin of this X-ray emission which is based on physical grounds. It is a model of a hot dissipative corona above an accretion disk, as described by Janiuk & Czerny (2000). This model is based on assumptions that the corona is in hydrostatic and radiative equilibrium with the disk, the rate of energy dissipation in the corona as well as in the disk is proportional to the pressure (total pressure in the disk and gas pressure in the corona) and the spontaneous division of the flow into disk and corona reflects the thermal instability within the irradiated gas, as discussed by Krolik, McKee & Tarter (1981). This model predicts the overall shape of the spectrum optical/UV/X-ray from an accretion flow as a function of the mass of the black hole, an accretion rate and the viscosity parameter . We introduce some modifications to the model and we compare it with the observational data.
One of the source of difficulties in modeling AGN is the fact that significant fraction of the bolometric luminosity is emitted in the unobserved region between far UV and soft X-rays so the bolometric luminosity and the spectral shape of the principal component - Big Blue Bump - are poorly determined for a single object. Therefore, in the present paper we decided to test the model against composite quasar spectra of Laor et al. (1997) which practically bridge the unobserved gap due to combining the spectra coming from objects at various redshifts.
In Section 2 we shortly describe the composite and a theoretical model. Section 3 describes our results. We discuss the results in Section 4. The conclusions are given in Section 5.
2 Method
2.1 Composite spectrum
The mean spectra of radio quiet and radio loud quasars were shown by Laor et al. (1997). They cover a broad frequency range , i.e. they extend from 15 000 Å up to 10 keV.
The mean X-ray spectrum contains the spectra of objects from the Bright Quasar Survey (Shmidt & Green, 1983) with redshift and column density . It was obtained adopting the following cosmological parameters: the Hubble constant equal , the deceleration parameter , and the cosmological constant equal to . These low redshift objects determine the mean spectrum above (200 eV). Below it we have the unobserved range due to the Galactic absorption which extends from to . This range, however, is partially covered from Å to Å () by spectrum from Zheng et al. (1997). This result is based on observations of quasars at high redshifts ().
Final spectrum still contains a relatively short uncovered range. However, the simple extrapolation of the spectra from both sides roughly coincide which strongly suggest that the resulting spectra are a good representation of the broad band spectra of bright radio quiet and radio loud AGN.
2.2 Disk/corona/extended medium structure
We consider a model of stationary accretion flow onto a Schwarzschild, massive black hole which consists of an accretion disk, a hot corona and (optionally) a spherically symmetric extended hot medium. The accretion is ultimately responsible for the emission of the radiation, and the energy is dissipated partially in the disk and partially in the corona. Therefore, the accretion rate, , together with the mass of the central black hole, , are the basic parameters of our model (see also Witt, Czerny & Życki, 1997; Janiuk & Czerny, 2000). The total flux generated in the corona, , and in the disk, , is determined by the standard formula (see e.g. Kato, Fukue & Mineshige, 1998)
| (1) |
where represents the Newtonian boundary condition at the marginally stable orbit
| (2) |
2.2.1 Local disk spectrum
We assume that the disk is relatively cold, geometrically thin and optically thick (i. e. –disk theory, Shakura & Sunyaev, 1973). We approximate the distribution of the angular momentum in the disk and the corona by Keplerian distribution
| (3) |
where is the gravitational constant, – the mass of the black hole and is radial radius of the object. The disk is the source of the soft photons, , which are Comptonized locally in the corona and afterwards, at a greater distance, by the spherical cloud. The flux consists of a flux generated in the disk at any given radius is denoted by and of a fraction of the flux generated in the corona and subsequently intercepted and thermalised in the disk. This flux determines the effective temperature of the disk at a given radius
| (4) |
The spectral shape of this radiation is sometimes approximated as a blackbody. However, when an electron scattering dominate significantly over free-free and bound-free absorption this assumption is not justified. If the number of scattering events is large the saturated Comptonization effect is the most important and it shifts systematically the energy of photons while still preserving a ’black body’ spectral shape. Shimura & Takahara (1995) showed that this is an important effect in AGN accretion disks.
We introduce the spectral hardening factor in such way that the flux can be described by the equation (Shimura & Takahara, 1995)
| (5) |
where is the effective temperature, is the color temperature, and is the Planck function of blackbody.
The value of should come in principle from the radiative transfer computations. However, the results of Shimura & Takahara (1995) were obtained assuming pure hydrogen and helium atmosphere while heavy elements (particularly iron) are very important. Other codes (e.g. Merloni, Fabian & Ross, 2000; Sobczak et al., 1999; Madej & Różańska, 2000) also contain several approximations, mostly concerning the description of bound-free transitions and lines of heavy elements which are essential. It is therefore more convenient to parameterize this effect, compare the results to the data and ’a posteriori’ conclude which theoretical predictions are most appropriate.
This effect is particularly important in the innermost part of the disk where the ionization is the highest but it should become negligible further out. Therefore we assume that the spectral hardening factor is the monotically decreasing function. It decreases from the value at the marginally stable orbit radius to the value further away, at larger than . We use basically a linear function but results obtained with other functional shapes are similar (see Sect. 3).
2.2.2 Local corona
The corona is hot, optically thin and two-temperature (i. e. the ions temperature is much greater than the electrons temperature , as discussed by Shapiro, Lightman & Eardley (1976)). The two-temperature corona model was considered by a number of authors (Haardt & Marashi (1991); Witt, Czerny & Życki (1997); Esin et al. (1997)). Here we follow the formulation of Janiuk & Czerny (2000).
We assume that the coronal plasma is an isothermal medium in the vertical coordinate, , but non-isothermal toward the radial coordinate, (i. e. and ).
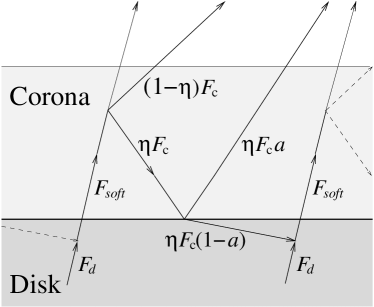
The flux of the soft photons, , produced in the disk is partly Comptonized within the corona and it is partly transmitted throughout. The scattered Comptonized coronal flux, , is partially directed towards the disk, , and partially directed outwards to an observer, , as a hard X-ray and gamma-ray radiation (see Fig. 1). X-ray photons irradiating the disk are partially absorbed and thermalised, contributing to , and partially reflected by the disk surface, depending on the value of the X-ray albedo, . We assume in our calculations that and . Such a formulation of the radiative disk/corona coupling was introduced by Haardt & Marashi (1991).
The local flux is generated by a heating mainly of the ions, because a gravitational energy by accreting gas is transported directly to this particles (Narayan et al., 1998). In this case the flux is proportioned to -viscosity introduced by Shakura & Sunyaev (1973) and the total pressure .
| (6) |
where is the vertical coordinate at the basis of the corona. In our calculate we neglect the coronal radiation pressure and the magnetic pressure, and we employ the results of the vertical integration obtained by Witt, Czerny & Życki (1997, Appendix D). At present
| (7) |
where is the gas pressure at the basis of the corona, is the pressure scale height of the corona given by the ions temperature, , under the assumption of the hydrostatic equilibrium
| (8) |
Such a formulation is independent from the physical mechanism of the corona heating since the scaling with pressure, , may correspond either to the accretion heating by viscosity (Życki et al., 1995; Witt, Czerny & Życki, 1997) or to the magnetic heating (e.g. Svensson & Zdziarski, 1994).
The energy of ions in the corona is immediately transported to electrons through the electron-ion Coulomb interaction. The ions are cooled and this cooling is described by the equation (Shapiro, Lightman & Eardley, 1976)
| (9) |
where is the electron–ion coupling rate and is the Coulomb log. Here the density is related to the corona thickness and its optical depth .
The heated electrons deliver the energy subsequently to photons in the Inverse Compton process. In this way the part of observe/UV/soft X-ray photons emerge to a observator as a hard X-ray radiation. We describe this process as
| (10) |
where is the Compton amplification factor and is the temperature of disk produced the local . We interpolate the factor from the tables prepared in advance from Monte Carlo computations.
The vertical division of the medium into hot corona and relatively cold disk at every radius should not be arbitrary. Indeed, such a division results naturally from the criterion of thermal instability in a irradiated medium studied by Krolik, McKee & Tarter (1981) which naturally develops in the surface layers of an irradiated accretion disk in hydrostatic equilibrium (Różańska & Czerny, 1996).
The ionization stage of the medium is conveniently expressed through a ionization parameter . It is defined as a ratio of the ionization radiation pressure to the gas pressure
| (11) |
The phase transition from cold to hot medium occurs with a transcend of a specific value of the ionization parameter (Begelman, McKee & Shields, 1983).
| (12) |
It scales with the electron temperature and the fraction is the value of the ionization parameter for an inverse Compton temperature of .
The set of equations (3) – (12) allows to calculate the properties of the corona at each radius, as a function of global model parameters, i.e. mass of the central black hole, , the accretion rate, , and the value of viscosity parameter, , in the corona including the electron temperature and the optical depth.
The local spectrum is now computed as a disk spectrum (Eq. 5) Comptonized by the local corona. Comptonization process was calculated using code based on the semi-analytical formulae of Czerny & Zbyszewska (1991) for a slab geometry. This description allows for fast computations on a fine radial grid.
2.2.3 Global disk/corona spectrum
The final spectrum is calculated through the integration of the local spectra over all disk radii. Since the effect of corona is strongly dependent on the radius - it is weak close to the black hole and reaches maximum at a distance about a few hundred , depending on the accretion rate, this integration is essential. It also means that hard X-ray emission comes mostly from the outer parts while weakest Comptonization in the innermost part creates a soft X-ray tail to the local disk spectrum.
2.2.4 Additional Comptonizing cloud
Our corona model is universal in a sense that it does not contain any differentiation between radio loud and radio quiet objects while the composite spectra for the two classes of objects is clearly different.
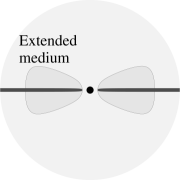
To model such systematic difference we eventually allow for the existence of an additional extended medium (see Fig. 2) with parameters not determined by the accretion rate. This medium may be connected with the observed warm absorber, as a hot medium confining cooler absorbing clouds (Ogle et al., 2000). This cloud has a spherical geometry but we consider also a slab geometry. Physically it is characterized by the Thomson opacity, , and the electrons temperature, . The corona and mainly the disk are the source of soft photons, which are scaterred by the electrons in extended medium. In this case they are visible outward as the additional X-ray radiation.
In this case the Comptonization process is computed once per model so we use an accurate Monte Carlo method. We applied the numerical program, which was written by Gierliński (2000) and which is based on procedures by Górecki & Wilczewski (1984).
Such an accurate method would be too time consuming to apply to the Comptonization by the corona at each radius and it was not really necessary since the final integration over the disk surface (an a range of temperatures and optical depths) smeared any specific Comptonization features even if present in the spectra (mostly first scattering effect).
2.2.5 Hard X-ray radiation
It is generally believed that the hard X-ray radiation in radio-loud objects comes from the jet. The extension of the hard X-ray power law into high energies is not well constrained in quasars so the nature of this emission is not known. The studies of galactic sources in their soft states, however, suggest that in such a spectral state of an accreting black hole the hard X-ray emission comes from the non-thermal tail of electron distribution (e.g. Gierliński et al., 1999, for Cyg X-1).
Therefore, we do not expect that our thermal corona model will explain the hard X-ray radiation. We treat this hard X-ray power law emission as an additional component and we add it to the resulting spectrum adopting the slope and normalization appropriate for radio loud and radio quiet objects separately.
3 Results
3.1 Without extended medium
We first discuss the basic version of the model, i.e. disk plus corona, which is described by the mass of the black hole, , accretion rate, , coronal viscosity parameter, , and two parameters determining the color temperature distribution in the disk: and .
The UV part of the composite spectrum is mostly determined by the first two parameters which govern the total luminosity and the position of the peak on diagram. However, the last two parameters are also important since the multicolor blackbody is too narrow to disk represent the Laor et al. (1997) spectrum adequately.

However, if we allow for the presence of the saturated Comptonization skin in the upper layers of the disk we can represent the spectra adequately.
We describe the radial dependence of the color temperature to the effective temperature ratio through a linear function of value at the marginally stable orbit, dropping to 1 at (see Fig. 3).
Both parameters, and broaden the spectral distribution in the far UV range but the deviation of the shape is somewhat different in those two cases. In Fig. 4 we show the dependence of the spectrum on the maximum value of the color to effective temperature ratio, , and on the extension of the disk skin, (upper and lower part, correspondingly). We also experimented with other functional dependences of the parameter on the disk radius (see Fig. 3) but when the parameters were adjusted to model the data possibly well the differences in the final spectral shapes obtained with different profiles were negligible. Therefore, in further discussion we use always the linear formula.


The value of the viscosity parameter in the corona has no influence on the optical/UV part of the spectrum but it is important for the relative efficiency of the X-ray radiation. We choose it to reproduce the observed level of the soft X-ray emission in the Laor et al. (1997) spectrum possibly well.
The best representation of the observed composite spectrum for radio quiet objects is shown in Fig. 5. The representation of the data is satisfactory in the optical/UV band in the X-ray band, where both the normalization and the slope are well reproduced. The required value of the parameter implies the color to temperature ratio equal 1.85 at .
However, there is a large discrepancy between the predicted shape and the observed shape in the soft X-ray band.

In our model the soft X-ray emission comes from the Comptonization of the disk emission in the innermost part of the flow. Clearly, the coronal strength in this region (i.e. the value of the Compton parameter determined by the temperature and the optical depth) is too low to model well the observations. Since our basic model does not contain additional free parameters apart from the global parameters listed at the beginning of Sect. 3.1 we have no way to increase this effect artificially. It means that additional Comptonization is required, possibly by the extended hot medium.
However, the mean quasar spectrum of radio loud objects in the soft X-ray band is well reproduced by our basic model (see Fig. 6). It means that in this case no extended medium is needed to explain the broad band spectrum.

3.2 Extended medium in radio quiet objects
The model consisting of the disk and corona emission as described in Sect. 2.2 did not account for the observed shape of the composite spectrum of radio quiet quasars in the soft X-ray band. Now we consider a case when the disk/corona system is embedded in an extended hot optically thin cloud.
We fix the parameters of the disk/corona system at the previous values appropriate for radio quiet and radio loud objects, and we add two new parameters: the temperature of the extended medium, , and its optical depth, .
The soft X-ray emission in the composite spectrum of Laor et al. (1997) is not exactly of a power law shape but shows a discontinuity in the slope at . Therefore, if we follow this shape precisely we can determine both parameters of the extended medium independently. This would not be the case if the emission is a single power law since in such case only the slope, and subsequently the combination of the two parameters, is determined. It is difficult to say if this change of slope is real - it is caused by bridging the unobserved gap with a power law. However, the values of and still may be quite representative of the required medium.

The result of this modeling for radio quiet objects is shown in Fig. 7. Not surprisingly, this model well represents the overall spectrum. The hot medium parameters: keV and , respectively.
The exact values of the extended medium parameters depend on the adopted geometry. For a comparison, we also considered a flat configuration for the extended medium. The quality of the data representation is the same. The best values of the and are equal keV and .
4 Discussion
We considered a physically justified model of the disk/corona. The emission from such a system calculated in the simplest direct way did not account for the extended shape of the spectrum in far UV and for the shape of the soft X-ray spectrum in radio quiet and radio loud objects in the composite spectra of Laor et al. (1997).
Two modifications to the simplest picture were necessary: (1) the presence of the hotter disk skin where saturated Comptonization leads to a noticeable difference between the color temperature and the effective temperature at . (2) the presence of the hot extended medium surrounding the disk and the corona in the case of radio-quiet objects.
4.1 The reliability of the composite spectra
Our results depend sensitively on the spectral shape of the composite spectra adopted as the representation of a typical spectrum of radio loud and radio quiet quasar, respectively.
The reliability of the composite spectrum of Laor et al. (1997) may be easily questioned since various types of objects were used to construct two major parts: high redshift quasars () were used by Zheng et al. (1997) to obtain the far UV part and low redshift objects were used to find the soft X-ray part. This was unavoidable since this was the only way to close the observational gap between the two bands. Also the number of objects used to prepare the spectrum () was not very large.
The confidence in the composite may be further decreased by the presence of systematic differences between this composite and other composites in the optical/UV band.

In Fig. 8 we show the comparison of schematically drawn Zheng et al. (1997) composite and the optical part of the Laor et al. (1997) against the Francis et al. (1991; upper panel) and Morris (private communication; middle panel). We see strong flattening in Zheng et al. which lead to the conclusion about high color to effective temperature ratio in quasar accretion disks. Almost no such flattening is present in two other composites: standard black body accretion disk is almost a perfect representation of the data for Francis et al. (see Fig. 17 in the review of Koratkar & Blaes, 1999).
The difference, however, is most probably due to the difference in the studied population of quasars. Francis et al. (1991) sample consists of quasars at and of the bolometric luminosity of order of and Morris composite is based on the same sample while Zheng et al. (1997) part of the Laor composite was based on quasars of bolometric luminosity of order of .
As an argument in favor of this interpretation we plot in Fig. 8 the optical/UV spectrum of PG1211+143 - a radio quiet quasar classified also as NLS1 galaxy. The bolometric luminosity of this object is (Janiuk, Czerny & Madejski, 2001). The shape of this spectrum is noticeably similar to the composite and cannot be modeled with a black body accretion disk. It is definitely flatter in UV than Francis et al. (1991) composite. On the other hand, individual spectra of high redshift, bright quasars show on average much harder spectra, with mean value of the slope of 0.36 (i.e. ) for a total of 24 radio quiet quasars, consistent with Francis et al. (1991), in the observed 1000 - 2000 Å band in quasar rest frame (Scott et al., 2000).
The dependence of the spectral shape on the luminosity state is well known for galactic sources in their high/soft states dominated by the disk emission. Sometimes the soft component is well described as disk black body emission but frequently additional Comptonization of this component is needed, independent from the hard X-ray tail (for a review see e.g. Życki, 2001). We therefore conclude that our results apply to faint or moderately bright quasars, and do not apply to bright quasars.
Unfortunately, we cannot repeat the whole analysis for bright objects. The composite of Francis et al. (1991) appropriate for bright quasars is not supplemented by the X-ray part. The data on single bright objects suggest that the hard X-ray slope (Reeves & Turner, 2000) is similar to that given by Laor et al. (photon index for radio quiet quasars and for radio loud quasars). The relative level of hard X-ray emission in comparison to UV in very bright objects may also be similar: for example, very bright quasar PG 1247+268 has equal to 47.09 at 3000 Å (Neugebauer et al., 1987) and 45.72 at 2 keV (Reeves & Turner, 2000), meaning the same index as determined by Laor et al. (1997). However, the soft X-ray part becomes unconstrained since the soft X-ray excess moved into unobserved range. Therefore, it cannot be used effectively to test the corona model.
4.2 Mean quasar properties
Our disk/corona model implies that the studied quasar sample does not accrete at a rate close to the Eddington limit. The value of the mass of the representative black hole is about for radio loud objects and somewhat lower for radio quiet objects (), and the luminosity to the Eddington luminosity ratio is equal 0.016 and 0.022, correspondingly, for a non-rotating black hole and pure hydrogen plasma. This ratio is rather low, typical for Seyfert 1 galaxies, only the mass of the black hole and consequently, the luminosity is proportionally higher. This result is a direct consequence of the high color to effective temperature ratio since roughly
| (13) |
Disk blackbody fits would therefore indicate the ratios 3-4 times higher but we did not find them satisfactory in case of Laor et al. (1997) composite. Our value of the black hole mass agrees with the value obtained by Kawaguchi et al. (2000) since the model contained similar color to effective temperature ratio. Their accretion rate for radio quiet quasars is slightly higher () because their model effectively accounted also for the soft X-ray excess, although at the expense of arbitrary assumptions about the corona properties.
Fits to Francis et al. (1991) composite would give similar value of the black hole mass (see e.g. Koratkar & Blaes, 1999) but much higher accretion rate, and the ratio closer to 1.
The value of the viscosity parameter determined from the model () is reasonable. Similar values are derived for accretion disks in cataclysmic variables (e.g. Smak, 1999) and in galactic X-ray novae during outburst (e.g. Lasota, 2001). Models of fast variability of the microquasar GRS 1915+105 under the influence of radiation pressure instability suggest somewhat smaller value, (Janiuk, Czerny & Siemiginowska, 2000). Determinations available for AGN based on the observed optical variability supposed to correspond to thermal timescale give rather weak constraints (, Siemiginowska & Czerny, 1989; , Webb & Malkan, 2000).
The value of the viscosity parameter is essential from the point of view of the inner boundary condition of an accretion disk. Low values, below 0.1, are consistent with the standard description of the accretion in the vicinity of the marginally stable orbit while leads to a considerable loss of angular momentum below the marginally stable orbit due to the type of the sonic point (Muchotrzeb-Czerny, 1986; Kato, Fukue & Mineshige, 1998) or strong magnetic field (Krolik, 1999; Reynolds, Armitage & Chiang, 2001). Determined values are just at the border.
4.3 Disk skin
Large color to temperature ratio required by the data is an interesting issue since it requires low level of absorption and strong dominance of the disk atmosphere by electron scattering.
Significant ionization of the disk surface at small radii is not unexpected. The observation of the X-ray reflected component is a complementary way to estimate the disk opacity close to the surface observationally (for a review, see Mushotzky, Done & Pounds, 1993). Although the study of quasars are much more difficult than the study of Seyfert galaxies Nandra et al. (1997) and recently Reeves & Turner (2000) were able to determine the iron line properties on the basis of ASCA data. The line energy is at keV for objects of the brightness comparable to those in the composite spectrum, which corresponds to the value of the ionization parameter about a few hundred (e.g. Życki & Czerny, 1994). The medium at the temperature K and optical depth is expected to develop under moderate external irradiation by the (non-thermal?) hard X-ray component since the temperature corresponds to an Inverse Compton temperature for effectively soft total radiation field (e.g. Czerny & Dumont, 1998; Nayakshin, Kazanas & Kallman, 2000).
However, such a skin will result in very weak Comptonization effect, and in particular, it will not change the color temperature of the Big Blue Bump peak. To explain the color to effective temperature ratio of about 2 we need a thick layer () remaining at the color temperature due to some heating and due to cooling by saturate Comptonization. The absorption in this zone should be negligible - otherwise the temperature would drop down to the effective temperature.
The results of Shimura & Takahara (1995) as well as Kawaguchi, Shimura & Mineshige (2000) predict such a strong Comptonization because the computations do not contain bound-bound and bound-free transitions which are efficient coolants at the discussed temperatures, particularly oxygen, carbon and iron lines are important. Computations of irradiated media including those transitions do not show the color to effective temperature ratio in the thermalised emission significantly different from 1 (e.g. Madej & Różańska, 2000; Nayakshin et al., 2000; Dumont et al., 2001). The required level of ionization for efficient Comptonization seems to be higher than naturally predicted in an irradiated medium. Similar problem was found by Czerny & Życki (1994) when they tried to explain the universal position of the soft X-ray excess as the reflection feature from the weakly ionized medium. The presence of the heavy corona further suppresses the ionization level at the disk surface if the corona is in the hydrostatic equilibrium with the disk (Różańska et al., 1999).
It is possible that the effect is caused by significant generation of the energy close to the disk surface. Such an enhanced generation was not included in the performed radiative transfer computations. It would mean that the vertical distribution of heat generation is not well parameterized by the prescription and the magnetic field may be responsible for such a global redistribution.
On the other hand, the conclusion on the large color to effective temperature ratio relies strongly on the shape of the composite spectrum in UV – far UV band which still has to be tested (see Sect. 4.1).
4.4 Soft X-ray discrepancy for radio-quiet objects
The adopted corona model adequately described the soft X-ray part of the composite spectrum for radio loud objects. Low optical depth of the corona and a broad electron temperature range predicted by the model at different radii was adequate to give the observed effect of moderate Comptonization.
However, in this model the Comptonization is definitely too weak to account for the soft X-ray spectrum of radio quiet objects. Similar modeling of the composite spectrum of radio quiet objects was performed by Kawaguchi, Shimura & Mineshige (2000) and in their case the modeling was successful. This was caused by the fact that in their approach the fraction of the energy dissipated in the corona and the optical depth of the corona at a given radius were free parameters of their model. In our corona model the radial distribution of those quantities were calculated from the global parameters (black hole mass, accretion rate and viscosity parameter) since the spontaneous division of the flow into the disk and corona part results from the cooling properties of the material in the optically thin and optically thick part. As a result, our corona was never as thick as assumed by Kawaguchi et al., independently from the assumed viscosity parameter.
Our corona model, adopted after Janiuk & Czerny (2000), contained several simplifications. However, recent progress in corona modeling does not seem to improve the situation. If the corona is assumed to be accreting, and the advection is included, the corona above a disk is even weaker than in our description (Janiuk, Życki & Czerny, 2000). Better description of the disk/corona transition and replacement of Eqs. 11–12 with the disk evaporation condition due to the electron conduction (Różańska & Czerny, 2000a) leads again to the prediction of still weaker corona for high accretion rates (Różańska & Czerny, 2000b). On the other hand, the presence of the magnetic field may weaken the efficiency of the conduction and reduce the condensation effect found in the innermost part of the disk accreting at a high rate.
Although a theory did not say its last word on this subject as the formation of the corona is a badly understood process it may suggest that actually the disk corona is too weak to produce the soft X-ray spectrum of radio quiet quasars and the existence of the additional Comptonizing medium may be necessary.
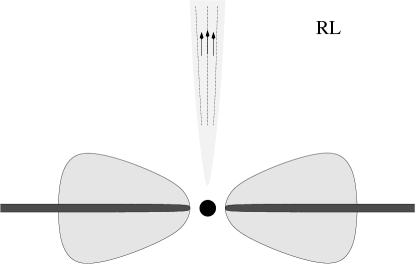
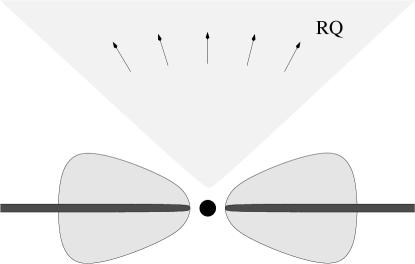
The comparison of the radio loud objects and radio quiet objects may suggest that the outflow takes place in all types of AGN (for a review, see e.g. Veilleux et al., 2000). In radio loud objects the outflow is collimated in a form of jet, so the jet contributes to the hard X-ray emission but generally it does not cover our line of sight to the most part of the accretion flow. The mechanism of this collimation and its distance from the black hole is still under debate (e.g. Sikora, 2001). In radio quiet objects the outflow perhaps is not collimated so the outflowing plasma is in our line of sight and Comptonizes the disk/corona emission. We show such a putative geometry in Fig. 9.
Some kind of outflow is frequently predicted by the corona models or two-dimensional computations of the accretion flow (e.g. Begelman, McKee & Shields, 1983; Meyer & Meyer-Hofmeister, 1994; Igumenschev, 2000; Turolla & Dullemont, 2000). However, the estimate of the amount of outflowing mass and its physical conditions is difficult and no predictions differentiating between the radio loud and radio quiet objects are available within the frame of this approach. The properties of the outflowing material may significantly depend on the considered distance from the black hole as well as the inclination angle which further complicates the issue (e.g. Elvis, 2000).
4.5 Observational tests - soft X-ray emission lines
The dominant role of the Comptonization in formation of the soft X-ray spectra implies that no strong emission lines are expected in this band. On the other hand, models of coronal flares predict that a significant fraction of the disk is not covered by the corona but it is strongly irradiated. Such irradiated internally not heated layers are the source of rich emission line spectrum in soft X-ray band (e.g. Nayakshin, Kazanas & Kallman, 2000) since the hot layer is optically thin due to thermal instability in the heated/cooled plasma (Krolik et al., 1981; Różańska & Czerny, 1996).
High resolution observations were performed so far in the case of a few Seyfert 1 galaxies, and the results were not definite: Branduardi-Raymond et al., (2000) claimed that broad oxygen, nitrogen and carbon emission lines, of similar shape to iron line, are present in the XMM-Newton spectra of MCG-6-30-15 and Mrk 766 while Lee et al. (2001) argue that they see only the warm absorber effect on the continuum in the Chandra spectrum of MCG-6-30-15. More detailed analysis of new XMM and Chandra data should resolve this issue.
5 Conclusions
-
•
disk/corona model of Janiuk & Czerny (2000) based on thermal instability well describes the composite spectrum of radio loud faint quasars in the optical-soft X-ray band if the color to effective temperature ratio is close to 2 in the innermost part of the disk
-
•
adopted disk/corona model does not account for the soft X-ray spectrum in radio quiet faint quasars and additional Comptonizing medium is required, possibly due to the uncollimated outflowing hot plasma
Acknowledgements
We thank Paul Francis and Simon Morris for providing us with their composite spectra and Jill Bechtold and Adam Dobrzycki for the HST data of PG1211 used in Fig. 8. We thank also Marek Gierliński for his computer program and helpful discussion.
This work was supported in part by grant 2P03D01816 of the Polish State Committee for Scientific Research.
M. Nikolajuk would like to thank Prof. Dr T. Trojanowski and Dr E. Maziarz from the Neuro surgical Wards of the Clinical Hospital in Lublin and dedicate this paper to P. Sarzala (coma) and to memory of M. Kalicki (cancer).
References
- Begelman, McKee & Shields (1983) Begelman, M.C., McKee, C.F., & Shields, G.A., 1983, ApJ, 271, 70
- Bechtold et al. (2001) Bechtold, J., Dobrzycki, A., Wilden, B., Morita, M., Scott, J., Dobrzycka, D., Tran, K.-V., & Aldcroft, T., 2001 (to be submitted to ApJS)
- Branduardi-Raymond et al. (2000) Branduardi-Raymond, G., Sako, M., Kahn, S. M., Brinkman, A. C., Kaastra, J. S., & Page, M.J., 2000, astro-ph/0011167
- Czerny & Dumont (1998) Czerny, B., & Dumont, A.-M., 1998, A&A, 338, 386
- Czerny & Zbyszewska (1991) Czerny, B., & Zbyszewska, M., 1991, MNRAS, 249, 634
- Czerny & Życki (1994) Czerny, B., & Życki, P. T., 1994, ApJL, 431, L5
- Dumont et al. (2001) Dumont, A.-M., Czerny, B., Collin, S., & Mouchet, M., 2001, (to be submitted to A&A)
- Elvis (2000) Elvis, M., 2000, ApJ, 545, 63
- Elvis et al. (1994) Elvis, M., Wilkes, B.J., McDowell, J.C., Green, R.F., Bechtold, J., Willner, S.P., Oey, M.S., Polomski, E., & Cutri, R., 1994, ApJS, 95, 1
- Esin et al. (1997) Esin A.A., McClintock, J.E., & Narayan, R., 1997, ApJ, 489, 865
- Francis et al. (1991) Francis, P. J., Hewett, P. C., Foltz, C. B., Chaffee, F. H., Weymann, R. J., & Morris, S. L., 1991, ApJ, 373, 465
- Gierliński (2000) Gierliński, M., 2000, Ph. Thesis
- Gierliński et al. (1999) Gierliński, M., Zdziarski, A.A., Poutanen, J., Coppi, P.S., Ebisawa, K., & Johnson, W.N., 1999, MNRAS, 309, 496
- Górecki & Wilczewski (1984) Górecki, A., & Wilczewski, W., 1984, Acta Astr., 34, 141
- Haardt & Marashi (1991) Haardt, F. & Maraschi, L., 1991, ApJ, 380, L51
- Igumenschev (2000) Igumenshchev, I.V., 2000, MNRAS, 314, 54
- Janiuk & Czerny (2000) Janiuk, A., & Czerny, B., 2000, NewA, 5(1), 7
- Janiuk, Czerny & Madejski (2001) Janiuk, A., Czerny, B., & Madejski, G.M., 2001, ApJ (submitted)
- Janiuk, Czerny & Siemiginowska (2000) Janiuk, A., Czerny, B., & Siemiginowska, A., 2000, ApJ, 542, 33
- Janiuk, Życki & Czerny (2000) Janiuk, A., Życki, P.T., & Czerny, B., 2000, MNRAS, 314, 364
- Kato, Fukue & Mineshige (1998) Kato, S., Fukue, J., & Mineshige, S., 1998, Black-Hole Accretion Disks, Kyoto Univ. Press, Kyoto
- Kawaguchi, Shimura & Mineshige (2000) Kawaguchi, T., Shimura, T., & Mineshige, S., 2000, NewAR, 44, 443
- Koratkar & Blaes (1999) Koratkar, A., & Blaes, O., 1999, PASP, 111, 1
- Krolik (1999) Krolik, J.H., 1999, ApJ, 515, L73
- Krolik, McKee & Tarter (1981) Krolik, J.H., McKee, C.F., & Tarter, C.B., 1981, ApJ, 249, 422
- Laor et al. (1997) Laor, A., Fiore, F., Elvis, M., Wilkes, B.J., & McDowell, J.C., 1997, ApJ, 477, 93
- Lasota (2001) Lasota, J.-P., 2001, astro-ph/0102072
- Lee et al. (2001) Lee, J.C., Ogle, P.M., Canizares, C.R., Marshall, H.L., Schultz, N.S., Morales, R., Fabian, A.C., & Iwasawa, K., 2001, astro-ph/0101065
- Madej & Różańska (2000) Madej, J., & Różańska, A., 2000, A&A, 363, 1055
- Merloni, Fabian & Ross (2000) Merloni, A., Fabian, A.C., & Ross, R.R., 2000, MNRAS, 313, 193
- Meyer & Meyer-Hofmeister (1994) Meyer, F., & Meyer-Hofmeister, E., 1994, A&A, 288, 175
- Muchotrzeb-Czerny (1986) Muchotrzeb-Czerny, B., 1986, Acta Astr., 36, 1
- Mushotzky et al. (1993) Mushotzky, R.F., Done C., & Pounds, K.A., 1993, ARA&A, 31, 717
- Nandra et al. (1997) Nandra, K., George, I.M., Mushotzky, R.F., Turner, T.J., & Yaqoob, T., 1997, ApJ, 488, L91
- Narayan et al. (1998) Narayan, R., Mahadevan, R., & Quataert, E., 1998, in: M.A. Abramowicz et al. (eds.) Theory of Black Hole Accretion Disks, Cambridge University Press, p148
- Nayakshin, Kazanas & Kallman (2000) Nayakshin, S., Kazanas, D., & Kallman, T.R., 2000, ApJ, 537, 833
- Neugebauer et al. (1987) Neugebauer, G., Green, R.F., Matthews, K., Schmidt, M., Soifer, B.T., & Bennett, J., 1987, ApJS, 63, 615
- Ogle et al. (2000) Ogle, P.M., Marshall, H.L., Lee, J.C., & Canizares, C.R., 2000, ApJ, 545, L81
- Poutanen & Svensson (1996) Poutanen, J., & Svensson. R., 1996, ApJ, 470, 249
- Reynolds et al. (2001) Reynolds, C.S., Armitage, P.J., & Chiang, J., 2001, astro-ph/0102045
- Reeves & Turner (2000) Reeves, J.N., & Turner, M.J.L., 2000, MNRAS, 316, 234
- Różańska & Czerny (1996) Różańska, A., & Czerny, B., 1996, Acta Astr., 46, 233
- Różańska & Czerny (2000a) Różańska, A., & Czerny, B., 2000a, MNRAS, 316, 473
- Różańska & Czerny (2000b) Różańska, A., & Czerny, B., 2000b, A&A, 360, 1170
- Różańska et al. (1999) Różańska, A., Czerny, B., Życki, P.T., & Pojmański, G., 1999, MNRAS, 305, 481
- Scott et al. (2000) Scott, J., Bechtold, J., Dobrzycki, A., & Kulkarni, V.P., 2000, ApJS, 130, 67
- Shakura & Sunyaev (1973) Shakura, N.I., & Sunyaev, R.A., 1973, A&A, 24, 337
- Shapiro, Lightman & Eardley (1976) Shapiro, S.L., Lightman, A.P., & Eardley, D.M., 1976, ApJ, 204, 187
- Shimura & Takahara (1995) Shimura, T., & Takahara, F., 1995, ApJ, 445, 780
- Shmidt & Green (1983) Shmidt, M., & Green, R.F., 1983, ApJ, 269, 352
- Sikora (2001) Sikora, M., 2001, in Blazar Demographics and Physics, ASP Conference Series, eds. C.M. Urry and P. Padovani
- Siemiginowska & Czerny (1989) Siemiginowska, A., & Czerny, B., 1989, MNRAS, 239, 289
- Smak (1999) Smak, J., 1999, Acta Astr., 49, 391
- Sobczak et al. (1999) Sobczak, G.J., McClintock, J.E., Remillard, R.A., Bailyn, C.D., & Orosz, J.A., 1999, ApJ, 520, 776
- Svensson & Zdziarski (1994) Svensson, R., & Zdziarski, A.A., 1994, ApJ, 436, 599
- Turolla & Dullemont (2000) Turolla, R., & Dullemont, C.P., 2000, ApJ, 531, L49
- Veilleux et al. (2000) Veilleux, S., Cecil, G., Bland-Hawthorn, J., & Shopbell, P.L., 2000, Rev.Mex.AA (in press)
- Webb & Malkan (2000) Webb, W., & Malkan, M., 2000, ApJ, 540, 652
- Witt, Czerny & Życki (1997) Witt, H.J., Czerny, B., & Życki, P.T., 1997, MNRAS, 286, 848
- Zheng et al. (1997) Zheng, W., Kriss, G.A., Telfer, R.C., Grimes, J.P., & Davidsen, A.F., 1997, ApJ, 475, 469
- Życki (2001) Życki P.T., 2001, Proc. of COSPAR (astro-ph/0101066)
- Życki et al. (1995) Życki, P.T., Collin-Souffrin, S., & Czerny, B., 1995, MNRAS, 277, 70
- Życki & Czerny (1994) Życki, P.T., & Czerny, B., 1994, MNRAS, 266, 653