First results from the Isaac Newton Telescope Wide Angle Survey: The z5 quasar survey
Abstract
We report the first results of an observational program designed to determine the luminosity density of high redshift quasars (z5 quasars) using deep multi-colour CCD data. We report the discovery and spectra of 3 i21.5 high redshift (z4.4) quasars, including one with z5. At z=5.17, this is the fourth highest redshift quasar currently published. Using these preliminary results we derive an estimate of the MB25.0 (MAB145024.5) quasar space density in the redshift range 4.8z5.8 of 3.62.5 Mpc-3. When completed the survey will provide a firm constraint on the contribution to the ionizing UV background in the redshift range 4.55.5 from quasars by determining the faint end slope of the quasar luminosity function. The survey uses imaging data taken with the 2.5m Isaac Newton Telescope as part of the Public Isaac Newton Group Wide Field Survey (WFS). This initial sample of objects is taken from two fields of effective area 12.5deg2 from the final 100deg2.
keywords:
galaxies: active, quasars: general1 INTRODUCTION
The identification and study of quasars at high redshift provides key diagnostic information on the early Universe. Over the last few years the relationship between high redshift quasars and local galaxies has been given an impetus from the realization that quiescent black holes may lie at the centre of all local bulges including the Milky Way (e.g. Magorrian etal, 1998). The formation and evolution of massive black holes is fast becoming a main stream topic in theories of galaxy formation and evolution (Haehnelt, Natarajan and Rees [1998]; Kauffmann and Haehnelt [2000]).
High redshift quasars are also an important contributor to the UV radiation field in the early Universe. Specifically the lack of an optically thick, Gunn-Peterson trough in the spectra of high redshift objects (e.g. Songaila, Hu, Cowie, McMahon [1999]). implies that the Universe is highly ionized at z5.5. Estimates by Madau[1999] indicate that if the ionization is due to starlight the inferred star formation rate at z=5 must be comparable to or greater than the observed value at z=3. The direct detection of galaxies at z3 via the Lyman Break technique and the detection of measurable Lyman continuum photons that escape these galaxies (Steidel, Pettini and Adelberger [2001]) has raised a question over whether quasars or galaxies are the origin of the UV photons that re-ionized the Universe at z6. Recent theoretical work (Miralda-Escude, Haehnelt and Rees [1998]; Madau, Haardt and Rees [1999]) indicates that a Gunn-Peterson trough should be present by z6. A major uncertainty in all of this work is a measure of the ionizing background from quasars. The current uncertainty in the contribution of quasars to the UV background is predominantly caused by the unconstrained faint end of the luminosity function.
The resent discovery of several z5 quasars by the Sloan Digital Sky Survey (SDSS Fan et al. [2001]) will constrain the bright end (i20.0) of the high redshift luminosity function. We are undertaking a survey 1-2 magnitudes fainter than the SDSS program with the aim of constraining the space density and evolution of lower luminosity quasars where the majority of the ionizing flux arises. In this paper we present results from the first 10deg2 of our survey. Unless stated otherwise we use conventional Vega magnitudes and H50 km s-1 Mpc-1, q0=0.5.
2 Survey imaging data


We are using data from the Isaac Newton Telescope(INT) Wide Angle Survey (WAS) (McMahon et al. [2000]; http://www.ast.cam.ac.uk/wfcsur/. The survey is carried out with the prime focus Wide Field camera (WFC; Ives,Tulloch and Churchill [1996]) at the 2.5m INT. The WFC consists of a close packed mosaic of 4 thinned EEV42 2kx4k CCDs. with a pixel size of 13.5 m corresponding to 0.33”/pixel and effective field of view of 0.25deg2. The survey consists of single 600secs exposures in 5 wavebands () over an area 100deg2 to a nominal 5 limiting magnitude(Vega) of 23, 25, 24, 23 and 22 respectively.
The CCD mosaic data from all survey runs is pipeline processed in Cambridge (Irwin and Lewis [2000]) to produce photometrically and astrometrically calibrated images (rms(internal)=0.1”), and morphologically classified merged multicolour catalogues. A preliminary photometric calibration has been applied to the data to the 0.1 magnitude level. For the current work we have only used data with seeing of 1.67 arcsec (FWHM of 5 pixels) and stellar ellipticity (due to trailing) of better than 0.2 since this defines a practical upper limit for reliable image morphological classification. The current quasar candidate sample has a magnitude limit of or 21, the practical limit for acceptable signal-to-noise spectra with a 4m class telescope in 1800 seconds of observation.
At the time of the spectroscopic follow–up observations in June 2000, object catalogues for data taken between August 1998 and October 1999 were available. This data is taken from two regions of the survey. The first region covers the ISO ELAIS N1 field at J1610+5430 (Oliver et al. [2000]), the second region is in the vicinity of at J2240+0000. A total area of 12.5 deg2 has been used.
| Vega system magnitudes | ||||||||||
|---|---|---|---|---|---|---|---|---|---|---|
| Object | z | RA (J2000) Dec | MAB(1450) | |||||||
| wfsj224524.2+002414 | 5.17 | 22 45 24.28 | +00 24 14.6 | 23.01 | 24.89 | 23.96 | 21.43 | 21.19 | -24.9 | -24.3 |
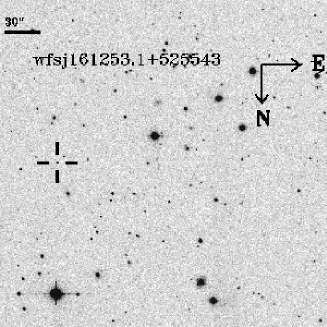
| wfsj161253.1+525543 | 4.95 | 16 12 53.11 | +52 55 43.5 | 23.00 | 25.12 | 22.21 | 20.15 | 19.89 | -26.1 | -25.6 |
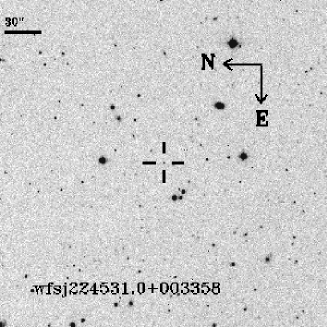
| wfsj224531.0+003358 | 4.45 | 22 45 31.00 | +00 33 58.6 | 23.09 | 24.89 | 21.60 | 20.87 | 20.36 | -25.5 | -25.0 |
3 Colour selection of candidates
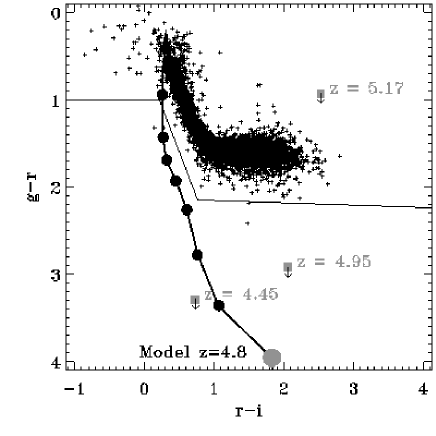
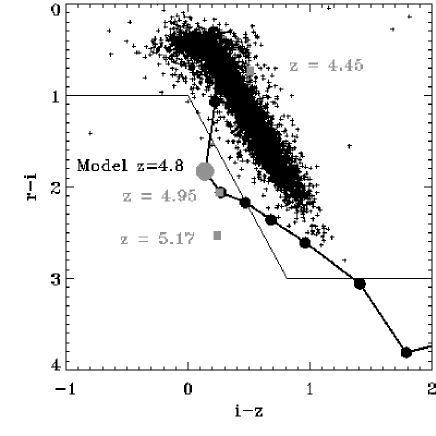
Figure 1 shows colour-colour plots for INT WFS data in the bands with the predicted quasar tracks as a function of redshift overplotted. These colour tracks were computed assuming an underlying quasar spectrum based on a power law with spectral index () and with an emission line spectrum based on the composite spectrum of Vanden Berk et al. [2001]. The absorption model for the intervening Lyman- forest is taken from Madau(1995). The stellar main sequence is clearly visible as the heavily populated strip in the centre of the plots.
Candidate high redshift objects are selected from the multi colour data by selecting all objects that obey a set of colour criteria. To establish these criteria the stellar locus in the colour-colour diagrams has been approximated using piecewise linear fits in the colour space. These fits are then used to establish the boundaries indicated in Figure 1.
Once selected by one of these colour criteria all 5 ugriz images of an object are then visually examined to check the validity of the photometry. This step is required to identify spurious sources such as objects in the diffraction spikes of bright stars or satellites and asteroids that have moved significantly between observations. Candidate z5 quasars are selected using the riz diagram whereas 4z5 candidates are selected from the gri colour diagram. At the current time the followup of the lower redshift sample is incomplete due to limited spectroscopic time.
| Object | z | Lyman- | C IV | |||||
|---|---|---|---|---|---|---|---|---|
| Peak (z) | Cent.(z) | EWobs | EWrest | Cent.(z) | EWobs | EWrest | ||
| wfsj22450024 | 5.17 | 7498Å (5.17) | 7450Å (5.16) | 594Å | 115Å | |||
| wfsj16125255 | 4.95 | 7237Å (4.95) | 7318Å (5.00) | 470Å | 79Å | 9112Å (4.88) | 308Å | 52Å |
| wfsj22450033 | 4.45 | 6628Å (4.45) | 6634Å (4.46) | 276Å | 51Å | 8400Å (4.42) | ||
4 Spectroscopic observations
Spectroscopic observations were obtained in two nights (29th and 30th of June 2000) using the red arm of the ISIS dual beam spectrograph on the 4.2 meter William Hershel Telescope on La Palma. The R158R grating was used with the TeK4 CCD giving a spectral resolution of 2.90Å per pixel and wavelength coverage of 2970Å. Initially a central wavelength of 7900Å was selected but during observations it became apparent that a useful spectrum could not be taken of faint objects longward of 9000Å due to strong night sky line emission and so a central wavelength of 7500Å was subsequently used.
The slit width was matched to the seeing which varied over the course of the observing run in the range 0.8”–1.2”. During the periods of poorer seeing(1”) brighter candidate objects were observed. These generally proved to be low mass late M and early L stars as expected. Conditions were photometric throughout the run and observations of the spectrophotometric standards HZ 44, Ross 640 and LDS 749B (ING identifiers sp1321+363, sp1626+368 and sp2129+000) were used to flux calibrate the data. Wavelength calibration was carried out using a mixture of arc spectra and night sky lines.
Each observation was taken as a series of 900 second exposures and coadded to improve cosmic ray rejection. Total exposure times range from 900–2700 seconds. Several candidate objects could be identified as late M and early L dwarf stars after only a single 900 second exposure. Observation of these objects was truncated reducing the time spent observing non-quasar candidates.
5 Confirmed high redshift quasars
The identification spectra of the confirmed high redshift (z4.4) quasars are shown in Figure 2 and the emission line properties are presented in Table 2. Absolute B(Vega) band magnitudes and AB magnitudes at a rest-frame wavelength of 1450Å have been determined from the band magnitudes assuming a power law spectral index of -0.5. We use the band since it is unaffected by the Lyman- forest or any strong emission lines.
Redshift determination for high redshift objects is complicated since in many spectra the only strong line visible is Lyman-(1215.7Å). This is often blended on the red side with N V emission(1240.1Å) in quasar spectra and has an asymmetric profile due to absorption of the blue wing of the line by the Lyman- forest. The onset of this absorption of the blue wing of the line is quite abrupt and we take this as our redshift estimate for the quasars.
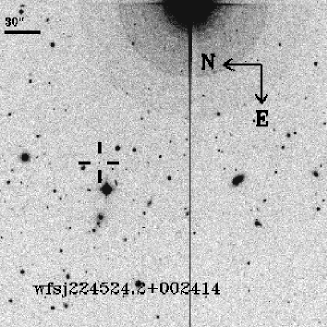
wfsj224524.2+002414 At z5.17, this is currently the fourth highest redshift quasar known. This faint object is identified by the strong Lyman- line at 7498Å and the break in the continuum across the line due to Lyman- forest absorption. Lyman- shows a highly irregular profile with strong absorption features within the line. A strong absorption feature is also at the expected wavelength of N V emission redward of Lyman-.
wfsj161253.1+525543 This object shows a broad emission feature interpreted as a blend of Lyman- and N V. The wavelength of any associated C IV emission line is in a region of the spectrum heavily effected by emission from the night sky making detection of an emission feature difficult. At z=4.95 this quasar is the seventh highest redshift quasar known.
wfsj224531.0+003358 Strong Lyman- emission dominates the spectra of this object. Two clear absorption features, characteristic of the class of Broad Absorption line (BAL) quasars, are seen associated with N V and C IV emission lines.
The FIRST and NVSS radio surveys (Becker et al. [1995]; Condon et al. [1998]) cover our survey regions and no radio emission with 1mJy(5) is detected for these quasars. There is also no evidence for X-ray emission from ROSAT All Sky Survey or PSPC pointed phase observations.
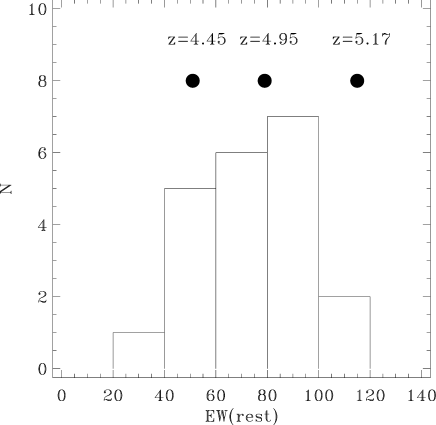
Figure 3 shows the equivalent width distribution of Lyman- for the SDSS z4.4 quasars compared with our new quasars. Despite the strength of the line in our z=5.17 quasar it is comparable with the strongest lined objects in the SDSS sample.

6 Discussion and conclusions
The majority of the 250 z4 quasars that are currently known (see http://www.ast.cam.ac.uk/~quasars) have been discovered using photographic plates but despite the relative ease with which z4 quasars can be discovered (e.g. Storrie-Lombardi et al. [2000] and refs therein) for almost a decade the highest redshift object known was the optically selected quasar PC12473406 with z=4.89 (Schneider etal, 1991). The addition of the band to multi-colour surveys has changed this. The first quasars with z4.9 was discovered by Fan et al. [1999] using SDSS data in the griz bands. In this paper we report two new quasars at z4.9 bringing the total sample of published quasars with redshift z4.9 to nine, of which 6 have z5 (see Table 3).
We use our sample to make the first estimate of the space density of low luminosity quasars at z5. Figure 4 shows the completeness of our survey with redshift. At the current magnitude limit for the spectroscopic sample the survey is not sensitive to photometric errors and so there is no magnitude effect on completeness. This has been computed using the approach described in Fan et al. [2001] where we use the Madau(1995) IGM model and an intrinsic unabsorbed quasar spectrum with a power law continuum spectrum with a gaussian distribution of spectral indices (mean=0.5; dispersion(=0.3) and an contribution from emission lines. The relative emission lines strengths are taken from the SDSS composite quasar spectrum (Vanden Berk et al. [2001]) normalised to a Lyman- line strength distribution (Rest frame Equivalent Width: Gaussian with mean 92.91 and sigma 24.0) from Wilkes et al. (1986). Using this completeness we calculate the effective volume assuming H50 km s-1 Mpc-1, q0=0.5.
The INT WFS is ongoing and to date 10% of the final survey imaging data has been investigated for candidate quasars. The final survey is expected to contain 10–20 high redshift (z5) low luminosity quasars (21.5 and should therefore constrain the luminosity density to 20%. This statistically significant sample of low luminosity quasars will allow the determination of the faint end slope of the quasar luminosity function and the break point in the distribution (analogue to L∗ for galaxies). This break point is required to allow estimation of the contribution of quasars to the ionizing UV background at high redshift. Our results, when combined with shallower surveys such as the SDSS, will allow detailed studies of the AGN phenomenon at high redshift over a range of UV luminosities. Our knowledge of the relationship between accretion and the formation of black holes and galaxies will then not rely purely on the properties of the rare extreme luminosity quasars.
| Name | z | Mag | Ref | |||
| MB | ||||||
| wfsj2245.60024 | 5.17 | 23.96 | 21.43 | 21.19 | -24.9 | 1 |
| wfsj1612.75255 | 4.95 | 22.21 | 20.15 | 19.89 | -26.1 | 1 |
| SDSS10440125 | 5.80 | 22.83 | 21.40 | 18.67 | -27.5 | 2 |
| RD J03010020 | 5.50 | 26.2 | 23.38 | 22.84 | -23.4 | 3 |
| SDSSp J12080010 | 5.27 | 22.66 | 20.37 | 20.17 | -26.0 | 4 |
| SDSSp J12040021 | 5.03 | 20.72 | 18.89 | 18.56 | -27.5 | 5 |
| SDSSp J03380021 | 5.00 | 21.61 | 19.54 | 19.19 | -26.8 | 6 |
| SDSSp J16050112 | 4.92 | 22.42 | 19.36 | 19.37 | -26.6 | 5 |
| SDSSp J02110009 | 4.90 | 21.97 | 19.51 | 19.26 | -26.7 | 6 |
ACKNOWLEDGMENTS
RGS acknowledges the receipt of a PPARC studentship. RGM thanks the Royal Society for support. This paper uses data that was made publically available through the Isaac Newton Groups’ Wide Field Camera Survey Programme. The Isaac Newton Telescope is operated on the island of La Palma by the Isaac Newton Group in the Spanish Observatorio del Roque de los Muchachos of the Instituto de Astrofisica de Canarias.
References
- [1995] Becker R.H., White R.L. and Helfand D.J. 1995 ApJ 450 559
- [1998] Condon J.J. et al. 1998 AJ 115 1693
- [1999] Fan X. et al. 1999 AJ 118 1F
- [2000a] Fan X., Strauss M.A.,Schneider D.P., Gunn J.E., Lupton R.H.,Anderson S.F., 2000 AJ 119 1
- [2000b] Fan X. et al. 2000 AJ 120 1167
- [2001] Fan X., Strauss M.A., Newman J.A., et al. 2001 AJ 121
- [2001] Fan X. et al. 2001 AJ 121 54
- [1991] Francis P.J. et al. , 1991, ApJ, 373, 465
- [1965] Gunn J.E. Peterson B.A. 1965 ApJ 142 1633
- [1998] Haehnelt, Natarajan & Rees 1998 MNRAS 300 817
- [2000] Irwin M.J. , Lewis J.R. 2000, New Astronomy Reviews (in press).
- [1996] Ives D.J., Tulloch S., Churchill J. 1996 SPIE 2654 266
- [2000] Kauffmann G., Haehnelt M.G 2000 MNRAS 311 576
- [2000] McMahon R.G. et al. 2000 arXiv:astro-ph/0001285
- [1995] Madau P. 1995 ApJ, 441, 18
- [1999] Madau P., Haardt F., Rees M. 1999 ApJ 514 648
- [1998] Magorrian et al. 1998 AJ, 115 2285
- [1998] Miralda-Escude, Haehnelt M., Rees M., arXiv:astro-ph/9812306
- [2000] Oliver S. et al. arXiv:astro-ph/0003263
- [1991] Schneider D.P., Schmidt, M., Gunn J.E. 1991 AJ, 102, 837
- [1995] Schmidt M. Schneider D.P. Gunn J.E. 1995 AJ 110 68
- [1999] Songaila A. Hu E. Cowie L. McMahon R.G. 1999 ApJ, 525, 5
- [2001] Steidel C.C., Pettini M., Adelberger K.L. 2001 ApJ 546 665
- [2000] Stern D. et al. 2000 ApJ 533 75
- [2000] Storrie-Lombardi L.J., Irwin M.J., McMahon R.G., Hook I.M. arXiv:astro-ph/0012446
- [2001] Vanden Berk D.E. and SDSS Collaboration 2001 arXiv:astro-ph/0105231
- [1994] Warren S., Hewett P., Osmer P. 1994 ApJ 427 412
- [1986] Wilkes B.J. 1986 MNRAS 218 331
- [2000] Zheng W. et al. 2000 AJ 120 1607