Properties of the circumnuclear medium in Active Galactic Nuclei
Abstract
We propose a classification scheme for the circumnuclear medium of AGNs based on their location in the plane (related to dust absorption and gas absorption, respectively). We present evidence that the ratio is often lower than the Galactic value. This is shown by the broad line ratios of a sample of intermediate Seyferts, and by the optical/X–ray ratio of line selected (as opposed to color selected) AGNs. We point out the implications for the physical properties of the absorber. A complete classification would require a third axis, related to the density of the absorber and/or its distance from the AGN.
Dipartimento di Astronomia e Scienza dello Spazio, Università di Firenze, L. E. Fermi 5, 50125 Firenze, Italy
Osservatorio Astrofisico di Arcetri, L. E. Fermi 5, 50125 Firenze, Italy
1. Introduction
The properties of the circumnuclear gas in Active Galactic Nuclei (AGNs) have important consequences on their classification (Antonucci 1993). Usually AGNs are, optically–wise, divided into type 1 AGNs, showing broad permitted emission lines, and type 2 AGNs, which only show narrow emission lines. The Unified Model assumes that AGNs of both classes host the same kind of nuclear engine and ascribes their differences solely to orientation effects of a gaseous–dusty torus surrounding the nucleus. For those lines of sights intercepting the obscuring torus, both the Broad Line Region (BLR, pc in size) and the nuclear engine are obscured and only the much more extended Narrow Line Region (NLR) can be observed. This model has gained success from a large number of observational tests (see Antonucci 1993 for a review). In particular, X–ray observations have supported the unified scenario by discovering large columns of absorbing gas in type 2 AGNs (e.g. Awaki et al. 1991; Risaliti et al. 1999). Also, spectroscopic observations in the infrared, where dust absorption is greatly reduced, detected broad permitted lines in several AGNs which are classified as type 2 in the optical.
However, the properties of the absorbing medium seem to be more complex, as suggested by the observed mismatch between the optical and the X–ray classification of some AGNs. Indeed, most of the blue QSOs showing Broad Absorption Lines (BALs) in their UV spectra are underluminous in the X–rays, and recently this feature has been ascribed to absorption in the X–rays (Brandt et al. 2000). Also, a significant fraction of hard X–ray selected AGNs with very hard X–ray spectra (i.e. probably absorbed) have been subsequently identified with type 1 AGNs (Fiore et al. 2000; Akiyama et al. 2000). Finally, a study of bright QSOs with the ASCA satellite has found evidence for X–ray absorption in several of them (Reeves & Turner 2000). These findings suggest a mismatch between optical dust absorption and X–ray gaseous absorption. In this work we will present evidence for a population of AGNs with low values. We will also point out that different regions of the plane are populated by changing the selection criteria.
2. AGN classification in the plane
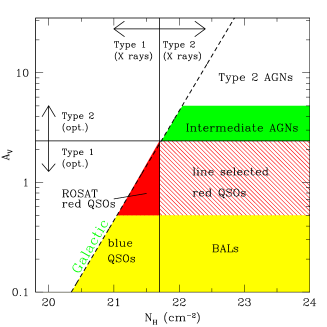
In Fig. 1 we propose a simple classification scheme for AGNs based on the absorption effects produced by dust (measured in the optical as ) and that produced by metals (both in gas and dust and measured in the X–ray band as ). For a dust–to–gas ratio typical of the diffuse interstellar medium (ISM) of our Galaxy ; this relation is represented by the dashed line in Fig. 1. AGNs should be distributed along this line if their circumnuclear gas has the same properties of the Galactic ISM. The bottom region of the diagram is populated by objects selected by means of their blue colours (i.e. low ) in optical surveys (QSOs and BALs). In this diagram BAL QSOs are differentiated by “normal” blue QSOs due to their large inferred from the X rays. Selection in the soft X–rays with ROSAT has revealed a population of sources with optical colors sufficiently red to be missed by color based surveys (Kim & Elvis, 1998). These objects, showing an ratio in agreement with the Galactic one, are referred to in Fig. 1 as “ROSAT red QSOs”. In the next Sections we will present evidence for objects having an value significantly lower than Galactic and populating the regions labelled as “line selected red QSOs” and “intermediate AGNs” in Fig. 1 .
3. Line selected red QSOs
We considered a sample of grism–selected AGNs and correlated it with X–ray observations. Selection on the basis of the optical emission lines should include also reddened objects which would have been missed in color based surveys. We therefore considered the Hamburg Quasars Sample (HS; Engels et al. 1998), whose selection criterion is based on the detection of optical/UV broad lines, though a loose color pre–selection is also used. The HS sample is composed of objects having absolute magnitude and therefore any contribution from the host galaxies to the overall luminosity is negligible. The HS sample was correlated with the WGACAT X–ray source catalog derived from ROSAT PSPC pointings.111http://heasarc.gsfc.nasa.gov/W3Browse/all/wgacat.html We found that 85 sources of the HS are in the WGACAT fields. Upper limits on the X–ray emission of undetected sources were calculated according to the exposure time and corrected for vignetting and PSF. To avoid the extrapolation to the UV for objects at different redshifts, we calculated an optical to X–ray index defined as follows, rather than using the standard index (Avni & Tananbaum 1986):
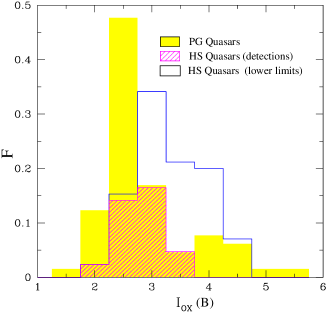
where is the B magnitude and is the 0.24–2 keV count rate. A detailed description of the sample selection and catalogue cross correlation is found in Risaliti et al. (2001). We compared the distribution of our sample with the same distribution calculated for the color selected blue QSOs in the Palomar Green sample (Schmidt & Green, 1983). We found that the distribution for the HS sample and the PG sample are significantly different, the HS distribution being shifted towards higher values of (i.e. lower X–ray emission relative to the optical luminosity; see Fig. 1 ). We investigated the relation of the O–E ( B–R) optical color versus redshift for the AGNs in our sample, finding that about 25% of the HS QSOs have red O–E colors corresponding to (with a maximum of about 2).


Therefore, they would have been missed in color based surveys such as the PG survey. When comparing the distribution for the HS QSOs with (hereafter “line selected red QSOs”) with that of PG QSOs it is found that they are completely different. Line selected red QSOs have high indices, suggesting that absorption is playing a major role in these objects. Furthermore, the high values of indicate that absorption is much more effective in the X–rays than in the optical, suggesting a low ratio. Therefore, these objects should be populating the region labelled as “line selected red QSOs” in Fig. 1 .
4. Intermediate AGNs
We have defined a sample of AGNs whose X–ray spectrum shows evidence for cold absorption (hence a measure of the gaseous column density NH along the line of sight) and whose optical and/or IR spectrum show at least two broad lines that are not completely absorbed by the dust associated to the X–ray absorber. This sample includes intermediate type (1.8–1.9) Seyferts, type 2 Seyferts with broad lines in the near–IR, and a few type 1–1.5 Sy characterized by cold absorption in the X–rays. The gaseous NH along the line of sight is derived directly by the photoelectric cutoff in the X–ray spectrum. Ratios between broad components of the hydrogen lines compared to their intrinsic values give the amount of dust reddening affecting the BLR. However, radiative transport and collisional excitation effects in the extreme conditions of the BLR clouds () can affect the standard hydrogen line ratios expected in case B recombination. For instance, BLR models expect the H/H Balmer decrement to range from the case B value of 3.1 up to a factor of 3 higher (e.g. Mushotzky & Ferland 1984). Nonetheless, the H/H ratio observed in Sy1s and QSOs is often consistent with the standard case B value. Should the intrinsic ratio be higher, the observed H/H compared to the case B value provides at least an upper limit to the reddening. To determine the reddening EB-V from the broad line ratios we assumed the “standard” Galactic extinction curve (Savage & Mathis 1979). As shown in Fig. 2 , in “classical” AGNs with the ratio is significantly lower than the Galactic standard value, by a factor ranging from a few to 100. The markedly different behavior of Low Luminosity AGNs (), having ratios higher than the Galactic value, might reflect intrinsically different physical processes in these objects with respect to “classical” AGNs (e.g. Ho 1999). If (larger grains have larger ratios, however) the observed implies that AGNs with luminosities higher than have and therefore populate the “intermediate AGNs” region in Fig. 1 .
The low values observed in many AGNs could suggest dust properties different from those observed in our Galaxy rather than a dust–free gas. The large densities of the gas in the vicinity of the nucleus could favor the formation of large grains (Maiolino et al. 2001a). This hypothesis can be tested by looking at spectral features produced by small dust grains such as the absorption dip at 2175Å observed in the diffuse interstellar medium and commonly ascribed to small graphite grains with radii Å. In Fig. 2 we show the UV spectra of five slightly reddened type 1 AGNs for which we could retrieve HST archival spectra. The thin dashed line shows the template of type 1 AGNs obtained by Francis et al. (1991) reddened by an consistent with that measured from the broad line ratios assuming a standard Galactic extinction curve. The most important result is that the Galactic extinction curve sistematically predicts a deep feature around 2175Å which is undetected or much weaker in the observed spectra, suggesting that small grains are depleted (Maiolino et al. 2001b). A dust grain distribution biased in favor of large grains would make the extinction curve flatter and featureless (Laor & Draine 1993). If the bias for large grains is due to coagulation, this would also explain the observed low and ratios (Kim & Martin 1996).
5. A structure for absorbers in AGNs
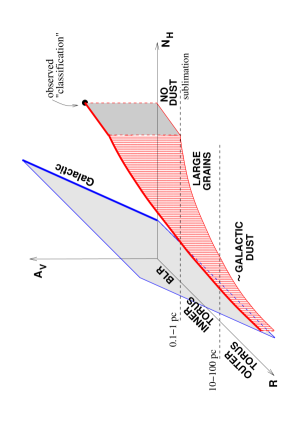
We suggest that a layered structure of the absorbing medium in AGNs can account for the AGN classification in the plane. This is illustrated in Fig. 3, which is the analogous of Fig. 2 with an additional dimension represented by the distance R from the nucleus. When R is a few kpc, the density of the absorbing medium is similar to that of the interstellar medium of the Galaxy, and accordingly the value should be similar to the Galactic one. As the density of the absorber increases moving towards the nucleus (i.e. moving from the outer to the inner torus), the formation of large grains is favored and the value departs from the Galactic value. A further departure could be produced within the Broad Line Region, where the equilibrium temperature is higher than the sublimation temperature of the dust and the absorption is therefore provided by dust–free gas. The relative importance of the different absorbing layers should then be responsible for the distribution of AGNs in the plane.
References
Akiyama, M., Ohta, K., Yamada, T. 2000, ApJ, 532, 700
Antonucci, R. 1993, ARA&A, 31, 473
Avni, Y., Tananbaum, H. 1986, ApJ, 305, 83
Awaki, H., Koyama, K., Inoue, H., Halpern, J.P. 1991, PASJ, 32, 195
Brandt, W.N., Laor, A., Wills, B.J. 2000, ApJ, 528, 637
Engels, D., Hagen, H.-J., Cordis, J., et al. 1998, A&AS, 128, 508
Fiore, F., Giommi, P., Vignali, C., et al. 2000, MNRAS, submitted
Francis, P.J., Hewett, P.C., Foltz, C.B., et al. 1991, ApJ, 373, 465
Ho, L.C. 1999, Adv. Sp. Res. 23, 813
Kim, S.-H., Martin, P.G. 1996, ApJ, 462, 296
Kim, D.W., Elvis, M. 1999, ApJ, 516, 9
Laor, A., Draine, B.T. 1993, ApJ, 402, 441
Maiolino, R., Marconi, A., Oliva, E. 2001a, A&A, 365, 37
Maiolino, R., Marconi, A., Salvati, M., et al. 2001b, A&A, 365, 28
Mushotzky, R.F., Ferland, G.J. 1984, ApJ, 278, 558
Reeves, J., Turner, M. 2000, MNRAS, 316, 234
Risaliti, G., Maiolino, R., Salvati, M., 1999, ApJ, 522, 157
Risaliti, G., Marconi, A., Maiolino, R., et al. 2001, A&A, in press (astro–ph/0102427)
Savage, B.D., Mathis, J.S. 1979, ARA&A, 17, 73
Schmidt, M., Green, R.F. 1983, ApJ, 269, 352