Face–on SS 433 stars as a possible new type of
extragalactic X–ray sources
S. Fabrika
Special Astrophysical Observatory, Nizhnij Arkhyz, Russia
(email: fabrika@sao.ru)
A. Mescheryakov
Sternberg Astronomical Institute, Moscow, Russia
(email: shura@sai.msu.ru)
Abstract
The SS 433 objects is a well–known source of relativistic jets, which are formed in supercritical accretion disk. It is very probable that the disk has polar channels and their radiation is collimated (the photocones). The face–on SS433 object can appear as beamed ultra–bright (and highly variable) X–ray source, erg/s. We discuss properties of these hypothetical objects and their frequency expected in galaxies. We describe a search for such objects using the ROSAT ASS Bright Source Catalog and Faint Source Catalog (99528 point–like sources) and the RC3 catalog (16741 spiral and irregular galaxies). Among in total 418 positive correlations in all types of galaxies we find that in S and Irr galaxies 142 sources are unknown as AGNs. We isolated by visual inspection 37 clear non-nuclear, 43 probably non–nuclear and 35 probably nuclear sources. The last two classes certainly contain many unknown AGNs. The sources of the 1-st class have X–ray luminosities mainly erg/s. Their observed frequency is about per S/Irr galaxy, what is in agreement with expected frequency of face-on SS 433 stars. The only way to recognize such stars is their expected violent variability in X–rays.
Backgrouds
The well–known galactic binary star SS 433 shows unique relativistic jets moving with a velocity . The jets are originated in the supercritical accretion disk. The disk is extremely bright, its total luminosity is erg/s with maximum of the radiation in UV (Dolan et al. 1997). We observe a supercritical wind outflowing from the disk, the temperature of the wind photosphere is K. The disk orientation is “edge–on” and variable () because of the precession.
The jets propagating in inner regions of the wind make channels, which may form a collimated radiation of SS 433. The jets are accelerated and collimated in some inner region inside the photosphere. They are accelerated by radiative pressure with the line–locking, where the collimated radiation is also needed (Shapiro, Milgrom, Rees 1986). Necessity of SS 433 collimated radiation follows also from observation data (Fabrika 1997). The outflowing wind velocity is km/s, the total mass loss rate in the wind is , the mass loss rate in the jets is . The wind photosphere size is cm and corresponding photospheric temperature is K, what agree well with direct estimates from SS 433 fluxes. The photospheric size inside the cannels cm and corresponding temperature of inner photosphere is K, where is opening angle of the channels. The wind photosphere mean size is much greater than that of around the jets , what means that channels and collimated radiation do exist. From SS433 data we can only find upper limit on the opening angle of the photocone .
The supercritical accretion disk simulations (Eggum, Coroniti, Katz, 1985) show that in the inner regions of accretion disk a cone is formed in outflowing matter, where the collimated radiation and fast–moving gas propagate. These cones are rather broad, . In active galactic nuclei (AGNs) ionization cones are observed, which are very probably photocones of collimated radiation. They are broad with opening angles in the range (Wilson, Tsvetanov 1994).
SS 433 star being orientated “face–on” and observed in photocone will look brighter by the geometrical brightening factor , where is solid angle of the channel. It will be X–ray source registered with a luminosity , where – the cone luminosity, – the Doppler factor, – spectral index (). Accepting we find for SS 433 the relativistic beaming factor . Ii is not easy to estimate . We may expect and accept here .
How many such stars one may expect? We know one SS 433 in the Galaxy as a persistent superaccretor and a source of relativistic jets. Results of relativistic binary stars population synthesis (Lipunov et al. 1996) show that we may expect () SS 433s per a galaxy like Milky Way. Very important, that it is much more propable to find such a star in young star–burst regions, i. e. rather in nuclear regions in galaxies. Let us accept one SS 433 star per spiral galaxy like MW, and taking into account the specific orientation of “face–on SS 433”, we accept a frequency of the face–on SS 433s as per spiral galaxy. So we have an assumption which is not easy to be corrected today — the cone luminosity is erg/s. We do not specify opening angle (t. e. the brightening factor ) of the photocone. In Fig. 1 we show these simple relations, how expected X–ray luminosity () and number of MW–like galaxies per one face–on SS 433 star () depend on .

Method
We search for hypothetical objects, face–on SS 433 stars, which
have to be ultraluminous X–ray sources. Their expected
properties are:
Frequency.
per spiral galaxy like MW. Th expected scatter is one order
of magnitude.
Location.
Spiral galaxies: arms, star–burst regions, Irr galaxies. Nuclear regions
of spiral and S0 galaxies: the conditions needed for production of such
stars are practically the same as those for production of an AGN.
Luminosity and spectrum.
X-rays: luminosity is ultra–bright, erg/s.
It depends on many unknown parameters: the cone luminosity and opening
angle, specific orientation and precession phase at observations.
Spectrum is unknown, probably soft. Very variable, sporadical variability
from 1 min to 1 year, periodical variavility with orbibal and
precession periods (days, months). The fast variability is the main criterion
for such objects. It could be quasi–periodical with a time–scale of
about , what is about 200 sec for SS 433.
Visible range: very faint (Fabrika, Sholukhova 1995),
for Mpc. The main
contributor is the accretion disk wind, the object appears as
UV or blue star.
Radio: the SS 433 being face–on and
observed at Mpc (with taking into account
relativistic beaming, ) will show a radio flux
mJy. The transient source Cyg X–3 (accepting the same
beaming ) will be observed as mJy source
in maximum. The transient source GRS 1915+105 (the beaming factor
at ) will show maximum flux of about mJy.
At the modern sensitivity of radio surveys, like the FIRST Survey we have
a little hope to detect such sources.
We have correlated RC3 catalogue of galaxies (de Vaucouleurs et al. 1991) with ROSAT All Sky Survey Bright Source Catalogue (BSC, Voges et al. 1999) and Faint Source Catalogue (FCS, Voges et al. 2000). RC3 contains 23007 galaxies (15415 spirals and 1326 irregulars), it is considered as complete up to . Distances to nearby galaxies ( 5–10 Mpc) in RC3 may have large errors, we used data from Karachentsev et al. (2000) to correct these distances. The Local Group galaxies were omitted. ROSAT ASS (0.1 – 2.4 kev) contains 18811 sources in BSC ( cts/s), 8365 among them are point–like and 91163 point–like sources in FSC.
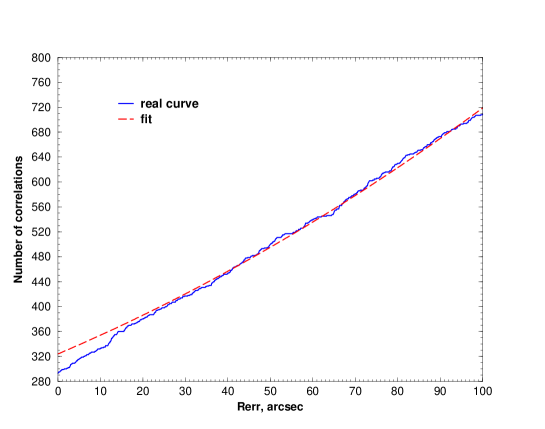
The correlation box was used as 25th magnitude isophote of a galaxy + Rerr. Fig. 2 shows the number of positive correlations versus Rerr together for the BSC and FSC. The polynomial fitting shows real sources + contanimations. The polinomial was found making multiple correlations with galaxy coordinates etc. The deficit of galaxies below the polinomial is contributed both by real errors in X–ray sources and galaxy coordinates and by extended sources. We have found that the Rerr 30′′ and chosen Rerr = 30′′ for final correlations. We see that about 400–420 positive correlations do exist, but about 90 sources from them are contaminations (Fig. 2). To select AGNs among our positive correlations we used Veron–Cetty, Veron (2000) cataloque choosing only confirmed from optical spectroscopy Seyfert and Liner nuclei. As a first step we study in this paper only point–like sources from ROSAT ASS and only spiral and irregular galaxies from RC3 cataloque.
Results
We have found 418 positive correlations of ROSAT ASS point–like sources — 308 sources from FSC and 110 sources from BSC. After comparing with Veron–Cetty, Veron (2000) cataloque we have 327 positive correlations of X–ray sources (unknown as AGNs) with RC3 galaxies. Considering only spiral and irregular galaxies, we find the final number of X–ray sources is 142.
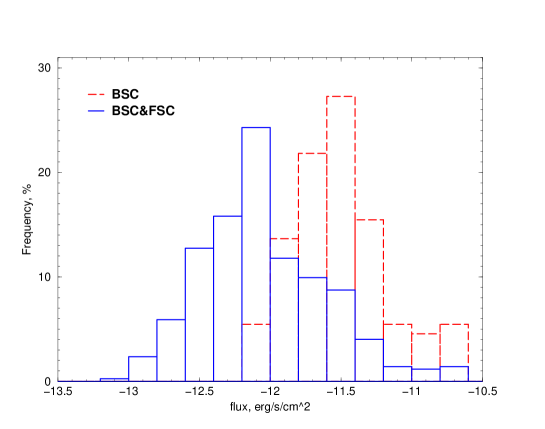
Fig. 3 shows frequencies of X–ray fluxes of all originally found 418 sources. The fluxes have been found accepting power–law spectrum with the photon index and the Galaxy foreground absorption (Voges et al. 1999). From this figure we find that FSC may be complete up to . Only 10 of our sources were detected in FSC below . In BSC only 6 of our positive correlations were detected below .
A visual inspection of all 142 BSC + FSC sources in spiral and irregular
galaxies has been done. These sources have been classified in 4 groups:
1st class of clear offset (non–nuclear) sources, without probable
contamination with a star–like object in X–ray error boxes — 37 sources;
2nd class of probable offset, but may be nuclear sources — 43 sources;
3rd class of very probable nuclear sources, unknown AGNs can be present
in this class, — 35 sources;
4th class of probable contaminations (star–like objects inside a box, or
unusually big distance between X–ray source and galaxy.
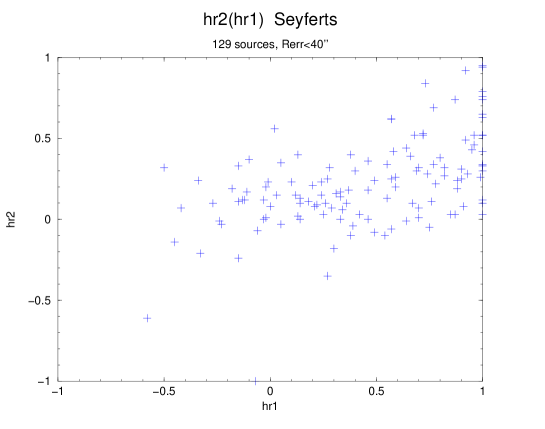
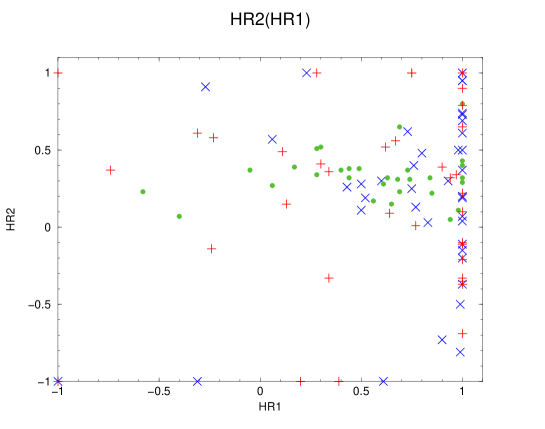
Fig. 4 presents X–ray hardness ratios HR1 and HR2 for known AGNs among our sources (from BSC only) and for our sources from BSC + FSC. There are many X–ray sources with hard spectra among our best correlations. The known X–ray binaries in ROSAT data show very hard spectra (Motch et at., 1998). This result is in agreement with interpertation of the sources as X–ray binaries.
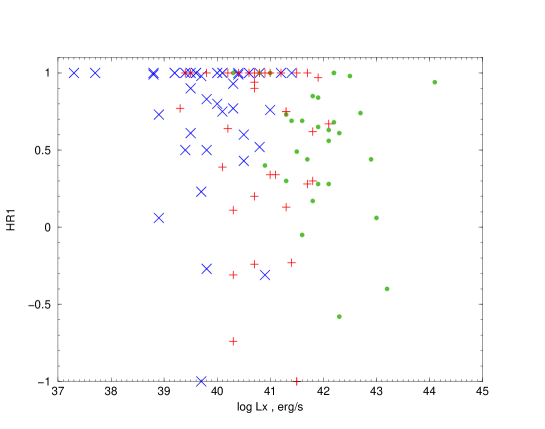
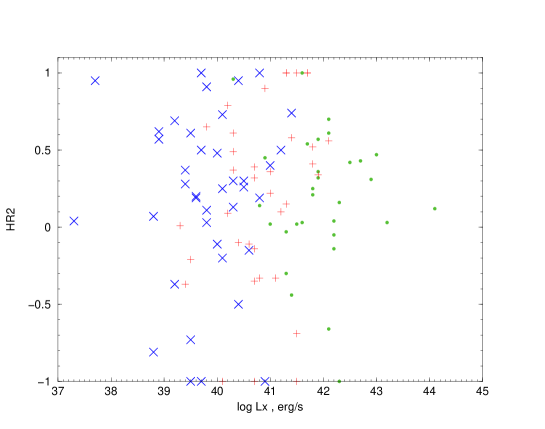
Fig. 5 shows the hardness ratios HR1 and HR2 versus X–ray luminosity for 3 our classes of sources. The only firm conclusion may be done here, that nuclear sources are brighter. They include really unknowm AGNs.

In Fig. 6 we present distributions of X–ray luminosities of our sources (a, b, c) and galactic sources from Read, Pomnan and Strickland (1996) (d), offset sources (e) and AGNs (f) from Roberts, Warwick (2000). The last is a study of complete list of nearby galaxies with the HRI of ROSAT. One can see again that our 2dn and 3rd classes do include new AGNs.
We may compare our results with results by Roberts and Warwick (2000). Using only spiral galaxies in both samples, taking their sources found with our “limiting flux” erg/s and taking our sources found in their “limiting galaxy magnitude” range of galaxies, we find that they found X–ray sources in 39 of galaxies, but we found sources in only of galaxies. This contradiction may be because of observational selection, Roberts and Warwick (2000) used HRI data of pointing observations, but we used ASS data, which were obtained without any preference of astronomers. From the other hand a ratio of offset sources to AGNs found from their flux–limited data is 1.3, and the same ratio (we have not 3rd class sources in our bright–galaxies sample, all they are known AGNs!) in our data 1.5, if we consider the 1st + 2-nd class sources as non–nuclear over known AGNs. And this ratio is 0.7, if we consider only 1st class sources as non–AGNs over 2–nd class sources + known AGNs. We conclude that our number of offset/nuclear sources () is in agreement with the number obtainesd from Roberts and Warwick (2000) data (1.3).
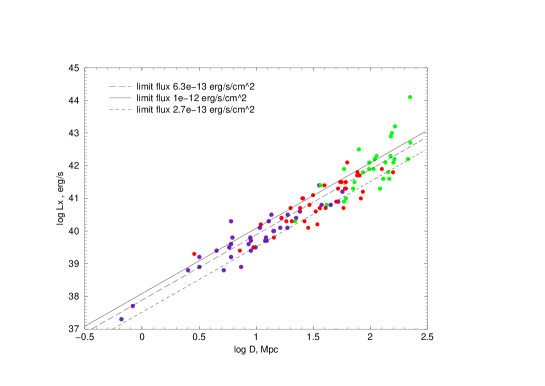
Fig. 7 shows X–ray luminosities versus galactic distances for our three classes of positive correlations. We see that the FSC may detect all sources with erg/s in galaxies closer that 4 Mpc, and all sources with luminosities erg/s could be detected to a distance Mpc.
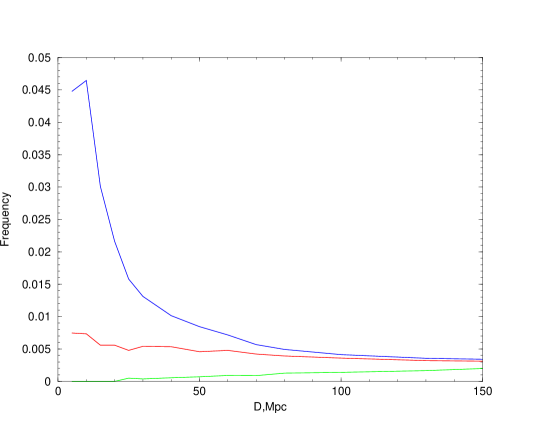
We calculated frequencies of the positive correlations in the galaxies studied, that is a number of sources in S and Irr galaxies over all galaxies of these types in the RC3 cataloque closer than some specific distance. In Fig. 8 we observe a high peak in the 1st class sources at distances Mpc. Sources with luminosities erg/s contribute mainly in the peak. Otherwise at distances Mpc we have a strong selection in our data and can not recognize all sources with erg/s. We may estimate a frequency using only closer galaxies, in the interval of distances Mpc. The frequency of the best offset sources (the 1-st class) is about per S/Irr galaxy in this interval. They are ultra–bright X–ray sources, erg/s. Frequencies of sources of the 2-nd and 3-rd classes show quite different behaviour. They confirm the interpretation, that in 2-nd class of ”probably offset” sources we have both stellar sources and AGNs, but among the 3-rd class (the known AGNs being excluded) we have unknown AGNs.
We conclude that the data do not contradict the idea of existence of the “hypothetical” face–on SS 433 X–ray sources. The only way to identify such stars is their expected violent variability. The problem of existence of ultrabright X–ray sources in galaxies is well known (Fabbiano, 1998; Roberts and Warwick, 2000). We may identify these sources, on the base of today–level of knowledges, as face–on SS 433 stars.
References
- 1 de Vaucouleurs G. et al. 1991: Third Reference Cataloque of Bright Galaxies. Springer. New York.
- 2 Dolan J.P. et al. 1997: Astron & Astrophys. 327. 648.
- 3 Eggum G.F., Coronoti F.V., Katz J.I. 1985. Astrophys. J. 298. L41.
- 4 Fabbiano G. 1998: In ”Hot Universe”. Koyama K. et al. (Eds). 93.
- 5 Fabrika S. 1997: Astrophys. & Space Sci. 252. 439.
- 6 Fabrika S., Sholukhova O. 1995: Astrophys. Space Sci. 226 229.
- 7 Karachentsev I.D. et al. 2000: Atlas of Nearby dwarf galaxies. In preparation.
- 8 Lipunov V.M. et al. 1996: Astrophys. J. 466. 234.
- 9 Motch C. et al. 1998: Astron. and Astrophys. Suppl. Ser. 132. 341
- 10 Read A., Pomnan T., Strickland D. 1996: MPE Report. N 263. 391.
- 11 Roberts T.R., Warwick R.S. 2000: Mon. Not. R. Astron. Soc. 315. 98.
- 12 Shapiro P.R., Milgrom M., Rees M.J. 1986: Astrophys. J. Suppl. 60. 393
- 13 Wilson A.S., Tsvetanov Z.I. 1994: Astron. J. 107. 1227.
- 14 Veron–Cetty M.–P., Veron P. 2000: A catalogue of quasqrs and active nuclei. (9th edition). http://www.obs-hp.fr/
- 15 Voges W. et al. 1999: Astron. & Astrophys. 349. 389.
- 16 Voges W. et al. 2000: http://wave.xray.mpe.de/rosat/cataloques/rass-fsc.