The 2dF QSO redshift survey 11institutetext: Anglo-Australian Observatory, PO Box 296, Epping, NSW 1710, Australia 22institutetext: Liverpool John Moores University, Twelve Quays House, Egerton Wharf, Birkenhead, CH41 1LD, UK 33institutetext: Department of Physics, University of Durham, South Road, Durham, DH1 3LE, UK 44institutetext: Department of Physics, University of Oxford, 1 Keble Road, Oxford, OX1 3RH, UK
*
Abstract
We present some initial results from the 2dF QSO redshift survey. The aim of the survey is to produce an optically-selected catalogue of 25000 QSOs over the redshift range using the 2-degree field at the Anglo-Australian Telescope.
1 Introduction
In the past, statistical studies of QSO clustering have been limited by the small numbers of QSOs available in homogeneously-selected catalogues[4]. The aim of the 2dF QSO redshift survey (2QZ) is to provide a optically-selected catalogue of 25000 QSOs, approximately 50 times larger than the previous largest QSO survey to a similar depth (mag). This survey will be used to provide measures of:
-
•
the evolution of QSO clustering over the redshift range
-
•
large-scale structure over scales 1–1000h-1Mpc
-
•
the cosmological parameters (, ) using geometrical tests
-
•
the QSO luminosity function and its evolution with redshift
-
•
the spectral properties of a large sample of QSOs
2 Catalogue selection and observations
The 2QZ is based on / colour selection of blue candidate objects from the Automated Plate Measuring (APM) machine scans of UK Schmidt , and plates. Full details of the catalogue selection process are given by Smith et al. (2001a)[9]. The survey covers 740 deg2, comprising two strips (excluding the regions around bright stars, etc) in the South Galactic Pole region at declination and in the North Galactic Cap region at declination (see Fig. 1)

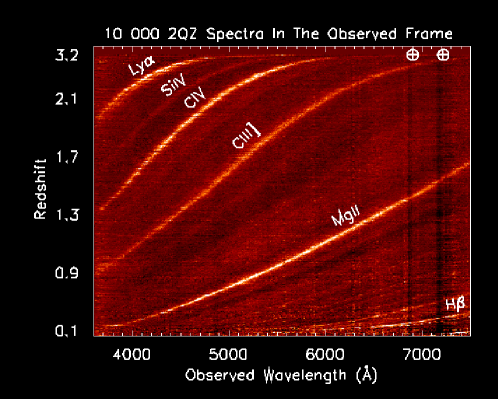
In total 47845 candidates were selected for observations with the 2dF instrument at the Anglo-Australian Telescope. The survey observations are combined with those of the 2dF galaxy redshift survey (2dFGRS[3]). QSO candidates are observed at 7Å resolution over the wavelength range 3800–7250Å. We obtain reliable identification for of the candidates to our survey magnitude limit mag. Spectra for the first 10000 QSOs observed are shown in Fig. reffig:spec. At the time of writing (November 2000), we have observed over 32000 QSO candidates, resulting in the identification of more than 15000 QSOs.
Galactic stars represent the largest single contaminant in the survey (25%), including almost 1500 white dwarfs. Narrow emission line galaxies () comprise a further 10% of the sample. The spectroscopic catalogue will be released to the community in two stages. First, an initial release of 20000 objects (including 10000 QSOs) will be made by June 30, 2001. The release will include positions, redshift, spectra and a detailed coverage map of the survey. The final catalogue release will be made one year after the survey is completed in February 2002. The data will be available from the 2QZ catalogue home page http://www.2dfquasar.org. The input catalogue is already available from this site.
3 Preliminary Results
3.1 QSO Spectra
The composite spectrum based on the co-addition of the first 10000 QSO spectra is shown in Fig. 3. Full details of this work will be presented in Smith et al. (2001, in preparation).

The composite based on the 1000 QSOs identified the Large Bright QSO survey (LBQS)[6] is shown for comparison. The LBQS composite is based on QSOs that are, on average, 10 times more luminous than those identified in the 2QZ. However, the two composites are almost identical. In particular, the equivalent widths of the broad emission lines (including CIV) are the same between the two surveys, providing further evidence that the ‘Baldwin’ effect is weak or non-existent in optically-selected QSO catalogues[11]. The only difference in the emission line properties occurs for the narrow lines; the LBQS composite exhibiting much stronger narrow [OII] and [OIII] emission compared to the 2QZ composite. Given the correlation between host mass and QSO luminosity[8], this suggests that the size/luminosity of the narrow line region is simply proportional to the mass of the host galaxy.
3.2 QSO Luminosity Function
The QSO luminosity function (LF) based on the first 5000 QSOs identified in the 2QZ and the 1000 QSOs in the LBQS is shown in Fig. 4 Full details of the analysis are given by Boyle et al. (2000)[2].
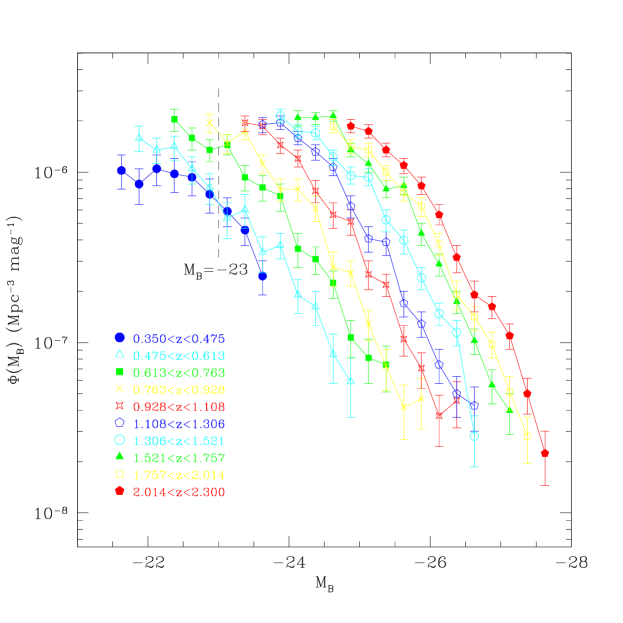
For an Universe, the QSO LF is given by a two power law model:
where there parameter values lie in the range , , and Mpc-3mag-1. The evolution of the LF over the range can be fitted by a pure luminosity evolution model of the form:
This form of evolution is consistent with the form previously derived for the redshift range . However the exponential form of the relation provides for a slow down in the rate of PLE at ; peaking at , beyond the 80% completeness limit for the survey.
3.3 QSO correlation function
The QSO correlation function based on the first 8000 QSOs in the 2QZ is shown in Fig. 5. Full details of the analysis are presented in Croom et al. (2001)[5].

At h-1 Mpc the correlation function, , determined over the full 2QZ redshift range is a good fit to a power law of the form;
where the and h-1Mpc () at a mean redshift . This is comparable to the present-day clustering of optically-selected galaxies. The clustering scale length shows little or no dependence on redshift when the sample is split into smaller redshift intervals.
For a flat Universe with , the mean scale length over the redshift range increases to h-1Mpc, and exhibits a strong evolution with redshift, with increasing towards high redshifts.
Biasing models for QSO formation based on the Press-Schechter formalism[7] are consistent with the observed evolution in for halo masses of M⊙ () and M⊙ (, ). Comparison with CDM models yields values for the shape parameter (), (, ).
3.4 QSO power spectrum
We have also determined the QSO power spectrum from the first QSOs in the survey (Hoyle et al. 2001, in preparation).

Over scales h-1Mpc, the QSO redshift-space power spectrum (see Fig.6) shows a similar shape, , to that measured for galaxies and clusters at low redshift. The amplitude of the QSO power spectrum is similar to the present epoch galaxy power spectrum for , and a factor of 2 lower for . At larger scales, the QSO power spectrum displays excess power over that derived from the APM galaxy survey[1] Fitting CDM models to the observed QSO spectrum yields low values of consistent with those obtained from the analysis of the correlation function.
4 Conclusions
The 2QZ is now over 60% complete. It has already begun to provide important new information on the spectral properties, luminosity function, evolution and clustering of QSOs. The initial catalogue of 10000 QSOs will be publically released by June 30, 2001. Combined with other major QSO surveys (SDSS, FIRST), the 2QZ should result in a much greater understanding of both the QSO phenomenon and the evolution of large-scale structure in the early Universe.
References
- [1] Baugh, C., & Efstathiou, G.P., 1993, MNRAS, 265, 143
- [2] Boyle, B.J., Shanks, T., Croom, S M. Smith, R.J., Miller, L., Loaring, N. & Heymans, C. 2000, MNRAS, 317, 1014
- [3] Colless, M. 1999 in Large Scale Structure in the Universe, eds G.P. Efstathiou, R.S. Ellis, J.E. Gunn, D. York, (London: Royal Society), 105
- [4] Croom, S.M., & Shanks, T. 1996, MNRAS, 281, 893
- [5] Croom, S.M., Shanks, T., Boyle, B.J., Smith R.J., Miller, L., Loaring N.S., & Hoyle, F. 2001, MNRAS, in press
- [6] Francis, P.J., Hewett, P.C., Foltz, C.B., Chaffee, F.H., Weymann, R.J., & Morris, S.L. 1991, ApJ, 373, 465
- [7] Mataresse, S., Coles, P., Lucchin, F., & Moscardini, L. 1997, MNRAS, 286, 115
- [8] McLure, R.J., Dunlop, J.S., Kukula, M.J., Baum, S.A., O’Dea, C.P., & Hughes, D.H. 1999, MNRAS, 308, 377
- [9] Smith R.J., Croom, S.M., Boyle, B.J., Shanks, T., Miller, L., & Loaring, N.S. 2001a, MNRAS, submitted
- [10] Smith R.J., Croom, S.M., Boyle, B.J., Shanks, T., Miller, L., & Loaring, N.S. 2001b, PASA, in press
- [11] Zamorani, G., Marano, B., Mignoli, M., Zitelli, V., & Boyle, B.J. 1992, MNRAS, 256, 238