The 2dF QSO Redshift Survey – 10K@2K! \toctitleThe 2dF QSO Redshift Survey – 10K@2K! 11institutetext: University of Durham, South Road, Durham DH1 3LE, England 22institutetext: AAO, PO Box 296, Epping, NSW 2121, Australia. 33institutetext: University of Oxford, 1 Keble Road, Oxford, OX1, UK. 44institutetext: MSSSO, Private Bag, Weston Creek, ACT 2611, Australia
*
Abstract
With 10000 QSO redshifts, the 2dF QSO Redshift Survey (2QZ) is already the biggest individual QSO survey. The aim for the survey is to have 25000 QSO redshifts, providing an order of magnitude increase in QSO clustering statistics. We first describe the observational parameters of the 2dF QSO survey. We then describe several highlights of the survey so far; we present new estimates of the QSO luminosity function and the QSO correlation function. We also present the first estimate of the QSO power spectrum from the 2QZ catalogue, probing the form of the fluctuation power-spectrum out to the 1000h-1Mpc scales only previously probed by COBE. We find a power spectrum which is steeper than the prediction of standard CDM and more consistent with the prediction of -CDM. The best-fit value for the power spectrum shape parameter for a range of cosmologies is . Finally, we discuss how the complete QSO survey will be able to constrain the value of by combining results from the evolution of QSO clustering and from a geometric test of clustering isotropy.
1 Introduction
The observational aim of the 2dF QSO Survey is to use the new AAT 2dF fibre-optic coupler to obtain redshifts for 25000 B20.85, 0z3 QSOs in two deg2 strips of sky in the RA ranges 21h50 - 03h15 at = -30∘ and 09h50 - 14h50 at = +00∘. The 2dF instrument allows spectra for up to 400 QSO candidates to be obtained simultaneously. The input catalogue is based on APM UBR magnitudes for stars to B=20.85 on 30 UKST fields. The final QSO catalogue will be an order of magnitude bigger than previous complete QSO surveys. The prime scientific aims of the 2dF QSO survey are to determine the QSO clustering power spectrum, P(k), in the range of spatial scales, Mpc and to measure by combining results from cosmological geometric distortion and the evolution of QSO clustering. We also aim to cross-correlate the QSOs with 2dF Galaxy Survey groups to measure via gravitational lensing (cf. [12]). The 2QZ survey is ideal for these clustering projects because the faint magnitude limit means that the sky density of QSOs is high () which makes for a higher count of QSO pairs in correlation analyses. Other aims include determining the evolution of the QSO LF evolution to z=3 and placing new constraints on by finding the sky density of close (6-20′′) lensed QSO pairs.
2 2dF QSO Redshift Survey Status
We now have redshifts for 10000 QSOs measured using 2dF itself. A further 400 QSOs selected from the input catalogue have been observed on different telescopes for associated projects, including 117 bright 1718.25 QSOs using UK Schmidt Telescope FLAIR fibre coupler, 111 radio-loud QSOs identified in the NRAO VLA Sky Survey (NVSS) and observed at Keck and finally 30 QSOs in close pairs () from the ANU 2.3-m telescope. This makes the 2dF survey already the biggest individual QSO survey by a factor of 10.
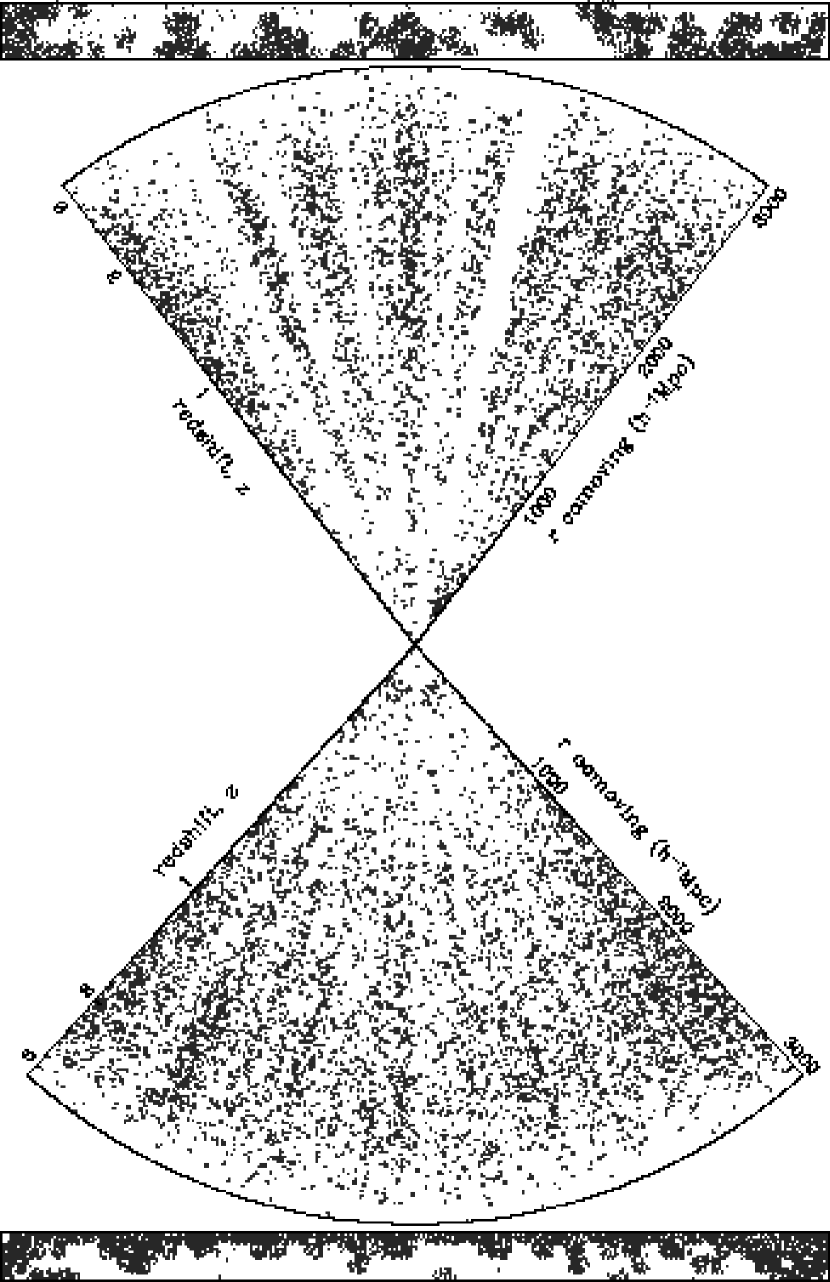
The fraction of our colour selected candidates which are QSOs is 54% which means there will be 26000 QSOs in final survey. The QSO number count, n(B), has been found to be in good agreement with previous surveys. The QSO redshift distribution, n(z), extends to z3 because of our multi-colour UBR selection. In Fig. 1 we show the current Northern and Southern redshift wedges from the 2dF survey. The rectangles shows the sky distribution of the fields that have already been observed. The potential of the survey for probing the large scale structure of the Universe is illustrated by the scale at the edge of the wedges reaching a comoving distance of 3000h-1Mpc.

We have detected 8 close () QSO pairs. Only one is a candidate gravitational lens; the separation is [13]. However, the total number of lensed QSO pairs must await the completion of the survey.
The most interesting individual QSO that has been discovered from the 2dF QSO survey is UN J1025-0040, a unique, post-starburst radio QSO at z=0.634, identified in the 2dF-NVSS catalogue and followed up spectroscopically at the Keck [9]. As well as broad emission lines, the spectrum also shows strong Balmer absorption lines indicative of a post-starburst galaxy. The starburst component of the spectrum at MB=-24.7 dominates the AGN continuum spectrum by 2mag. This 2dF-NVSS collaboration has previously also uncovered a new class of radio-loud BAL QSOs [8] and clearly has great potential for further exciting discoveries.
The new 2dF results for the QSO Luminosity Function [6] continue to be consistent with Pure Luminosity Evolution models throughout the range 0.35z2.3 [4, 5]. The luminosity function based on 6000 QSOs of the 2dF survey combined with 1000 LBQS QSOs [17] are shown in Fig. 2. The large sample size makes it possible to define the QSO Luminosity Function in much smaller redshift bins than used previously and the accuracy of pure luminosity evolution as a description of QSO evolution is clear.
3 The Hubble Volume Light Cone
To test our various QSO clustering statistics, we are using a Hubble Volume N-body simulation, courtesy of the Virgo Consortium. The assumed cosmology is -CDM with =0.3, =0.7 and =1.0. The simulation contains 1 billion mass particles. Three 575deg2 light-cones have been output to z4 providing 3 mock catalogues which are the equivalent of one of our 2dF QSO catalogue strips[18].
A scale independent bias has been applied to produce a constant QSO clustering amplitude with redshift, as seen in previous QSO surveys. The way this was done was to calculate the space density of particles in cubical bins of side 20h-1Mpc and then calculate the number of QSOs in the bin according to a threshold corresponding to a two-parameter exponential, a similar function to that used to bias galaxies in a -CDM simulation [10]. QSOs are then random sampled to the same background n(z) as the observed catalogue. A completeness mask which accounts for the current spectroscopic completeness can then be applied to mimic the current 2QZ dataset.
Fig. 3 shows the comparison between the amplitude of the correlation function of the mass and the biased, mock QSOs, as a function of redshift in the lightcone. The QSO correlation function measured in comoving coordinates is flat with redshift, as intended, within measurement error. The overall mock correlation function also shows good agreement with the 2QZ data[18].

These mock catalogues are used to test our estimators of , P(k) etc. and to estimate their r.m.s. errors. They will also be used to explore the effects of different models of bias on estimates of cosmological parameters from geometric and redshift space clustering distortion.
It should be noted that the evidence from deep CCD imaging studies to determine the QSO-galaxy cross-corrrelation function [16, 24, 14, 25] is that radio-quiet QSOs, unlike radio-loud QSOs, inhabit average galaxy clustering environments out to z=1.5. This implies that the bias problem for radio-quiet QSOs may be no worse than for galaxies. Indeed, there is still the possibility that radio-quiet QSOs may even trace the distribution of optically selected L∗ galaxies.
4 QSO Correlation Function
We present a preliminary 2dF QSO correlation function from our most complete subset of 10000 QSOs [15]. We have taken into account the current incompleteness of the 2dF survey as best we can; however, this process is complicated by the fact that many observed areas still have overlapping 2dF ‘tiles’ as yet unobserved. We show the correlation function in comoving coordinates in Fig. 4. As can be seen, the QSO correlation function in comoving coordinates has a power-law form with an amplitude, where Mpc in the cosmology and in good agreement with previous results for QSOs [11]. It can also be seen that the QSO correlation functions at the average z1.3 remain in generally good agreement with the form of local, optically selected galaxy correlation functions.

The correlation function amplitude shows little evolution with redshift in cosmology and appears to rise only slowly with redshift in the , cosmology [15]. This behaviour is consistent with evolution due to gravitational clustering either in a low model or in a biased, model. The correlation function is consistently positive out to about 20h-1Mpc at 3 and out to about 50h-1Mpc at 1. The correlation function shows similar results to the APM galaxy redshift survey, indicating more power at large scales compared to a standard CDM model and suggesting excess large scale power comparable to that required in a -CDM model[15].
5 First QSO Power Spectrum
Our estimates of P(k) in both the mock catalogues and the data are estimated by Fast Fourier Transform at low wavenumber() and direct Fourier Transform at high wavenumber() [18]. The Hubble Volume mock catalogues show that even the currently incomplete spatial window allows excellent measurement of P(k) on scales 50-500h-1Mpc. Fig. 5 shows that the differences between power spectra measured in mock catalogues with the current completeness and window function (dashed lines) and the theoretical input spectrum (solid line) are small.
We have therefore calculated the power spectrum for the 5000 2dF QSOs in each of the N and S strips independently and they show good agreement within the errors. We also calculated the power spectrum in a low () and a high () redshift bin. The low and high redshift estimates of P(k) show only slow evolution with redshift if either the -CDM or Einstein-de Sitter cosmology is assumed, similar to the slow evolution shown by the correlation function.
The 2QZ power spectrum in Fig. 5 shows reasonable agreement with the Hubble Volume -CDM mock catalogue with evidence again of large scale power which is in excess of what is predicted by the standard CDM model. The best fit is for both for =0.3, =0.7 cosmologies. The power spectrum slope compares well with Durham/UKST galaxy P(k) [19] and with the Abell cluster, P(k) [26] in both cosmologies. The power spectrum also shows more large-scale power than the APM real-space galaxy deprojected P(k) [2].

6 QSO Redshift Space Distortions
We have used the Hubble Volume mock QSO survey catalogues to test the potential of a geometric test [1] for in a biased -CDM model [20]. We use the correlation function split by components of QSO separation split parallel () and perpendicular() to the redshift direction () to determine QSO redshift space distortion.
Redshift space distortion is not only caused by peculiar velocities due to dynamical infall but also by geometric distortion caused by a wrong assumed cosmology [1]. The initial hope was to use the latter effect to measure but our results for the Hubble Volume suggest that this test is degenerate in and the linear bias factor, b, [3]. This can be seen in the contour plot in Fig. 6 where the greyscale shows the degeneracy in terms of and . A model which has isotropic clustering in a -CDM cosmology but is then distorted by an assumed Einstein-de Sitter geometry and linear dynamical infall fits the similarly distorted -CDM Hubble Volume data as it should but other models with higher values of and also fit.
However, we have found that a robust test for may still be possible by combining the constraint on and with the independent constraint on and from the measured amplitude of QSO clustering at our average redshift [20]. Essentially, for a given value of , the value of =0.45 at z=0 which is suggested from analyses of redshift space distortion in galaxy redshift surveys at , gives the amplitude of the mass correlation function at z=0. We then use linear theory to calculate the correlation function of the mass at z=1.3 and then from the observed amplitude of the QSO correlation function we can then calculate the value of at z=1.3. This gives the different - degeneracy shown as the points and line contours in Fig. 6.
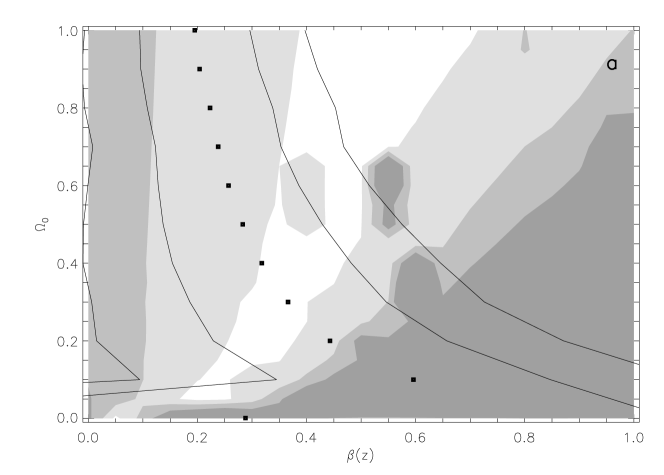
Fig. 6 shows that this method to separate the - degeneracy works well in the Hubble Volume mock catalogues, the overlap region of the two sets of contours overlapping at the correct values of and . The rejection of the Einstein-de Sitter model stands at the 2-3 level in a survey of the size of the 2QZ. The current incompleteness of the 2dF survey prevents the application of this analysis to the data. But an interesting test may be in prospect in the final survey. A similar test will be possible at larger scales via P(), the redshift space power spectral equivalent of [21].
7 Future Possibilities
We shall be also be able to use the 2dF QSO survey to make many other new cosmological tests. For example, we will be able to make new constraints on from counting lensed QSO pairs at both sub-arcsecond (HST) and larger scales. We shall also be able to measure the lensing of 2dF QSOs by foreground 2dF galaxy groups and clusters via QSO-galaxy group cross-correlation to determine [12]. From obtaining higher resolution, absorption line spectra of the brighter QSOs we shall also be able to test whether Lyman and metal absorption lines trace the same large-scale structures as the QSOs themselves. Finally, the AAT 2dF QSO survey has shown the exciting potential of large QSO surveys for cosmology and for probing the large scale structure of the Universe. There is therefore strong motivation to extend the current survey to wider fields and fainter limits using multi-colour data from the ESO VST and UK VISTA telescopes combined with further enhancements of the AAT 2dF instrument.
8 Conclusions
-
•
The 2QZ survey now contains redshifts for 10000/26000 B20.85, z3 QSOs making it already the biggest individual QSO survey by an order of magnitude.
-
•
The 2QZ survey confirms the accuracy of the Pure Luminosity Evolution model f or the evolution QSO Luminosity Function for 0z2.2.
-
•
The 2QZ survey has already detected many individually interesting objects, including a post-starburst QSO and a close QSO pair.
-
•
The 2QZ correlation function based on 10000 QSOs is consistent with that for local galaxies but with more power on large scales than the standard CDM model.
-
•
The first QSO power spectrum has been measured out to scales of 500h-1Mpc. The result shows more large scale power than predicted by standard CDM and is more consistent with the prediction of -CDM.
-
•
2QZ has the exciting potential to determine and from redshift space distortions, clustering evolution and gravitational lensing.
References
- [1] Alcock, C., Paczynski, B. (1979) An evolution free test for non-zero cosmological constant Nature, 281, 358–359
- [2] Baugh, C.M., Efstathiou, G. (1993) The Three-Dimensional Power Spectrum Measured from the APM Galaxy Survey MNRAS, 265, 145–156
- [3] Ballinger, W.E., Peacock, J.A., Heavens, A.F. (1996) Measuring the cosmological constant with redshift surveys MNRAS, 282, 877–888
- [4] Boyle, B.J., Shanks, T., Peterson, B.A. (1988) The evolution of optically selected QSOs. II MNRAS, 235, 935–948.
- [5] Boyle, B.J., Jones, L.R., Shanks, T., (1991) A spectroscopic survey of faint QSOs MNRAS, 251, 482–507.
- [6] Boyle B.J., Shanks, T., Croom, S.M., Smith, R.J., Miller, L., Loaring N., Heymans, C. (2000) The 2dF QSO Redshift Survey - I. The optical luminosity function of quasi-stellar objects MNRAS, 317, 1014–1022
- [7] Boyle, B.J., Smith, R.J., Croom, S.M. , Shanks, T. , Miller, L., Loaring, N., (1999) QSO clustering and the AAT 2dF QSO Redshift Survey Phil. Trans R. Soc. Lond. A., 357, 185–195.
- [8] Brotherton, M.S., Van Breugel, W., Smith, R.J., Boyle, B.J., Shanks, T., Croom, S.M., Miller, L., Becker, R.H. (1998) Discovery of Radio-Loud Broad Absorption Line Quasars Using Ultraviolet Excess and Deep Radio Selection ApJ, 505, L7–L10.
- [9] Brotherton, M.S., Van Breugel, W. Stanford, S.A., Smith, R.J., Boyle, B.J., Miller, L., Shanks, T., Croom, S.M., Filippenko, A.V., (1999) A Spectacular Poststarburst Quasar ApJ, 520, L87–L90.
- [10] Cole, S.M., Hatton, S.J., Weinberg, D.H., Frenk, C.S. (1998) Mock 2dF and SDSS galaxy redshift surveys MNRAS, 300, 945–966.
- [11] Croom, S.M., Shanks, T. (1996) QSO clustering - III. Clustering in the Large Bright Quasar Survey and evolution of the QSO correlation function MNRAS, 281, 893–906.
- [12] Croom, S.M., Shanks, T. (1999) Statistical lensing of faint QSOs by galaxy clusters MNRAS, 307, L17–L21.
- [13] Croom, S.M., Shanks, T., Boyle, B.J., Smith, R.J., Miller, L., Loaring, N.S., 1999. In ”Evolution of Large Scale Structure: From Recombination to Garching”, eds. Banday, A.J. & Sheth, R.K. E32.
- [14] Croom, S.M., Shanks, T. (1999) Radio-quiet QSO environments - I. The correlation of QSOs and b23 galaxies MNRAS, 303, 411–422.
- [15] Croom, S.M., Shanks, T., Boyle, B.J., Smith, R.J., Miller, L., Loaring, N.S., Hoyle, F. (2001) The 2dF QSO redshift survey - II. Structure and evolution at high redshift MNRAS, in press.
- [16] Ellingson, E., Yee, H.K.C., Green, R.F. (1991) Quasars and active galactic nuclei in rich environments. II - The evolution of radio-loud quasars ApJ, 371, 49–59.
- [17] Hewett, P.C., Foltz, C.B., Chaffee, F.H. (1995) The large bright quasar survey. 6: Quasar catalog and survey parameters AJ, 109, 1498–1521.
- [18] Hoyle, F. (2000) The Structure and Scale of the Universe. PhD Thesis, University of Durham.
- [19] Hoyle, F., Baugh, C.M., Shanks, T., Ratcliffe, A. (1999) The Durham/UKST Galaxy Redshift Survey - VI. Power spectrum analysis of clustering MNRAS, 309, 659–671
- [20] Hoyle, F. et al. (2001) in prep.
- [21] Outram, P.J. et al. (2001) in prep.
- [22] Ratcliffe, A., Shanks, T., Parker, Q.A., Fong, R., (1998) The Durham/UKST Galaxy Redshift Survey - III. Large-scale structure via the two-point correlation function MNRAS, 296, 173–190.
- [23] Shanks, T., Boyle, B.J. (1994) QSO Clustering - I. Optical Surveys in the Redshift Range 0.3Z2.2 MNRAS, 271, 753–772.
- [24] Smith, R.J., Boyle, B.J., Maddox, S.J. (1995) The Environments of Z0.3 QSOS MNRAS, 277, 270–276.
- [25] Smith, R.J., Boyle, B.J., Maddox, S.J. (2000) The environments of Z0.3 QSOS MNRAS, 313, 252–262.
- [26] Tadros, H., Efstathiou, G. (1998) The power spectrum of rich clusters of galaxies on large spatial scales MNRAS, 296, 995–1003
- [27] Tucker, D.L. et al. (1997) The Las Campanas Redshift Survey galaxy-galaxy autocorrelation function MNRAS, 285, L5–L9