The Peculiar Type Ia Supernova 1999by: Spectroscopy at Early Epochs111Based on observations obtained at David Dunlap Observatory, University of Toronto, Canada
Abstract
We present medium resolution () optical spectroscopy of SN 1999by in NGC 2841 made around its light maximum. The depth ratio of the two Si II features at 5800 Å and 6150 Å being (SiII) at maximum indicates that this SN belongs to the peculiar, sub-luminous SNe Ia. Radial velocities inferred from the minimum of the 6150 Å trough reveal a steeper decline of the velocity curve than expected for “normal” SNe Ia, consistent with the behavior of published light curves. A revised absolute magnitude of SN 1999by and distance to its host galaxy NGC 2841 is estimated based on the Multi-Color Light Curve Shape (MLCS) method, resulting in (max)=18.06 mag and Mpc, respectively. An approximative linear dependence of the luminosity parameter on (SiII) is presented.
1 Introduction

In the last decade it became evident that some of the observed Type Ia supernovae are intrinsically sub-luminous compared to the majority of so-called “normal” SNe Ia. SN 1991bg (Filippenko et al., 1992) is now considered as their prototype, and the sample of well-observed events includes SN 1992K (Hamuy et al., 1994), SN 1997cn (Turatto et al., 1998) and SN 1998de (Modjaz et al., 2000). Beside being about 1 magnitude fainter than normal SNe Ia at maximum, sub-luminous SNe Ia also exhibit peculiar colors and spectra. For example, the intrinsic (unreddened) color around maximum is 0.7 0.8 magnitude redder than normal SNe Ia, reaching mag at 10 days after maximum light. The spectroscopic peculiarity is represented by the appearance of strong Ti II band in the blue region and the increase of the ratio of the depths of Si II absorption troughs at 5800 Å and 6150 Å ((SiII)) (e.g. Nugent et al., 1995). Moreover, sub-luminous SNe Ia have steeply declining light curves. Their decline rate parameter is instead of 1.0 1.5 as for normal SNe Ia (e.g. Phillips et al., 1999). Because both (SiII) and correlate with the peak luminosity, the observational data indicate that sub-luminous SNe Ia have less energetic explosions and less ejected Ni masses than normal SNe Ia, although the correlation between the different quantities cannot be described with a single parameter (Hamuy et al., 1996, Hatano et al., 2000).
In this paper we present medium resolution spectra of the sub-luminous Ia-type supernova SN 1999by occured in NGC 2841. Chronicles of the discovery and the earliest observations can be found in IAU Circulars No. 71567159. Gerardy & Fesen (1999) pointed out very soon that the spectrum of SN 1999by is of Type Ia, while Garnavich et al. (1999) noted that SN 1999by belongs to the group of sub-luminous SNe Ia based on the (SiII) line depth ratio. Early-phase spectra of such SNe are available only for SN 1991bg and SN 1997cn. Thus, the spectroscopic observations made around maximum light may supply interesting details about peculiar SNe Ia. Very recently Howell et al. (2001) presented spectropolarimetric evidence for the strong () asphericity of the ejecta of SN 1999by, suggesting a connection between the observed asymmetry and the mechanism producing sub-luminous SNe Ia.
Our new observations are described in Sect.2, while their interpretation is given in Sect.3. Sect.4 summarizes the results of this paper.
2 Spectroscopic observations
SN 1999by was observed with the 1.88 m telescope and Cassegrain spectrograph of the David Dunlap Observatory on three nights between May 10 and 21, 1999. The 150A grating in 2nd order with an order separation filter in the stellar beam was applied, resulting in a reciprocal dispersion of 1.22 Å/pixel on the CCD detector. The recorded spectra cover about 1250 Å centered on 6000 Å.

Reduction was performed by standard routines in 333 is distributed by NOAO which is operated by the Association of Universities for Research in Astronomy (AURA) Inc. under cooperative agreement with the National Science Foundation. The wavelength scale was calibrated with FeAr spectral lamp exposures. The background light due to the host galaxy was approximated with a quadratic polynomial perpendicular to the dispersion axis and subtracted from the SN aperture at each wavelength.
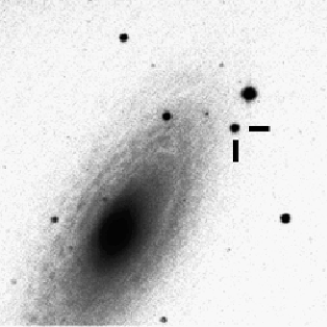
Because of the rarity of photometric nights at the DDO site (in the proximity of Toronto), precise flux calibration of the spectra was not possible. However, an approximate correction for the CCD spectral response has been determined by obtaining the spectra of three nearby field stars (#2, #3, #4 of Skiff, 1999; see Fig.1 of Tóth & Szabó, 2000). Their indices (0.59, 0.75, 0.60 mag, respectively) corresponds to K according to the tables of Schmidt-Kaler (e.g. Carroll & Ostlie, 1996). The measured continua of these stars could be approximated by a smooth polynomial. The real continuum fluxes (assuming ) were estimated from model spectra of Buser & Kurucz (1992). Then, the wavelength-dependent sensitivity of the used CCD spectrograph was calculated by dividing the measured continua with the chosen model continuum flux values. The resulting function turned out to be smooth and slightly decreasing to the red. We have looked for any sudden drop in the sensitivity function that might distort the depths of spectral lines and found nothing.
The SN spectra were then corrected by dividing the measured spectra with the approximate sensitivity function described above. Because the used comparison stars were not spectroscopic standards, the corrected “continuum” slopes of the SN spectra may still be slightly distorted. Nevertheless, the SN spectra calibrated in such a way are acceptable for a comparative analysis described in Sect.3.1.
The reduced spectra are collected and plotted in Fig.1. The epochs of the observations are indicated on the right side of each spectrum. The phases relative to B-maximum were determined by adopting the result of Bonanos, et al. (1999) that the maximum in occured on JD 2451308.5 (May 9/10, 1999), which was also confirmed by photometry of Tóth & Szabó (2000) (note that the JD of maximum light was misprinted in both papers).
Although the spectral coverage is rather small, the appearance of the strong Si II line around 6150 Å unambigously identifies a Type Ia SN. The other strong feature, the absorption trough at 5800 Å is also attributed to Si II. The relative strength of this line to that of the 6150 Å line (SiII) (Nugent et al., 1995) suggests that SN 1999by is a sub-luminous event, as mentioned in Sect.1. This is illustrated in Fig.2, where the maximum-light spectrum of SN 1999by is plotted together with a pre-maximum spectrum of SN 1998aq (Vinkó et al., 1999) obtained with the same instrument and setup (unfortunately, no spectrum of SN 1998aq closer to its maximum light was available for us). The spectra in Fig.2 were normalized to the local “continuum” for illustrative purpose. It is visible that the 5800 Å line is much weaker in SN 1998aq than in SN 1999by. This line gets stronger in pre-maximum spectra of SNe Ia when approaching the maximum, however, in “normal” SNe the increase of (SiII) is only 0.040.06 (Riess et al., 1998b). Thus, the 5800 Å feature was not much stronger in the spectrum of SN 1998aq at maximum.
3 Data analysis and interpretation
3.1 Line depths and radial velocities
| JD | ||
|---|---|---|
| (2400000) | (day) | (kms-1) |
| 51309.6 | +1 | 10174 |
| 51312.5 | +4 | 9560 |
| 51319.6 | +11 | 8946 |

We have calculated the value of (SiII) of SN 1999by following the definition of Nugent et al. (1995). (SiII) = 0.63 was obtained for the May 11 spectrum, while = 0.66 was determined for the May 14 one, in accord with the result of Garnavich et al. (1999) (see also Hatano et al., 2000). This is more than a factor of 2 larger than its usual value of for normal SNe Ia (Riess et al, 1998b, Hatano et al., 2000).
Very recently Howell et al. (2001) published three spectra of SN 1999by made just before our observations. From their Fig.1 we estimated (SiII) = 0.68, 0.70, 0.66 at epochs , respectively. These agree very well (within a few hundredths) of the results derived from our spectra, suggesting that our observations probably do not contain wavelength-dependent systematic errors distorting the line-depth ratio.
(SiII) correlates with the luminosity parameter introduced by Riess et al. (1996) in the Multi-Color Light Curve Shape (MLCS) method. A calibration of the linear dependence of (SiII) on was given by Riess et al. (1998b), resulting in for day phase, while for days the slope and zero point changes to 2.06 and 0.46, respectively. Substituting the (SiII) values given above one can get for the luminosity parameter of SN 1999by (the given error takes into account the quoted uncertainty of the - calibration). For “normal” SNe Ia , therefore, this high value suggests that SN 1999by is one of the most sub-luminous SNe Ia (Bonanos et al., 1999). Note that this spectroscopic is not suitable for describing the multi-color light curve of SN 1999by, which requires . The light curve decline parameter, , is also indicative of the low luminosity (Bonanos et al., 1999).
Radial velocities were inferred from the absorption minima of the 6150 Å Si II trough (fitted by a low-order polynomial around minimum). Table 1 lists the resulted radial velocities, corrected for the host galaxy center recession velocity kms-1 (as given in the NASA/IPAC Extragalactic Database). As the anonymous referee pointed out, SN 1999by was closer to the edge of NGC 2841 and could have significant orbital velocity in addition to the center-of-galaxy radial velocity. The rotation velocity of NGC 2841 at distances greater than 10 kpc from its center is kms-1 (Sofue et al., 1999). Thus, the uncertainty of the radial velocities is at least 300 kms-1 due to the possible orbital velocity as well as the large width of the Si II line. Nevertheless, this uncertainty is only a few percent of the Si II expansion velocity.
Fig.3 compares the radial velocities of SN 1999by with those of SN 1998aq (Vinkó et al.,1999) and SN 1994D (Patat et al.,1996). The decline of the radial velocities of SN 1999by is much stronger than in the other two cases. SN 1991bg showed similar behavior (Filippenko et al.,1992), while the other sub-luminous SNe Ia were not well covered spectroscopically around maximum. The stronger velocity decline is also in good agreement with the recent result of Hatano et al. (2000) that sub-luminous events have lower velocities at 10 days after maximum than do normal SNe Ia. This may support the hypothesis that sub-luminous SNe Ia arise from sub-Chandrasekhar mass progenitors, thus have less energetic explosion than normal Type Ia events (see Modjaz et al., 2000 for recent review of explosion models).
3.2 Absolute magnitude and distance

Application of the Multi-Color Light Curve Shape (MLCS) method for SN 1999by has been published very recently by Tóth & Szabó (2000). They used only the light curve for template fitting and data for the reddening determination, and revealed mag. This may indicate that SN 1999by is extremely sub-luminous. For example, SN 1991bg, the prototype, had (Riess, Press & Kirshner, 1996) which is known as one of the least luminous SNe Ia to date.
We re-analysed the photometric dataset published by Tóth & Szabó (2000) supplemented by the data of Hanzl (1999) using the original MLCS template curves of Riess, Press & Kirshner (1996). Because the photometric data are inhomogeneous, systematic errors may distort the parameters derived from them. Thus, the results below can be considered only as crude estimates.
Although Riess et al. (1998a) developed a second version of MLCS (MLCS-2, based on an extended list of calibrating SNe), the updated template vectors have not been published yet. However, recently Vinkó et al. (2001) demonstrated that for nearby SNe, even with moderate reddening, the MLCS-1 and MLCS-2 methods produce consistent results, if the maximum magnitude of the fiducial () light curve is set properly. We adopted mag for the fiducial light curve (Riess, personal communication), while the original MLCS-1 method was based on mag. The difference has been taken into account by adding mag to the distance modulus computed with MLCS-1.
For SN 1999by, was adopted, consistent with the all-sky reddening map of Schlegel et al. (1998) (Tóth & Szabó derived from their SN photometry). The template vectors were fitted simultaneously to all data, i.e. the residual of all data were combined in a single -function. The fitting was restricted for days, because the available pre-maximum data of SN 1999by could not be adequately fitted together with the post-maximum data (see also Tóth & Szabó, 2000). Also, the minimum photometric error was increased to mag taking into account some possible systematic uncertainties in the used dataset (due to e.g. errors in the standard transformation).

The simultaneous fitting of the template curves resulted in and mag for the luminosity parameter and the reddening-free distance modulus, respectively. The given uncertainty of the distance modulus is only the rms error of the fitting, disregarding the possible systematic errors in the absolute magnitudes of the template light curves. The quality of the fit can be judged from Fig.4. It is seen that the fitting is not perfect, however, we believe that this is close the optimal result that can be achieved from the present datasets. The minimum of the reduced chi-squared that could be reached was . Still, the solution may be systematically incorrect, because for such under-luminous SN the template vectors in MLCS-1 are based only on the light curves of SN 1991bg, and the light variation of SN 1999by may differ substantially from that. The large deviation of the pre-maximum points may be due to such inconsistence. Also, photometric errors higher than we adopted ( mag) cannot be ruled out.
The photometric is significantly higher than the value found from spectroscopy (, Sect.3). It was not possible to reach an adequate fit with given by spectroscopy. Thus, the current spectroscopic determination of does not give a suitable result for SN 1999by, which is probably true for other extreme sub-luminous SNe Ia as well. An improved (SiII) calibration is presented in the next section.
Although sub-luminous SNe Ia are usually eliminated from the sample of “good” distance indicators, the MLCS method gives information on their distances as well. The new distance modulus of SN 1999by given above corresponds to Mpc geometric distance, which is significantly higher than Mpc given by Tóth & Szabó (2000) and Tully (1988). Note that the template vectors of the MLCS-1 method were calibrated from a training set of SNe adopting Tully-Fisher- and surface-brightness-fluctuation distances, but the final absolute magnitudes were shifted to match the Cepheid-based distance scale (Riess, Press & Kirshner, 1996). Thus, the higher distance given above simply reflects the difference between various distance scales, and may still contain a systematic error. Both Cepheid- and Tully-Fisher distances undergo significant revisions nowadays (e.g. Gibson et al., 2000, Sakai et al., 2000), so this question can be answered only when the problems of the different distance scales are solved.
3.3 Comparison with other SNe Ia
The absolute magnitudes of SNe Ia correlate with (SiII) as was presented very clearly by Nugent et al. (1995). Although Hatano et al. (2000) demonstrated that this correlation is not a one-parameter sequence, the dependence of on (SiII) may still be a somewhat useful relation for predicting SNe luminosities from spectra observed around maximum (at least as a first approximation). Now the correlation can be slightly improved using the new data of sub-luminous SNe Ia.
| SN | (SiII) | Ref. | ||
|---|---|---|---|---|
| 1994ae | 0.12 | 0.13 | 0.05 | a,b |
| 1991T | 0.14 | 0.56 | 0.31 | a,b |
| 1981B | 0.16 | 0.00 | 0.32 | a,b |
| 1990N | 0.16 | 0.28 | 0.31 | a,b |
| 1998bu | 0.23 | 0.02 | 0.05 | d,e |
| 1989B | 0.29 | 0.04 | 0.31 | a,b |
| 1992A | 0.38 | 0.44 | 0.13 | a,b |
| 1986G | 0.53 | 0.41 | 0.31 | a,b |
| 1991bg | 0.62 | 1.44 | 0.10 | a,b |
| 1997cn | 0.63 | 1.50 | 0.05 | c |
| 1999by | 0.63 | 1.40 | 0.10 | pp |
References: a) Nugent et al. (1995); b) Riess, Press & Kirshner (1996); c) Turatto et al. (1998); d) Jha et al. (2000); e) Hatano et al. (2000); pp) present paper
We have collected values of the light curve parameter that were derived via the MLCS method and the values of (SiII), both at maximum. These are listed in Table 2. Because measures the deviation of the light curve of a particular SN from the fiducial SN Ia light curve at maximum, it is also directly proportional to the maximum absolute magnitude . However, at present, seems to be a more useful parameter than , because it is determined directly from the shape of the (multi-color) light curves, therefore it is not affected by the adopted zero-point of the distance scale.
The result is plotted in Fig.5, where the continuous line represents the approximate relation
| (1) | |||||
while the dashed line shows the relation given by Riess et al. (1998b) (see Sect.3.1). It is seen that the Riess et al. calibration gives systematically lower for the most sub-luminous SNe Ia. The new relation fits these SNe better, thus it may be used to predict from the measurement of (SiII) around maximum. Such prediction may be useful, for example, in the “snapshot” distance estimate method (Riess et al., 1998b) when only a few nights’ data are available for a particular SN.
From Fig.5, it may also be interesting that the most sub-luminous SN 1991bg, SN 1997cn and SN 1999by represent a small group with very consistent line-depth ratio and (or absolute magnitude). It may mean that sub-luminous SNe Ia might be better distance indicators than previously thought, if their sub-luminous status is properly identified from spectroscopy and their difference from normal SNe Ia is taken into account. It is known (e.g. Hamuy et al., 1994) that such sub-luminous SNe Ia may be more frequent events than their discovery rate suggests, thus, it is possible that many more such objects will be detected in the extensive supernova-search programs. However, the present sample is obviously too small to draw a certain conclusion.
4 Summary
The results of this paper can be summarized as follows:
Three spectra of the sub-luminous Type Ia SN 1999by around maximum were obtained at DDO, centered on the Si II trough at 6150 Å. The (SiII) line depth ratio (Nugent et al., 1995) is determined to be 0.63 at maximum, indicative of an intrinsically sub-luminous SNe Ia.
Radial velocities of the 6150 Å Si II line were determined from measuring the Doppler-shift of the line core. It is shown that SN 1999by exhibited stronger decline of its radial velocity curve than other, spectroscopically normal SNe Ia. This may support the low-energy, sub-Chandrasekhar mass explosion proposed for such SNe.
Absolute magnitude and distance of SN 1999by have been derived via the MLCS method. The assumption that the reddening is led to =18.06 mag and Mpc. The maximum absolute magnitude as well as the line depth ratio (SiII) of SN 1999by are in very good agreement with those of other extreme sub-luminous SNe Ia, SN 1991bg and SN 1997cn. An approximative linear relation has been determined to predict the light curve parameter of SNe Ia over a wide range of observed (SiII).
References
- (1) Bonanos, A. et al. 1999, BAAS 31, #38.06, p.1024
- (2) Buser, R., Kurucz, R.L. 1992, A&A 264, 557
- (3) Carroll, B.W., Ostlie, D.A. 1996, “An Introduction to Modern Astrophysics” (Addison-Wesley Publ.), p. A-13.
- (4) Filippenko, A.V. et al. 1992, AJ 104, 1543
- Filippenko, (1997) Filippenko, A.V. 1997, Ann.Rev.Astr.Ap. 35, 309
- (6) Garnavich, P., Jha, S., Kirshner, R.P. 1999, IAU Circ. 7159
- (7) Gerardy, C., Fesen, R. 1999, IAU Circ. 7158
- (8) Gibson, B.K. et al. 2000, ApJ 529, 723
- (9) Hamuy, M. et al. 1994, AJ 108, 2226
- (10) Hamuy, M. et al. 1996, AJ 112, 2438
- (11) Hanzl, D. 1999, IAU Circulars No. 7157, 7158, 7169, 7223
- (12) Hatano, K. et al. 2000, ApJ Letters 543, L49.
- (13) Howell, D.A., Höflich,P., Wang, L., Wheeler, J.C. 2001, astro-ph/0101520
- (14) Jha, S. et al. 2000, ApJS 125, 73
- (15) Modjaz, M. et al. 2000, astro-ph/0008012
- (16) Nugent, P., et al. 1995, ApJ 455, L147
- (17) Patat, F. et al. 1996, MNRAS 278, 111
- (18) Phillips, M.M. et al. 1999, AJ 118, 1766
- Riess et al., (1996) Riess, A.G., Press, W.H., Kirshner, R.P. 1996, ApJ 473, 88
- (20) Riess, A.G., Filippenko, A.V., Challis, P. et al. 1998a, AJ 116, 1009
- (21) Riess, A.G., Nugent,P., Filippenko, A.V. et al. 1998b, ApJ 504, 935
- (22) Sakai, S. et al. 2000, ApJ 529, 698
- (23) Schlegel, D.J., Finkbeiner, D.P., Davis, M. 1998, ApJ 500, 525
-
(24)
Skiff, B.A. 1999, VSNET Alerts 2917, 2919, 2937;
ftp.lowell.edu/pub/bas/starcats/loneos.phot - (25) Sofue, Y., Tutui, Y., Honma, M. et al. 1999, AJ 523, 136
- (26) Tóth, I., Szabó, R. 2000, A&A 361, 63
- (27) Tully, R.B. 1988, Nearby Galaxies Catalogue (Cambridge Univ.Press)
- (28) Turatto, M. et al. 1998, AJ 116, 2431
- Vinko et al., (1999) Vinkó, J., Kiss, L.L., Thomson, J. et al. 1999, A&A 345, 592
- Vinko et al., (2001) Vinkó, J., Csák, B., Csizmadia, Sz. et al. 2001 A&A submitted