The First Observations of the Second Brightest Quasar
Abstract
We report the discovery of a new bright quasar PHL 1811 as part of a followup program to identify bright quasars in the FIRST radio survey. With B=13.9, R=13.9, and z=0.192, this quasar is now the second brightest quasar (in apparent magnitude) known beyond z=0.1. Optically classified as a Narrow-line Seyfert 1 galaxy (NLS1), PHL 1811 is unusual for an object in this class in that it was not detected in X-rays in the ROSAT All Sky survey or in any previous X-ray survey. A follow-up BeppoSAX observation confirms that it is deficient in X-rays compared with other quasars, but poor signal to noise prevents a definitive characterization of the X-ray spectrum. We consider three alternative hypotheses to explain why PHL 1811 is a weak X-ray source: 1.) it is a BALQSO and suffers X-ray absorption; 2.) like several other luminous NLS1s, it exhibits high amplitude X-ray variability, and has been observed only when it is in an X-ray quiescent state; 3.) it is intrinsically weak because it simply lacks an X-ray emitting region.
1 Introduction
Bright, luminous quasars, relatively rare in the local universe, offer a valuable laboratory for studying astrophysical phenomena. Good signal-to-noise observations can be obtained with a modest amount of observing time, and these objects, which display the effects of accretion onto supermassive black holes, can be studied in detail. Bright quasars can also be used to probe the interstellar and intergalactic medium, as their brilliant continuum allows detection of faint absorption lines.
For the past eight years, the NRAO Very Large Array (VLA) has been used to construct Faint Images of the Radio Sky at Twenty centimeters. The FIRST survey was designed to produce the centimetric equivalent of the POSS-I Sky Survey, a uniform sky survey which surpassed existing radio surveys by a factor of 50 in both sensitivity and angular resolution. To date, nearly 8000 deg2 of the North Galactic Cap have been covered to a sensitivity limit of 1.0 mJy; 700,000 radio sources have been detected, all of which have astrometric accuracies of better than at 90% confidence (Becker et al. 1995; White et al. 1997).
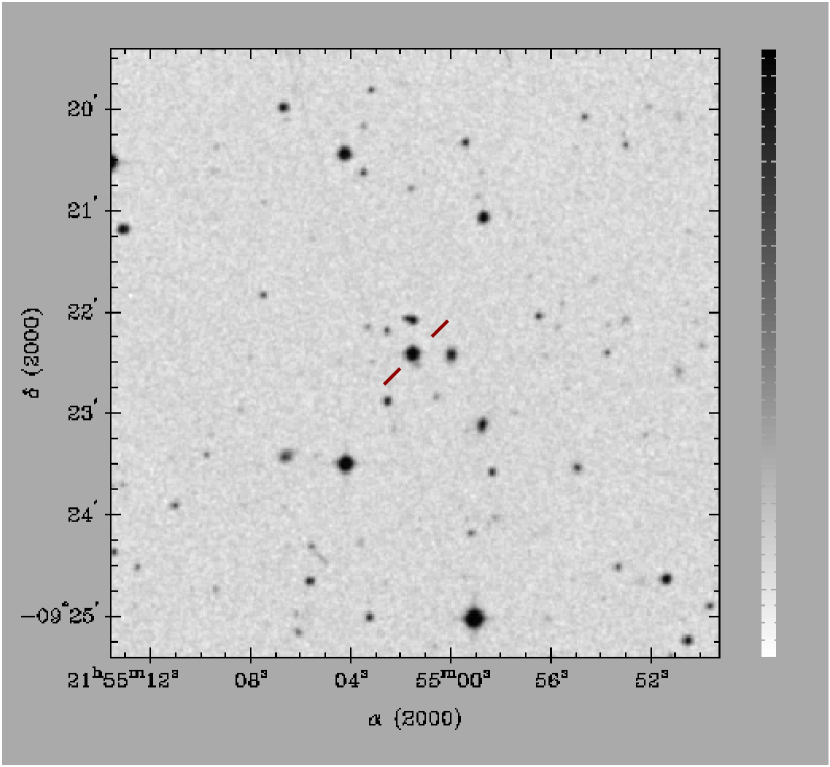
One of our major follow-up programs has been the FIRST Bright Quasar Survey (FBQS: Gregg et al. 1996; White et al. 2000). Using coincidences between FIRST radio sources and stellar objects on the POSS-I plates brighter than 18th magnitude, spectra have been obtained for counterparts, leading to the discovery of more than 1000 quasars and BL Lac objects, over 80% of which were previously unknown. Recently, extending this program to a strip in the South Galactic Cap, we discovered an extremely bright quasar at . Its magnitudes on the POSS I plates from the USNO catalog (Monet et al. 1996) are and , and it is of similar brightness on a UK Schmidt plate taken in 1988. Its absolute magnitude is (for ). These properties make it the second brightest quasar (in apparent magnitude) known with after 3C 273. Its position is (J2000) ; a finding chart is given in Figure 1. Its radio flux density at 20 cm is only 1.4 mJy, so although this object was first discovered in a radio survey, it is a radio quiet quasar. It is also a faint IRAS source. The only other mention of this object in the literature is as PHL 1811, one of the many blue “stars” in the Palomar-Haro-Luyten plate survey (Haro & Luyten 1962).
In this paper, we report optical and X-ray observations of this new bright quasar.
2 Optical Spectroscopy
PHL 1811 was observed at the Multiple Mirror Telescope on 1997 September 11 for 180 seconds. The spectral resolution was about 1.95Å per pixel.
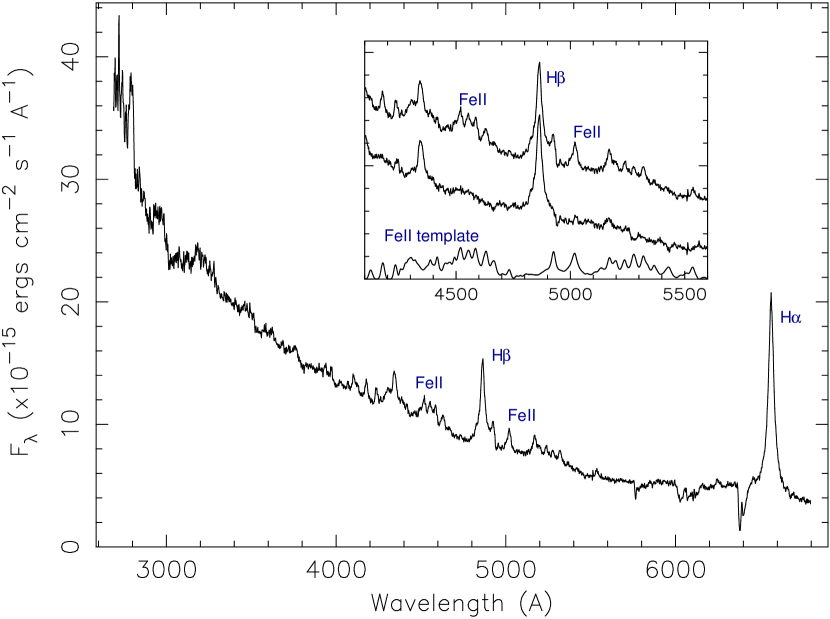
The spectrum is shown in Figure 2. It has been dereddened according to the Cardelli, Clayton, & Mathis (1989) law for Galactic reddening of E(BV)=0.046 magnitudes and shifted to the rest frame. The optical continuum is very blue. While blends of lines make characterization of the continuum difficult, we estimate that the slope is for between 3050 Å and 5600 Å. This is as blue as the bluest quasars observed (e.g., Grupe et al. 1998; also Grupe et al. 2000 & Siebert et al. 1999) and appears to be consistent with the continuum predicted by the classical thin accretion disk model (). The bluest part of the spectrum may not be reliable as the airmass during the observation was relatively high and the spectroscopic slit was not rotated to the parallactic angle (Filippenko 1982). However, this effect would tend to lead to a loss of blue photons in general.
The optical spectrum shows the narrow H, weak [O III] and strong Fe II characteristic of a Narrow-line Seyfert 1 galaxy (Osterbrock & Pogge 1985; Goodrich 1989). The region around H is cluttered with blends of Fe II, making the analysis of this region difficult, and therefore, to measure the width of the H line, we perform an Fe II subtraction using a template obtained from the prototype NLS1 I Zw 1. This procedure involves shifting the high signal-to-noise template to the rest wavelength of the quasar, broadening the template as necessary with a Gaussian, and subtracting the amplitude-scaled template from the spectrum. While not perfect, this method has been frequently used to clear the region around H of Fe II lines (Boroson & Green 1992; Grupe et al. 1999; Leighly 1999b, among others).
The Fe II subtracted spectrum is shown in the inset of Figure 1. We fitted the H line with a Lorenzian profile and obtain a FWHM of . The FWHM is less than , indicating that quasar can be classified as a Narrow-line quasar. H is somewhat narrower, with FWHM of . The Fe II-subtracted spectrum shows that there is no detected [O III] line. The blue continuum and lack of [O III] have been observed in another luminous Narrow-line Quasar, RX J1034.24258 (Grupe et al. 2000). We measure a Fe II to H ratio of 1.1, making this object moderately strong in Fe II emission compared with other NLS1s (e.g., Leighly 1999b). He II is also very weak or undetectable. We find that the ratio of H to H is 2.66, a ratio consistent with that expected from case-B recombination. This fact and the blue continuum suggest that there has been no significant reddening of the spectrum.
We extrapolated our spectrum to 2500Å in the rest frame and find that the monochromatic flux is approximately . For , this corresponds to a luminosity of . Wilkes et al. (1994) find an average slope between 2500Å and () of 1.62 for a quasar of this luminosity.
3 X-ray Observations
3.1 ROSAT
PHL 1811 is the second brightest quasar known beyond z=0.1. Based on the typical mentioned above, we expect that the count rate in the ROSAT PSPC 0.15–2.4 keV bandpass to be for a power law () plus Galactic absorption (; Dickey & Lockman 1990) model. PHL 1811 should be a relatively bright quasar in X-rays, and therefore it was a complete surprise to discover that this object is undetected in the ROSAT All Sky Survey (RASS).
We use the RASS events files to estimate an upper limit on the emission from this object. An examination of the events files indicated that PHL 1811 was scanned over a period of only hours. The exposure time listed for an object near PHL 1811 in the ROSAT Bright Source Catalog is 334 seconds, and we use this value for our estimate. The PSF in the survey is degraded from the nominal PSPC PSF at the aimpoint owing to the inclusion of data from the edge of the detector where aberrations are significant. We used a bright nearby source to estimate the effective PSF, and found a half-power radius of 111′′. After examining a large source-free region, we estimated that there should be 3.6 background photons in a region of this radius in 334 seconds. We observe only two photons in the region centered on the optical position of PHL 1811. Determining the upper limit on the source count rate becomes a problem of joint probability distributions: what is the net number of counts consistent with exactly two photons being observed and a background rate of 3.6 at a particular confidence level? Assuming the Poisson probability distribution applies, we find a 95% confidence upper limit of 2.2 photons. The source flux then is 4.4 photons in 334 seconds, yielding an upper limit of in the 0.1–2.4 keV ROSAT PSPC bandpass.
3.2 BeppoSAX Observation
A 40 ks BeppoSAX observation was approved as part of the Cycle 4 program and the observation was performed on 2000 May 16. We used the default SAXDAS extracted events files for analysis.
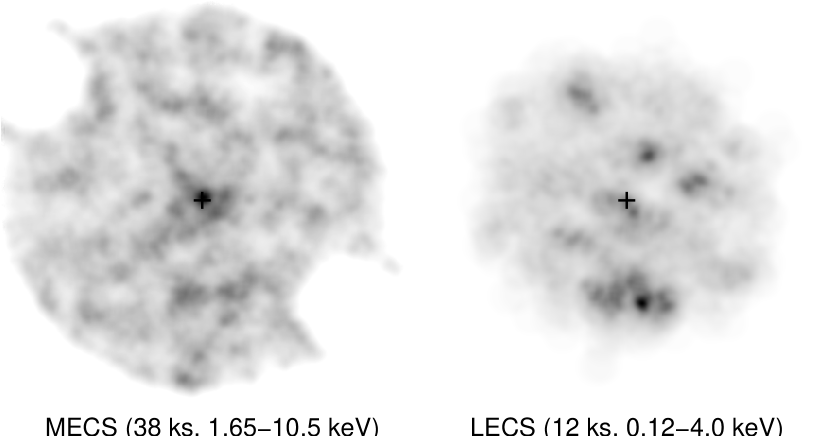
The net exposure in the MECS detectors is 38 ks. An adaptively smoothed image is shown in Figure 3. The position of the bright central source is consistent with the optical position of the quasar. We measure 183 photons between 1.65 and 10 keV in a extraction region centered on the quasar. Following the method of Fiore, Guainazzi & Grandi (1999), we scale blank sky background to match the background rate observed. In the region, there are 118 background photons, yielding 65 net counts in the MECS spectrum. The object is only barely detected in the shorter LECS observation (11.9 ks exposure). We return to this point below.
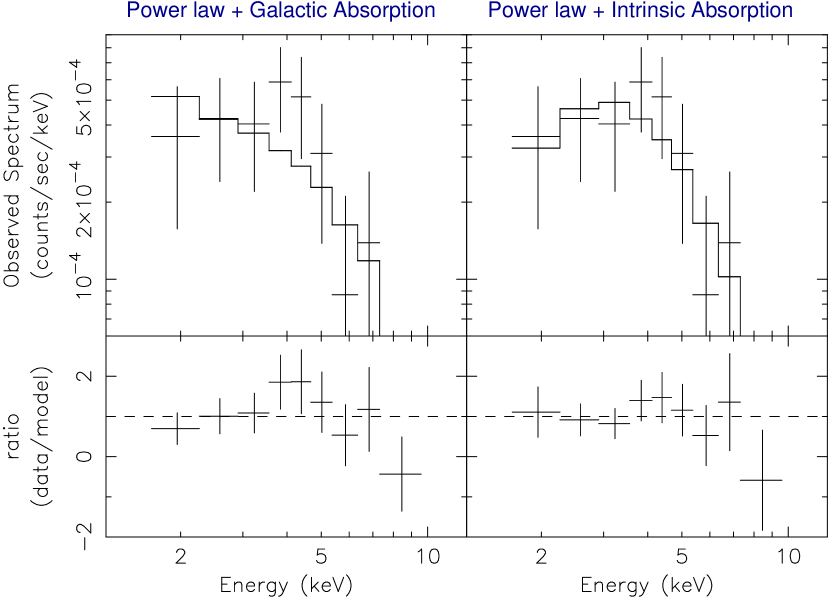
Clearly the poor statistics make any detailed spectral analysis unreliable. We fitted the MECS spectrum with a power law and Galactic absorption. The resulting fit is acceptable ( for 7 degrees of freedom). We find a rather flat best-fitting photon index of ; however, it is clearly not well constrained and the errors of 0.9–2.3 overlap the canonical value for AGN of , as well as the very flat value near expected if the spectrum is dominated by Compton reflection (e.g., Matt et al. 1996). The observed 2–10 keV flux is , and the intrinsic 2–10 keV luminosity is .
The power law model fits the spectrum adequately. However, the ratio of the data to the model shows a slight curvature that could indicate absorption intrinsic to the quasar (Figure 4). Furthermore, we would like to explore the range of intrinsic flux at 2 keV consistent with the spectrum for the discussion of the spectral energy distribution in Section 4. Adding absorption to the model, we find an improvement in the fit ( for 6 dof). The best-fitting photon index is 3.3, and the column density is in the rest frame of the quasar. These parameters are not well constrained. When we fix the photon index at , approximately the steepest value observed from NLS1s (e.g. Leighly 1999), and arguably the steepest value plausible, then the absorption column is . For these parameters, the intrinsic 2–10 keV luminosity is . Alternatively, if we require the unabsorbed flux at 2 keV to match that required for the nominal value of (see Section 4), a photon index of and an absorption column of are required, and an acceptable of 3.2 for 7 degrees of freedom is obtained.
We used the LECS data to try to differentiate between these candidate models. Using the fakeit command in XSPEC, we estimated the number of photons expected in the 0.1–4.0 keV LECS bandpass in a region. For the power law plus Galactic absorption model, 16.5 photons are expected, and for the two models including intrinsic absorption, 7–8 photons are expected. We observe 45 photons, and estimate that of them are background photons, by using the average background scaling method discussed in Fiore, Guainazzi & Grandi 1999. The number of source photons is then , showing that the LECS data cannot differentiate between models.
4 The Spectral Energy Distribution of PHL 1811
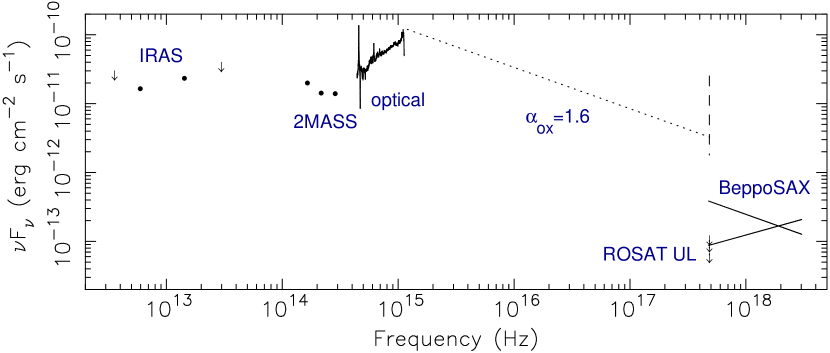
We constructed the spectral energy distribution (SED) in the rest frame of PHL 1811 using our optical spectrum, the ROSAT upper limits, the BeppoSAX results, as well as the IRAS flux points and the 2MASS , and filter photometry points (Figure 5). We do not plot the radio flux point; with , the point is too far off the scale of the plot. We caution that the optical spectrum was not made under photometric conditions; however, the optical flux is consistent with that measured from the POSS plates and a UK Schmidt plate and is therefore representative. We note that the X-ray and optical observations were not simultaneous. Therefore the derived SED is not definitive but is probably representative.
The SED is shown in Figure 5. A dotted line joins the extrapolated flux at 2500Å to the predicted flux at 2 keV computed using expected for the average quasar, and the dashed vertical line shows the approximate range of observed for quasars of this optical luminosity (estimated by eye from Figure 9 of Wilkes et al. 1994). The ROSAT upper limit is shown for three values of the assumed photon index (2.0, 2.5 & 3.0). The BeppoSAX results are shown by flat and steep power laws obtained for fits with intrinsic absorption and , and without intrinsic absorption. For the power law plus Galactic absorption model, we find =2.2. The X-ray flux at 2 keV in the rest frame is a factor of 34 below that expected for the average value of . For the power law () plus intrinsic absorption model, the inferred is 1.96, and the X-ray flux is a factor of 8 below that expected for the average value of . When we allow the absorption to increase to the limit of , the inferred X-ray flux is still at least 5 times smaller than the nominal value. Therefore, the data strongly suggest that, even after possible absorption is accounted for, PHL 1811 is intrinsically X-ray weak.
5 Discussion
PHL 1811 is classified optically as a Narrow-line Seyfert 1 galaxy with a quasar luminosity. Narrow-line Seyfert 1 galaxies are generally bright soft X-ray sources, comprising up to 50% of soft X-ray-selected samples of AGN (e.g. Stevens 1989; Grupe et al. 1999). Based on average quasar properties, we expect PHL 1811 to be 34 times brighter at 2 keV than it was observed to be in our BeppoSAX observation and than implied by the ROSAT All Sky Survey upper limit. We speculate on why it may be so faint in X-rays below.
5.1 Is PHL 1811 the Brightest BALQSO?
Broad-absorption line quasars are recognized by deep broad absorption lines in their UV spectra. It has been shown that BALQSOs are typically either weak X-ray sources or not detected at all (e.g. Green & Mathur 1996 for ROSAT pointed observations; Gallagher et al. 1999 for ASCA observations). More recently, it has been demonstrated that many objects that appear to be deficient in soft X-rays also show absorption lines in their UV spectra (Brandt, Laor & Wills 1999). In fact, these authors find that the equivalent width of the C IV1549 absorption line is inversely correlated with , where in this case is defined as the slope between 3000Å and 2 keV. For our data, this alternative is 2.15 and, based on Brandt, Laor & Wills (1999) results, we can expect PHL 1811 to be a BALQSO and have a C IV absorption line equivalent width Å. If this turns out to be the case, PHL 1811 will be the brightest BALQSO known by far. PHL 1811 is probably not a low-ionization BALQSO, though, as there is no evidence for absorption lines blueward of Mg II in our optical spectrum.
If PHL 1811 is a BALQSO, then the X-ray emission that we see may be from a very steep spectrum that is very highly absorbed, although the required photon index of 4.4 is so steep that it seems unphysical. Alternatively, the intrinsic spectrum could be completely absorbed, and the photons that we see have been scattered towards us by an electron scattering mirror (e.g. Gallagher et al. 1999). We note that the polarization properties of this quasar are not yet known.
5.2 Is PHL 1811 the Brightest Variable Quasar-luminosity NLS1?
Besides being known for their typically bright soft X-ray emission, Narrow-line Seyfert 1 galaxies are also known for their high-amplitude, rapid variability. Detailed analysis of NLS1 light curves reveals, however, that the character of the variability is not uniform across the class. NLS1s with very strong soft excess components in their ASCA spectra show very high amplitude X-ray variability (Leighly 1999ab). The light curves from these objects consists of flares and quiescent periods, and during their quiescent periods, the objects would be classified as X-ray weak. Two objects in particular appear to be deficient in X-rays even when their time-averaged X-ray spectrum is considered: non-simultaneous HST STIS and ASCA observations of IRAS 132243809 and 1H 0707495 are consistent with a value of of 1.63 whereas the expected value is 1.4 for quasars of their luminosity. There is little evidence for absorption in their X-ray spectra (Leighly 1999b), and no evidence for intrinsic absorption lines in their UV spectra (Leighly & Halpern 2001). PHL 1811 is much more luminous than these quasars, so it seems possible that it could have been in the quiescent state for the entire BeppoSAX observation or RASS scan period (elapsed time 24 and hours respectively).
5.3 Is PHL 1811 Intrinsically X-ray Weak?
We have recently been examining several luminous NLS1s identified in the ROSAT All Sky Survey and have found unusual X-ray behavior that suggests they may become, intermittently, intrinsically X-ray weak. A particular example is RX J2217.95941, a luminous NLS1 similar to PHL 1811 in that it also has a very blue optical spectrum and strong Fe II emission (Grupe, Thomas & Leighly 2001). RX J2217.95941 was bright during the ROSAT All Sky Survey, but it faded through two subsequent ROSAT HRI observations and an ASCA observation. At the same time, the optical flux remained constant, and the inferred at the time of the last ROSAT HRI observation was 2.0, much steeper than the expected value of 1.5 (Wilkes et al. 1994). Although the ASCA analysis was hampered by poor statistics and contamination by nearby sources, we find no evidence for X-ray absorption. Although other explanations are possible, we suspect that RX J2217.95941 is now intrinsically X-ray faint.
We point out that there is no obvious reason why intrinsically X-ray weak quasars should not exist. A QSO arguably cannot exist without some kind of accretion disk as a source of fuel and also as a source of ionizing photons to power the observed optical and UV emission lines. However, in a luminous quasar, the continuum emission observed from the accretion disk itself is expected to be confined to the optical and UV. Hard X-ray emission, on the other hand, is thought to be created in a corona that is separate from the accretion disk in luminous AGN. When poorly-sampled light curves seemed to indicate that X-ray and UV variability was correlated, it was thought that much or perhaps all of the accretion energy was released in the corona, and that the disk reprocessed some of that radiation into the optical and UV bands (e.g. Svensson & Zdziarski 1994). However, recent observations with better sampling show that hard X-ray reprocessing is clearly not a dominant effect in some objects (Nandra et al. 1998). Therefore, AGN do not need to have coronae, and they may be absent in some objects. The only reason to consider a corona necessary, in our current understanding of AGN, is so that reprocessing can power the tightly correlated UV and optical variability. However, as there has never been concentrated broad-band monitoring done on an object similar to PHL 1811, so we cannot predict its broadband continuum behavior.
Why should PHL 1811 lack a hard X-ray emitting region? At this point, we can only speculate. As discussed by Laor (2000), narrow Balmer lines in very luminous AGN may imply extremely high accretion rates, if the width of the lines is dominated by virial motions, and therefore PHL 1811 may have an extremely high accretion rate. We note that RX J2217.95941, which seems to have similar X-ray properties, is also a very luminous NLS1. One possible geometry suggested for accreting black holes is a central hot optically-thin geometrically-thick X-ray emitting region, and a optically-thick geometrically-thin optical and UV emitting accretion disk with large inner radius. At high accretion rates, it might be expected that the inner radius of the accretion disk would stretch down to the innermost stable orbit, and the central hot X-ray emitting region would not be present. Another possible geometry assumes an X-ray emitting corona on top of the accretion disk, where the corona is fed by reconnecting magnetic flux tubes that rise buoyantly from the accretion disk. In this case, perhaps the corona is present but is quenched by the strong UV emission from the disk. Alternatively, recalling that an accretion disk is in some ways similar to a star, the feeding of the corona may be disrupted, and the magnetic field strength may be less in a radiative disk (similar to high mass stars) than in a convective disk (similar to low mass stars).
UV spectroscopic observations will show us whether PHL 1811 has deep absorption features characteristic of a BALQSO. Such observations have been approved as part of the HST Cycle 10 program, and FUSE GTO observations are also planned. Two approved Chandra observations will help us understand whether or not the X-rays are absorbed, and whether there is variability that would tend to rule out scattering models for the X-rays.
References
- Becker, White & Helfand (1995) Becker, R. H., White, R. L., & Helfand, D. J., 1995, ApJ, 450, 559
- Boroson & Green (1992) Boroson, T., & Green, R. F., 1992, ApJS, 80, 109
- Brandt et al. (2000) Brandt, W. N., Laor, A., & Wills, B. J. 2000, ApJ, 528, 637
- Cardelli et al. (1989) Cardelli, J. A., Clayton, G. C., & Mathis, J. S., 1989, ApJ, 345, 245
- Dicky & Lockman (1990) Dickey, J. M., & Lockman, F. J., 1990, Ann. Rev. Astron. & Astrophys. 28, 215
- Filippenko (1982) Filippenko, A. V., 1982, PASP, 94, 715
- Fiore et al. (1999) Fiore, F., Guainazzi, M., & Grandi, P., 1999, Handbook for BeppoSAX NFI Spectral Analysis, ftp://www.sdc.asi.it/pub/sax/doc/software_doc/saxabc_v1.2.ps.gz
- Gallagher et al. (1999) Gallagher, S. C., Brandt, W. N., Sambruna, R. M., Mathur, S., & Yamasaki, N., 1999, ApJ, 519, 549
- Goodrich (1989) Goodrich, R. W., 1989, ApJ, 342, 224
- Gregg et al. (1996) Gregg, M. D., Becker, R. H., White, R. L., Helfand, D. J., McMahon, R. G., & Hook, I. M., 1996, AJ, 112, 407
- Green & Mathur (1996) Green, P. J., & Mathur, S., 1996, ApJ, 462, 637
- Grupe, Thomas & Leighly (2001) Grupe, D., Thomas, H.-C., & Leighly, K. M., (2001), A&A, accepted
- Grupe et al. (2000) Grupe, D., Leighly, K. M., Thomas, H.-C., Laurent-Muehleisen, S. A., 2000, A&A, 356, 11
- Grupe et al. (1999) Grupe, D., Beuermann, K., Mannheim, K., & Thomas, H.-C., 1999, A&A, 350, 805
- Grupe et al. (1998) Grupe, D., Beuermann, K., Thomas, H.-C., Mannheim, K., & Fink, H. H., 1989, A&A, 333, 827
- Haro & Luyten (1962) Haro, G., & Luyten, W. J., 1962, Bol. Inst. Tonantzintla, 3, 37
- Matt et al. (1996) Matt, G., Fiore, F., Perola, G. C., Piro, L., Fink, H. H., Grandi, P., Matsuoka, M., Oliva, E., & Salvati, M., 1996, MNRAS, 281, 69
- Laor (2000) Laor, A., 2000, NewAR, 44, 503
- (19) Leighly, K. M., 1999, ApJS, 125, 297
- (20) Leighly, K. M., 1999, ApJS, 125, 317
- Leighly & Halpern (2001) Leighly, K. M., & Halpern, J. P., 2001, in preparation
- Monet et al. (1996) Monet, D., et al., 1996, USNO-SA2.0, (U. S. Naval Observatory, Washington DC)
- Nandra et al. (1998) Nandra, K., Clavel, J., Edelson, R. A., George, I. M., Malkan, M. A., Mushotzky, R. F., Peterson, B. M., & Turner, T. J., 1998, ApJ, 505, 594
- Osterbrock & Pogge (1985) Osterbrock, D. E., & Pogge, R. W., 1985, ApJ, 297, 166
- Siebert et al. (1999) Siebert, J., Leighly, K. M., Laurent-Muehleisen, S. A., Brinkmann, W., Boller, Th., & Matsuoka, M., 1999, A&A, 348, 678
- Svensson & Zdziarski (1994) Svensson, R., & Zdziarski, A. A., 1994, ApJ, 436, 599
- Stephens (1989) Stephens, S. A., 1989, AJ, 97, 10
- White et al. (1997) White, R. L., Becker, R. H., Helfand, D. J., & Gregg, M. D., 1997, ApJ, 475, 479
- White et al. (2000) White, R. L., et al., 2000, ApJS, 126, 133
- Wilkes et al. (1994) Wilkes, B. J., Tananbaum, H., Worrall, D. M., Avni, Y., Oey, M. S., & Flanagan, J., 1994, ApJS, 92, 53