New results on the temporal structure of GRBs
Abstract
We analyze the temporal structure of long () and short () BATSE bursts. We find that: (i) In many short bursts (where is the shortest pulse). This indicates that short bursts arise, like long ones, in internal shocks. (ii) In long bursts there is an excess of long intervals between pulses (relative to a lognormal distribution). This excess can be explained by the existence of quiescent times, long periods with no signal above the background that arise, most likely, from periods with no source activity. The lognormal distribution of the intervals (excluding the quiescent times) is similar and correlated with the distribution of the pulses width, in agreement with the predictions of the internal shock model.
Introduction
The variability of GRBs provided the main evidence for the internal-external shocks scenario. External shocks cannot produce efficiently such variability 1 . Internal shocks can produce such temporal structure provided that there are two time scale within the “inner engine” - a short time scale that produces the variability and a long time scale that determines the duration of the burst. So far variability was shown only for long bursts. It is an open question whether short bursts arise in internal shocks as well. Using a new algorithm 2 we study their variability. We also present some new results on the temporal structure of long bursts. Our results provide further support for the internal shocks scenario and show that three different time scales operate within the “inner engine”.
Variability of short bursts
We analyze the distribution of (where is the duration of the shortest pulse in a burst, and is the total duration of the burst) in a sample of the brightest 33 short bursts (peak flux in 64ms4.37) with a good TTE data coverage (for BATSE data types review 3 ). The TTE data is binned into 2msec time bins. We compare the results to a sample of 34 long bursts with the same peak flux, using the 64ms concatenate data to which we have added a Poisson noise so that the signal to noise ratio of both samples would be similar. We call this later sample the ’noisy long’ set.
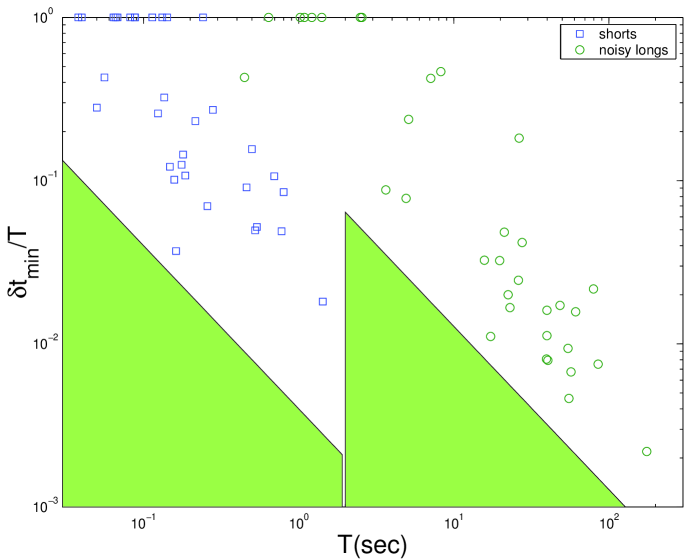
Fig 1 depicts in both data sets: ’short’ and ’noisy long’. In the ’short’ set the median of is 0.25. 35% of bursts have and 35% of the bursts show a smooth structure (). This result could mislead us to the conclusion that a significant fraction of the short bursts have a smooth time profile. But a comparison with the ’noisy long’ results show that also in this group more than 20% of the bursts are single pulsed, while there were no such bursts in the original (without the added noise) ’long’ set.
We conclude that short bursts are variable and hence are most likely produced in internal shocks. While the observed variability is not as large as seen in long bursts one has to remember that when studying variability of short bursts we are approaching the instrumental limitations both in terms of the time scales and of the signal to noise ratio. It is possible that 10%-20% of the short bursts are produced by external shocks.
The pulses’ width and the intervals between pulses
According to the internal shocks model 4 the source ejects relativistic shells with different velocities and shocks arise when faster shells catch slower ones. We show in 5 that both the pulses‘ width and the intervals between pulses are proportional to the same parameter - the separation between two following shells, namely the variability time scale of the “inner engine”. Therefore both distributions should be similar. Moreover, any interval should be correlated to the width of its neighboring pulses.
We have applied our algorithm to a sample of the 68 brightest long bursts in BATSE 4B catalog (peak flux in 64ms10.19) . This resulted in 1330 pulses (1262 intervals). Our null hypothesis was that both and , have lognormal distributions. The test gives a probability of that the pulses width were taken from a lognormal distribution with () and ( corresponds to between 0.5 and 2.3sec).
The distribution shows, however, an excess of long intervals relative to a lognormal distribution. The probability for a lognormal distribution is . McBreen6 ; 7 and Li & Fenimore8 suggest that this deviation is due to the limited resolution (64ms). However, fitting the intervals above the median with a half Gaussian fails. The inconsistency is not due to the resolution.
Many of the long intervals are dominated by a quiescent time: periods within the burst with no observable counts above the background noise. When excluding all the intervals that contained a quiescent time the probability that the data is lognormal is , with () and ( corresponds to between 0.53 and 3.1sec).
The similarity between the parameters of both distributions is remarkable. Moreover, we find, as predicted by the internal shocks model, a linear correlation, , between intervals and the following pulses. The average is 0.48, showing a strong correlation.
Conclusions
For most short bursts . This suggests that these bursts are produced by internal shocks. If, later, the ejecta encounters a surrounding ISM then we expect it to produce an external shock and emit an afterglow. For some (30% of our sample) short bursts . However, a comparison with the ’noisy long’ set, shows that this feature could very well be due to the noise. We cannot rule out the possibility that 10%-20% of the short bursts are produced by external shocks or by a single internal collision.
The distribution of interval between pulses shows an excess of long intervals relative to a lognormal distribution. After removing intervals that include quiescent times the distribution is consistent with a lognormal distribution with comparable parameters to the pulse width distribution. This result suggests that the distribution is made from the sum of two different distributions: A lognormal distribution that is also compatible with the distribution and the quiescent times distribution. As reflects the central engine behavior, this suggests that there are two different mechanisms operating within the source. A short time scale mechanism, with a lognormal distribution and a longer time scale mechanism that turns the central engine on and off and is responsible for the quiescent times. Results that support this suggestion were obtained by Ramirez & Merloni 9 . The correlation between the interval and the following pulse confirms this suggestion and is in an excellent agreement with the internal shocks model.
References
- (1) Sari, R. & Piran, T., 1997, ApJ 485, 270
- (2) Nakar, E. & Piran, T., 2001A in preparation
- (3) Scargle, J. D. 1998, ApJ v.504, p.405
- (4) Rees. M. J. & Meszaros, P.,1994, ApJ, 430, L93
- (5) Nakar, E. & Piran, T., 2001B in preparation
- (6) McBreen B. personal communication
- (7) McBreen, B., et. al. 1994, MNRAS, 271, 662
- (8) Li, Hui; Fenimore, E. 1996, ApJ 469, L115
- (9) Ramirez-Ruiz, E., Merloni, A., 2001, MNRAS 320 L25