The Environments of a Complete, Moderate-Redshift Sample of FIRST Bent-Double Radio Sources
Abstract
We present an optical spectroscopic and imaging study of the environments of a complete sample of moderate-redshift, bent-double radio sources. More than half of the forty radio galaxies in the sample are associated with Abell richness class 0 or greater clusters at . Most of the remaining objects are associated with groups, although a few appear to be hosted by nearly isolated elliptical galaxies. For the bent doubles appearing in poor environments, either dense gas must be associated with the systems to provide the ram pressure to bend the lobes, or alternative bending mechanisms will have to be invoked to explain the radio morphologies. Correlation with the All Sky Survey Bright and Faint Source Catalogs reveals the majority of the objects in our sample that we classify optically as clusters are also X-ray sources.
1 Introduction
With increasing redshift, optical and X-ray survey techniques for finding galaxy clusters lose their effectiveness and a targeted approach is warranted. In particular, radio galaxies can be used as cluster signposts. Dickinson (1996) has identified clusters around powerful 3C sources at redshifts greater than 1.2, and Deltorn et al. (1997) discovered a cluster of galaxies around 3CR 184 at . Clusters of varying richness have also been seen around the radio galaxies studied by Hill & Lilly (1991 – hereafter H&L91) and by Zirbel (1997 – hereafter Z97), among others. However, some kinds of radio galaxies are more often associated with clusters than others, and are therefore more efficient tracers of these high-density environments.
Over two decades ago, Fanaroff & Riley (1974) discovered a correlation between the power of an extended radio source and its morphology, and divided all such sources into two classes. FR I radio galaxies typically have powers less than at 1440 MHz (assuming a power law spectrum with ), bright radio cores, and lobes fading toward the edges. FR II’s have with dim or absent cores and edge-brightened lobes. More recent work has shown that the dividing line in power between FR I’s and II’s is a function of optical luminosity (Ledlow & Owen 1996; Owen & White 1991).
FR I and II radio sources are associated with host galaxies located in different environments on the megaparsec scale (H&L91; Z97). Elliptical galaxies with a wide range of optical magnitudes can play host to both FR I and II sources (Ledlow & Owen 1995a; Ledlow, Owen, & Eilek 2000). The more powerful FR I galaxies (those near the FR I/II break such as the wide-angle and narrow-angle tail sources discussed below) are often associated with cD or D galaxies found in rich groups or clusters at all redshifts up to z 0.5, the limit of current studies. FR II sources are usually found in poor groups at low-z, although at higher redshifts (), groups surrounding FR II’s appear to be richer by a factor of . The hosts of some FR II’s are quasars.
A source’s radio morphology may become distorted as a consequence of the relative motion between the host galaxy and the surrounding intracluster medium (ICM) or via interaction with a neighboring galaxy. Common distortions in FR I sources include wide-angle tail (WAT) and narrow-angle tail (NAT) morphologies which have large and small opening angles, respectively. The classical explanation for the bending of the lobes is the ram pressure exerted by the ICM as a galaxy with a significant peculiar velocity moves through a cluster (Owen & Rudnick 1976). An alternate explanation (Burns et al. 1996; Roettiger, Burns, & Loken 1996; Burns et al. 1993) has the ICM in motion rather than the galaxy, since WATs are often associated with cD galaxies which have small peculiar velocities relative to the immediately surrounding cluster. In this scenario, the ICM is set in motion by the merging of clusters or smaller sub-clumps; evidence for this view is found in the alignment of X-ray emission contours with the bending of the lobes (Gómez et al. 1997). FR II sources may also become distorted; sometimes the distortions appear symmetric and may result from ICM interaction, whereas at other times the sources have an asymmetric appearance most likely caused by interaction with a neighboring galaxy (Rector, Stocke, & Ellingson 1995).
A VLA survey of nearby Abell clusters (Zhao et al. 1989; Ledlow & Owen 1995a, 1995b, 1996) found that 95% of the radio sources in the clusters were type FR I. In a radio continuum survey of distant () X-ray-selected clusters from the Medium Sensitivity Survey, Stocke et al. (1999) found that cluster radio sources were of type FR I, and most exhibited WAT or NAT morphologies. They found no difference in the radio luminosity function at these redshifts compared to that seen nearby, and concluded that there is no evidence for evolution in the population of rich cluster radio galaxies between and the present epoch. To explain the absence of FR II sources in these clusters, Stocke et al. hypothesize that when FR II sources seem to appear in cluster environments (as in H&L91 and Z97), the clusters they appear in may contain a lower density intracluster medium. By definition, all of the clusters in the Stocke et al. sample have dense ICM because they were selected as bright X-ray sources.
FR I bent-double radio sources (WATs and NATs) then, appear to trace out high-density regions in the Universe. These may appear as clusters, groups, or even ’fossil-groups’ – large elliptical galaxies that have cannibalized their neighbors leaving behind the dense gas once associated with the doomed cluster or group (Ponman et al. 1994; Vikhlinin et al. 1999; Romer et al. 2000).
Previous authors have surveyed the radio properties of clusters selected at optical or X-ray wavelengths (e.g. Ledlow & Owen 1995a, 1995b, 1996; Stocke et al. 1999) or have studied the environments of mostly high-power FR I and II radio sources (e.g. Hill & Lilly 1991; Zirbel 1997). Here we examine the environments of a morphologically selected sample of radio sources. We derived our sample of bent-double radio galaxies from the VLA FIRST survey (Faint Images of the Radio Sky at Twenty-cm; Becker, White, & Helfand 1995) with the initial goal of using them as tracers of distant clusters of galaxies (Blanton et al. 2000). We found that the bent doubles, combined with optical selection criteria, had an 80% success rate at finding distant clusters (up to ). Here, we present a complete, low- to moderate-redshift sub-sample of the bent-double sources in order to study their environments, as well as to quantify their success rate at finding clusters. In addition, we search for correlations between the radio and optical properties of the sources and their surroundings to determine whether any radio properties point toward cluster association. Finally, we correlate our sample with the ROSAT All Sky Survey.
We use and, except as otherwise noted, throughout this paper.
2 The Sample
Our sample of radio galaxies was selected from the FIRST survey currently being undertaken at the VLA using the B configuration (Becker, White, & Helfand 1995). The survey is projected to cover the 10,000 deg2 of the North Galactic Cap plus a supplementary region between and Dec in the range 21.5R.A.3.5 h. The peak flux density threshold is 1.0 mJy at 20 cm, the angular resolution is 5′′, and the astrometric accuracy for all detected sources is better than . In the 3000 deg2 region surveyed as of the April 1997 catalog release, FIRST detected approximately 270,000 radio sources of which 32,000 are double or multiple sources with separations less than (as of this writing, FIRST has covered 8000 deg2 and detected 722,000 sources). From the April 1997 catalog, we selected 384 sources which exhibit the bent-double morphology. The peak and integrated 20 cm flux densities of these sources are typically a few mJy and 10 - 100 mJy, respectively.
The sample was constructed by visually inspecting grayscale plots of all FIRST sources having more than one component within a circle of radius 60′′. All images were examined independently by three of us (ELB, RHB and DJH); unambiguous distortion of the radio lobes was required. If at least two out of three examiners selected a source, it was included in the sample. Objects chosen by only one of us were re-examined, and a few of these were added to the sample. The sample contains a large fraction of FR I radio galaxies, as these are more frequently found to be distorted than are FR II’s which most often appear as collinear classical doubles.
Our sample of 384 objects consists of 50% FR I sources, 25% FR II sources, and 25 % FR I/II (sources with intermediate morphologies). Thirty-three (8.5%) of these sources are within 5 arcmin of the center of an Abell cluster. We selected and classified these before knowing of their cluster associations; of these 33, we classified 80 as FR I, 10 as FR II, and 10 as FR I/II. The bent-double sources are easily recognizable by FIRST to , providing us with a good opportunity to find new moderate- to high-redshift clusters. Some of the sources classified as FR I/II and II may be FR I’s that have had extended emission resolved out by FIRST and/or have had their apparent morphologies altered by 1/ surface brightness dimming. However, the high surface brightnesses and small angular extents of the lobe hot spots which characterize FR II’s make it unlikely that an FR II would be misclassified as an FR I. Thus, even after allowing for some classification errors, the majority of our sources are of type FR I. The most common morphology in our sample is the wide-angle-tail (WAT) radio source.
2.1 Defining a Complete Sample
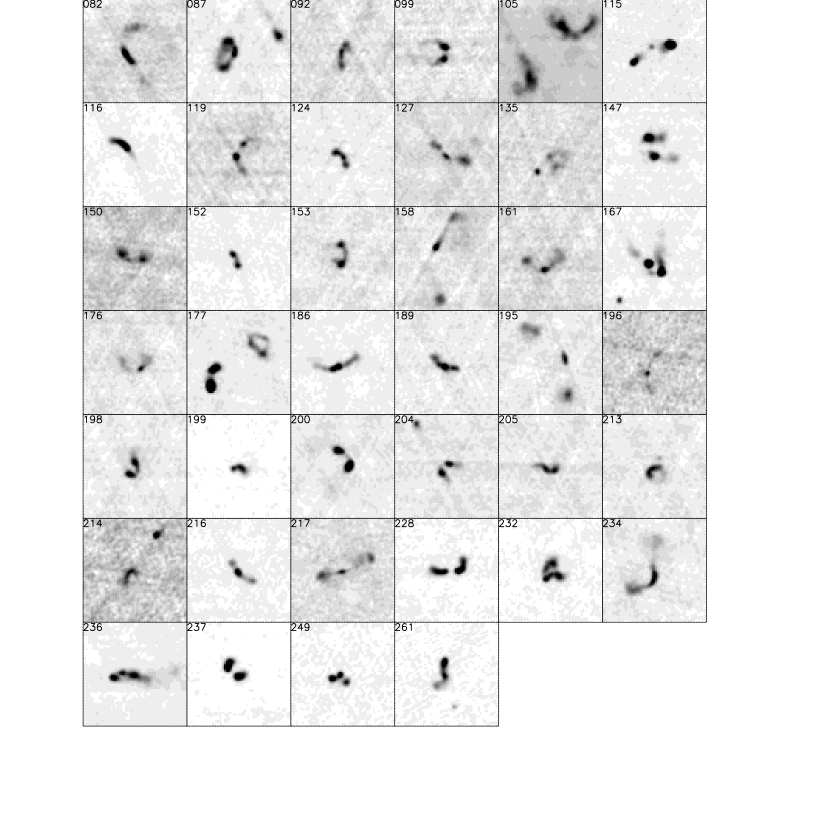
The complete sample studied here was chosen to be area- and magnitude-limited. It contains all bent-double sources from our sample of 384 within the range and , and with R-magnitudes brighter than m for the optical counterparts. There are 99 bent doubles in the RA and Dec ranges listed above, of which 45 have host magnitudes above our chosen limit. Two objects were eliminated because their spectra indicated that they were stars (at least one of these was an obvious misidentification); in addition, one object was eliminated because we did not obtain a redshift for it although it fell just inside the magnitude limit, one object had a spectrum but no image taken, while one was not observed at all due to observing-time constraints. Our final sample includes 40 objects. A log of the optical and spectroscopic observations is given in Table 1. Postage-stamp grayscale images of the radio sources are displayed in Figure 1, and the properties of the bent doubles are presented in Table 2. Column (1) lists the identification number, and columns (2) and (3) give the source position, which is either the position of the radio core if there is one, or the position of the optical identification. Column (4) lists the redshift, column (5) contains the total R-magnitude, column (6) lists the integrated flux density taken from the NRAO/VLA Sky Survey (NVSS, Condon et al. 1996), since FIRST may resolve out some of the extended emission. Column (7) lists the ratio of NVSS to FIRST flux, column (8) lists the power at 1440 MHz (assuming a power law spectrum with ), column (9) gives the opening angle of the bent-double source, column (10) lists the total unbent angular size of the source – from the edge of one lobe to the core, and out to the edge of the other lobe. Column (11) lists the corresponding linear size, while column (12) gives our estimate of the Fanaroff & Riley (1974) classification (where a class of I/II means it was difficult to determine), and column (13) gives comments including known cluster associations. Unless otherwise stated in column (13), the optical identifications for all of these appear to be elliptical galaxies.
3 Optical Observations and Initial Analysis
3.1 Images
All of the objects were observed at the MDM Observatory with the 2.4m telescope and the Echelle CCD with the exception of three sources (#082, 236, and 237) for which imaging information was taken from the literature. The observations were accomplished during three February observing runs, in 1998, 1999, and 2000. The observing date and exposure time for each object are listed in Table 1. All of the bent-double fields were observed through an R-band filter. The 1998 run used a 2-inch RKPNO filter and the 1999 and 2000 runs employed the 4-inch RMDM filter. The Echelle CCD has an area of 20482048 pixels and an image scale of 275 arcsec/pixel, yielding a total field of view of 9.4 arcmin2. This f.o.v. was reduced to 8.0 arcmin2 for the 1998 run (from which we include observations for only three of the bent doubles) because the filter was not large enough to cover the entire CCD.
For the 1998 and 1999 runs, three exposures were taken for each field, dithering in-between so that chip defects would average out. For the 2000 run, one long exposure was taken for each bent double. Standard stars were observed at least three times during the night. The images were corrected for bias, overscan, and flatfield effects in a standard manner using IRAF111IRAF (Image Reduction and Analysis Facility) is distributed by the National Optical Astronomy Observatories, which are operated by the Association of Universities for Research in Astronomy, Inc., under cooperative agreement with the National Science Foundation. The separate exposures taken for each bent-double field were aligned and average-combined to remove cosmic rays and increase the signal-to-noise ratio. Those fields with only one exposure were cleaned for cosmic rays (defined as pixels above a certain flux ratio as compared with neighboring pixels) using the IRAF task ’cosmicrays.’
Observations were taken under photometric conditions. Standard stars from the Landolt (1992) catalog were used for calibrations. Color, extinction, and zero-point terms were derived each night. The average (mean) color term derived for the 1999 observations was and the average extinction term was . For the 2000 observations, we found and . For the one-night 1998 run, the derived color term was negligible () and, because of standard star limitations, we were unable to derive a reliable extinction term; standard stars observed at the same airmasses as the objects were used to derive the photometry. The photometry for objects observed during both the 1998 and 2000 runs is consistent: the 1998 magnitudes are higher by mag.
A catalog of objects was created for each bent-double field containing all sources detected at least 3 above the sky level. Total magnitudes were measured using FOCAS (Faint Object Classification and Analysis System – Valdes 1983) and are listed in Table 2. The area used for determining the “total” magnitude was found by increasing each object’s isophotal area by a factor of two. FOCAS missed some of the flux for very bright, extended objects and the magnitudes listed for these have possible errors as high as mag. As we obtained only R-band data, an estimate of the (V-R) color of an elliptical galaxy at the redshift of the radio host was taken from the no-evolution models of Coleman, Wu, and Weedman (1980).
3.2 Spectroscopy
A log of the spectroscopic observations is included in Table 1. Most of the observations were performed at the MDM 2.4m telescope with the MkIII spectrograph and the Echelle CCD. Redshifts for three objects (#82, 236, and 237) were taken from the literature, while spectra for two objects are from Lick Observatory, one is from the KPNO 4m telescope, and one was observed with the Keck II telescope (Blanton et al. 2000). Spectra for an additional four objects were obtained at MDM in December 1998 and were kindly provided by J. Halpern. The majority of the spectroscopic observations at MDM were completed during two runs – February 1998 and 1999. They were done in longslit mode, with slit widths of 1. (February 1998) and 1 (February 1999). Both runs used the 600 lines/mm grism with a central wavelength of 5800 . This setup gave a dispersion of 2.27 /pixel. High signal-to-noise ratio data were obtained in the wavelength range 4500 – 8000 . The spectral resolution is approximately 10 .
The spectroscopic frames were reduced following standard IRAF procedures. They were corrected for bias, overscan, and flatfield effects. When only one exposure of a field was available ’cosmicrays’ was run to clean the field. If two exposures were taken, they were averaged with cosmic rays rejected. A spectrum of the bent-double radio source was extracted in each case, and was wavelength- and flux-calibrated. The wavelength calibrations were derived using comparison lamp observations taken at the beginning and/or end of each night. The data were flux-calibrated using observations of KPNO spectrophotometric standard stars.
All of the spectra, excepting those of the quasars (#115, 189, and 249), had absorption lines consistent with old stellar populations that would be expected in elliptical galaxies (consistent with their morphologies). Four (11%) of the non-quasar spectra also had emission lines, typically of [OII] , H , and [OIII] and .
Redshifts were obtained by performing a Fourier cross-correlation between each galaxy’s spectrum and a template (M32 shifted to the rest-frame), using the task FXCOR in IRAF. Errors were computed in FXCOR and represent the fitted peak height and the asymmetric noise, or “r-value” (Tonry & Davis 1979), and are typically 100 – 200 km s-1. Each of the three quasars had only one broad, bright, emission line, which we assume is Mg II, since other prominent lines would not be expected to appear alone over the wavelength coverage of our spectra. Redshifts for all objects in the sample are listed in Table 2.
4 Radio Properties
The radio properties of the sources are also listed in Table 2. Most of the sources have powers typical of WAT radio sources, within a factor of three of 5 W Hz-1 at 1440 MHz (O’Donoghue et al. 1993). Of the 40 sources, we classify 27 (68%) as FR I, 8 (20%) as FR II, and 5 (12%) as FR I/II. This is similar to the distribution of types for the whole 384-object bent-double sample. The higher fraction of FR I’s in our low-to-moderate redshift complete sample is at least partly due to surface brightness dimming of high- sources; the extended lobe emission may not be detected in FR I’s at high-, leading to erroneous classification as FR II’s, and producing a higher fraction of FR II’s in the parent sample.
The angular resolution of the FIRST survey is necessary to recognize the bent double morphology and to determine unambiguously the optical counterpart. However, the angular resolution of the FIRST survey resolves out some of the extended emission. Thus, we use the NVSS survey (angular resolution ) in reporting the source integrated flux densities in Table 2. The mean ratio of NVSS to FIRST flux density for the individual sources in the complete sample is 1.3, with a range in values from 1.0 to 3.1.
5 Richness of the Bent-Double Fields
A catalog of objects detected at least 3 above the sky was created in FOCAS for each bent-double field. Total magnitudes were determined by measuring the flux within twice each object’s isophotal area. Sky values were determined locally. To improve sky subtraction and avoid subtracting off flux from an object’s extended envelope, we increased the distance of the sky buffer (the distance from the edge of an object’s isophote to the edge of the annulus where sky is measured) from the FOCAS default value to be large enough that magnitudes no longer changed as the buffer distance was increased.
Richness values for the bent-double fields were estimated following the method used by Allington-Smith et al. (1993) and Z97. The richness statistic measures galaxies within a 0.5 Mpc radius of the radio galaxy, and with absolute magnitudes brighter than (which is ). This is similar to an Abell-type richness measurement, although Abell (1958, 1989) used the magnitude range to , where is the third brightest cluster member. In all but very nearby clusters, and without spectroscopy for at least several members, the third brightest member is difficult to identify because of the superposition of foreground and background galaxies on the plane of the cluster. In addition, the statistic has the virtue of measuring the same absolute magnitude range in each potential cluster.
To transform -magnitudes to absolute -magnitudes, an elliptical galaxy spectrum was assumed with a rest frame color , and K-corrections were taken from Coleman, Wu, & Weedman (1980). No evolution correction was applied. Galactic extinction values were taken from Schlegel, Finkbeiner, & Davis (1998).
To determine the density of galaxies surrounding each radio source, our raw richness counts needed to be corrected for unrelated field galaxy counts; we call these “background counts.” Ideally, this would be achieved by counting background galaxies directly on the frames. However, particularly for the lowest- fields, our arcmin images will contain associated cluster or group galaxies even at the edges of the frames and the background would therefore be overestimated. The other possibility is to use published background counts of galaxies from deep surveys. We have used a combination of the two methods.
A plot of the number of galaxies and stars (per 0.1 mag per deg2) catalogued on all 33 frames for which we determined a richness value is shown in Figure 2. From this plot, it is evident that on average, our frames are complete to approximately where the star and galaxy counts both suddenly plummet. In addition the star/galaxy classification in FOCAS breaks down at for our fields. Results from the deep survey of Metcalfe et al. (1991) indicate that star counts make up approximately 10% of the total counts at and less than 2% at . As seen in Figure 2, the fraction of stars at these magnitudes determined by FOCAS for our frames is much higher; it is obvious that, at faint magnitudes ( or 22), many galaxies are being erroneously classified as stars. In order to account for this, we include objects classified as stars, and with magnitudes fainter than and down to the corresponding to , in our richness measurements.
Only the higher redshift bent doubles will be affected by this misclassification, because it is only at relatively high that corresponds to a sufficiently faint apparent magnitude that misclassified objects affect the richness statistic. The lowest object affected by this is #177 at . For the bent doubles at higher , we use background counts determined directly from the image frames and also include objects classified as stars, with magnitudes in the range to the corresponding to , in the background counts. For the lower redshift objects, where we expect the most contamination from group or cluster galaxies to the frame background counts, and where the apparent magnitude corresponding to remains relatively bright, we use background counts from Metcalfe et al. (1991). Metcalfe et al. found log(N) = , where N is the number of galaxies per deg2 per 0.5 mag. These counts agree well with several other surveys including those of Steidel & Hamilton (1993) and Lilly et al. (1991).
As a check, we determined the background counts for all fields using both methods: the Metcalfe et al. relation, and the counts in an annulus surrounding each radio source. For the lower- bent doubles (), the frame counts are higher, by a mean of (error in the mean). This is expected because of the contribution from cluster or group galaxies to the frame background counts. For the higher- () fields, the two methods agree well. The mean difference between the frame and Metcalfe et al. background counts is ; rejecting one extreme outlier gives a mean of .
Table 3 lists the results of the richness measurements. Column (1) lists the bent-double’s id number, column (2) gives the rank of the radio galaxy in its potential cluster (it is the first ranked, or BCG, in all but 8 of the 40 cases), column (3) gives the absolute V-magnitude of the radio source host galaxy, and column (4) lists , defined as the apparent R-magnitude corresponding to at the redshift of the bent double. Column (5) lists the raw counts, column (6) lists the field galaxy counts calculated from Metcalfe et al. (1991) if , or determined directly on the frame if , column (7) lists the corrected richness values (raw - background counts) along with Poisson errors, column (8) gives our estimate of the Abell richness class of the cluster based on Z97’s transformation between and Abell class, and column (9) tells of known cluster or group associations. To estimate the Abell richness class (column 8), we used the transformation , from Z97 with , and Abell’s (1958) conversion between and richness class. Using this relation, inclusion in Abell’s catalog at the lowest richness level (richness class 0) requires or (). Since we have assumed in this paper, we transform our richness statistic to the value it would have with before estimating the Abell class. For the sampling radius in which galaxies are counted increases relative to that calculated for . This combined with a decline in the number of galaxies from the center of a cluster that goes as (Allington-Smith et al. 1993), means that with is higher than with by 8%, 6%, 4%, and 2% for and 0.1, respectively.
We did not make a richness measurement for object #082 because the image was not large enough to include a 0.5 Mpc radius around the radio source (this source is at very low-). In any event, this source has been studied previously, and is known to be associated with a poor group (Stocke & Burns 1987). In addition, we did not make our own richness measurements for objects #236 and 237, since they reside in the Coma cluster and sufficient data exist for them. We did not calculate richness values in the fields surrounding the three quasars as our images were not deep enough to measure galaxies at the redshifts of the quasars.
Four of our fields for which we measured the richness class contain the clusters Abell 824, 876, 1258, and 1587. A comparison of the richness class given by Abell (1958, 1989) shows that our quantitative estimates agree with Abell’s to within Abell class: for two of the clusters, our classification agrees, for another, our estimate is one class higher than Abell’s, and the remaining one falls just short of our cluster cutoff – we would classify it as a rich group.
Converting our richness measurements, using for a direct comparison to Z97’s results, we found a mean ( with ) for all of the sources in our complete sample. Evaluating FR I and II objects separately (excluding those classified as FR I/II, and approximating for object #082 and for object #236), we find a mean ( with ) for the 26 FR I sources and ( with ) for the six non-quasar FR II sources. Z97 found a mean value of for all sources in her sample, with for FR I’s and for FR II’s.
We find no significant difference in the richness values for the environments surrounding the FR I and FR II sources in our sample. However, the number of FR II sources in our sample is very small (six). The mean richness value for our sample of mostly FR I sources is higher than the mean richness value of the Z97 sample, which contains mostly FR II sources, by a factor of approximately two. When we compare the mean richnesses of the environments surrounding the FR I’s in our sample and Z97’s sample, however, we find no significant difference. Specific morphologies (i.e., bent or collinear) were not noted in Z97. However, since the FR I sources in the Z97 sample have powers near or above the FR I/II break, it is likely that many of them are WATs. In fact, the mean power for the FR I’s in the Z97 sample, converting to 1440 MHz assuming with , is an order of magnitude higher than the mean power of the FR I’s in our sample: mean W Hz-1 with a range of W Hz-1 to W Hz-1 (Z97) vs. mean W Hz-1 with a range of W Hz-1 to W Hz-1 (our sample). It is unclear if there is any difference in the gas content of the source environments in the two samples – in particular, whether our sample, which was specifically chosen by radio morphology, contains sources that reside in environments that harbor denser gas more often than powerful FR I environments in general. X-ray observations are necessary to decide this.
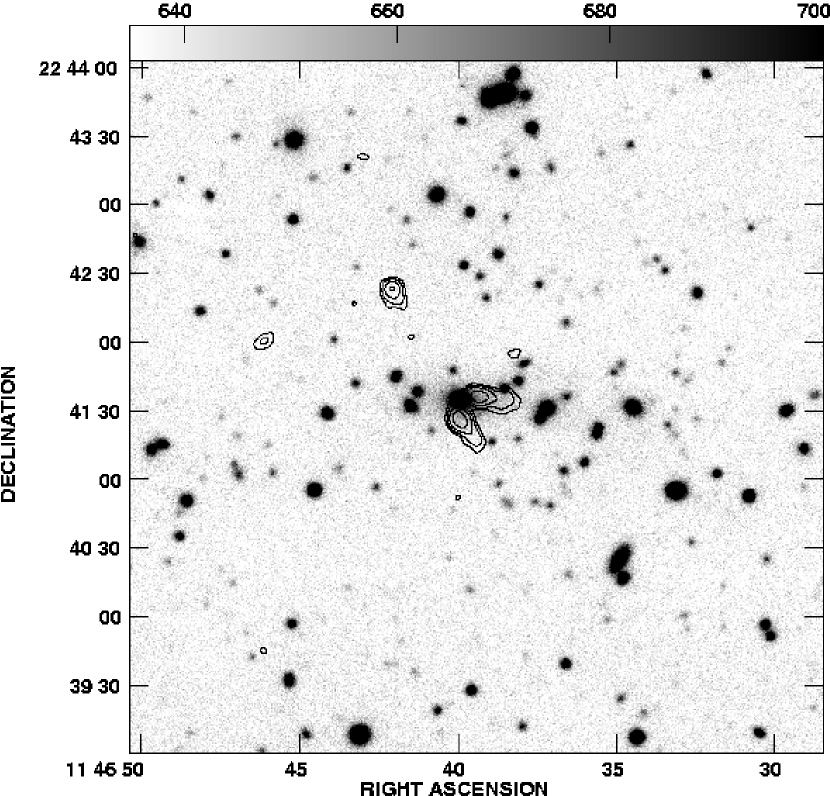
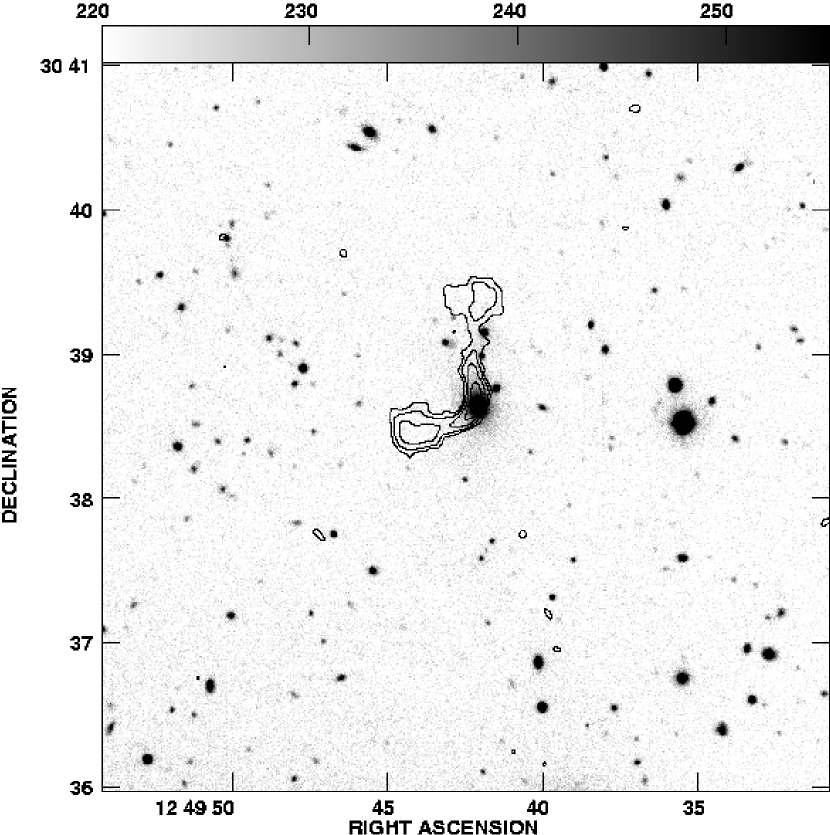
There is an approximately fifty-fifty chance of finding a cluster when optically following up on a bent-double radio source. From our richness values, we find that 54% of the bent doubles in the complete sample are found in clusters of Abell richness class 0 or greater. Figure 3a shows an example of a bent double in a rich environment. In addition, 46% of the objects are found in groups or the field, suggesting either that dense gas can be found in groups, some of them rather poor, or that there are alternative bending mechanisms distorting the radio lobes. An example of a source found in a poor environment is displayed in Figure 3b.
Venkatesan et al. (1994) claim that narrow-angle-tail (NAT) sources may be found in poor environments because it is the local galaxy environment, rather than the global cluster environment, that produces the dominant effect on the radio morphology. In their model, a poor cluster ICM combined with high-velocity, infalling galaxies can bend radio lobes. Such high velocities would be possible in poor clusters in the early stages of collapse. Burns et al. (1994) found clumped X-ray emission around radio sources in Abell clusters. While some of the X-rays may come from the AGN powering the extended radio source, the emission is often extended. Their study concludes that local clumped gas may bend radio lobes, and that this gas is a signature of a recent cluster-cluster (or group) merger. Wide-angle-tail (WAT) radio sources, then, may be pointers to clusters in formation, or those that have recently undergone mergers. This is consistent with the observation that WAT clusters generally do not have cooling flows, which are found in relaxed clusters.
Another theory, put forth by Stocke & Burns (1987) is that the low dynamical pressure resulting from gas associated with a group of galaxies allows radio jets to expand more quickly. This, in turn, lowers the density and pressure of the jets, allowing them to be bent more easily.
In X-ray surveys, a new class of objects called “fossil groups” has recently been discovered (Ponman et al. 1994; Vikhlinin et al. 1999; Romer et al. 2000). These objects display extended emission in the X-ray, and their optical counterparts are single, large, bright elliptical galaxies that appear to reside in poor environments. They may represent groups of galaxies that have been “cannibalized” by the bright elliptical, leaving behind only the extended X-ray gas. The dense gas associated with these systems may represent a significant mass component to the Universe that would be missed by optical surveys.
6 The Distributions of Source Properties and their Environments
We discuss here the statistical properties of the complete sample; in all that follows, we exclude the three quasars (all high-power FR II objects) from further consideration.
All but eight of the 37 host galaxies are brightest cluster/group galaxies. Furthermore, the scatter in host absolute magnitude is small, with all but eight of the objects lying within mag of the median value of M (see Figure 4). Indeed, the apparent magnitude distribution (Figure 5) is very similar to a plot of R-mag vs. for the no-evolution model of an elliptical galaxy (Coleman, Wu, & Weedman 1980). This is consistent with the results of Ledlow & Owen (1995b) who found that the host elliptical galaxies of FR I radio sources are indistinguishable from elliptical galaxies with no radio emission. They conclude that, given the lifetimes of radio sources ( yrs), all elliptical galaxies may at some point contain powerful radio sources.
The distribution of radio power, plotted as a function of redshift, is displayed in Figure 6. Most of the sources lie below the canonical FRI/FRII dividing line and three-quarters of the objects lie at least a factor of two below this boundary. Apart from the expected lack of rare, high-power sources in the small local volume and the lower envelope produced by the survey’s radio flux density threshold, no trends with are apparent. There is no correlation between radio power and host galaxy magnitude, with radio power ranging over two orders of magnitude for a given optical luminosity. This is also consistent with the findings of Ledlow & Owen (1995a; 1996).
There is also no correlation seen between the redshift of the radio source and the richness of its associated cluster (Figure 7). Out to , the cluster environments are just as rich as they are at present day. This is consistent with the results of H&L91 for their subsample of FR I objects. Cluster richness is also found to be uncorrelated with the linear sizes and opening angles of the radio sources. While richer environments might be expected to provide greater confining pressures and bending forces, the complications introduced by host locations with respect to the cluster center and galaxy velocities obscure any underlying trends. Finally radio power and richness are uncorrelated (Figure 8). This is consistent with the survey of Ledlow & Owen (1995a) which found no correlation between the total radio power of all galaxies in a cluster and the cluster richness. Most of our sources occur alone in their clusters at the sensitivity of FIRST, and if there are other radio sources in the clusters, the bent-double is almost always the dominant source of radio power for the cluster.
7 Correlation with the ROSAT All Sky Survey
Correlation of the complete sample of bent doubles with the ROSAT All Sky Survey (RASS) Bright and Faint Source catalogs reveals that eight of the radio sources lie within one megaparsec of the position of an X-ray source. In addition to these eight, the two radio sources in Coma also match with detections in the survey. Matched source #249 is a quasar at , and the X-ray source matched with the bent-double #082 is probably unrelated to the radio source. This X-ray source is point-like and there is a 17th magnitude stellar object located away as well as a 10th magnitude star located away. The X-ray source is likely associated with one of these objects. The eight objects (excluding Coma) are listed in Table 4. Column (1) lists the bent-double id #, column (2) gives the redshift, column (3) shows the match distance between the radio and X-ray source in arcminutes, column (4) gives the RASS id name, column (5) lists the RASS count rate, column (6) gives the source extent as listed in the RASS catalog, where a value of zero indicates that a source is point-like (however, see comments below), column (7) gives two estimates for unabsorbed X-ray flux, using a thermal bremsstrahlung model, Galactic and temperatures of 3 keV and 1 keV (except for bent-doubles #249 and #082 where no estimates are given) , column (8) converts the fluxes in the previous column to luminosities, and column (9) gives the optical richnesses for the fields.
When total source counts are low, as is the case for most of our sources, the RASS measurement of extent is subject to error. Therefore, for each of the sources catalogued as point-like, we visually examined the RASS images after smoothing them with a Gaussian. This inspection confirmed that the X-ray sources associated with objects #249 and #082 are point-like, while revealing that the source associated with #261 could be either point-like or extended, and the X-ray sources associated with #186 and #228 are clearly extended.
Excluding the quasar and the unassociated object, based on our richness measurements, five of the six X-ray-detected sources are classified as being members of clusters. The remaining one is listed in Abell’s catalog as a richness class 1 cluster, but falls just short of our cluster criteria. One of the other matched objects is also a member of an Abell cluster, and one is found in a Zwicky cluster. The sources have typical estimated X-ray luminosities of a few times erg s-1. A plot of redshift vs. X-ray luminosity is given in Figure 9. The long-dashed lines mark = 1043, 1044, and 1045 erg s-1. The curved lines are the approximate limits of the RASS catalog with the upper line (long-short dash) for a 3 keV model and the lower (short dash) for a 1 keV model. These were generated by taking the Faint RASS requirement that a source have 6 counts to be in the catalog, combined with the average exposure for the matching objects of 400 sec, to get a limiting count rate of 0.015 ct/s, and converting to flux with PIMMS.
Above the curves, the solid circles represent the matched sources’ luminosities expected for a 3 keV thermal bremsstrahlung model, using Galactic , and distances with and km s-1 Mpc-1. The open circles are the same but for a 1 keV model. The matched object at is slightly below the limit, but was detected because the exposure for that pointing was slightly longer (418 s) than average and it had only six counts. At , the bent doubles that were not detected in the RASS, but are found in clusters, based on our richness measurements, are plotted as filled triangles. Those that are classified as not belonging to clusters and are not detected in the RASS, are plotted as asterisks.
Not including Coma, for , there are six bent doubles that are members of clusters (based on our richness measurements) and four of these are detected in the RASS. We classify nine bent doubles at as non-cluster members, and only one of these is detected – the one that is a member of an Abell cluster and fell just shy of our limit for being called a cluster. The majority of the low redshift bent doubles that are found in clusters are detected in the RASS, and those that are not found in clusters are not detected in the RASS. This result supports our richness measurements, and suggests that the X-ray flux is probably from cluster, rather than AGN, emission.
8 Conclusions
We have presented observations of a complete, magnitude-limited sample of 40 objects taken from our larger sample of bent-double radio sources. Our richness measurements indicate that they can be used as tracers of high-density environments – 54% are associated with Abell class 0 or richer clusters. The majority of our sample’s lowest redshift objects () that we classified as cluster members are detected in the ROSAT All Sky Survey. Interestingly, 46% of the sample bent doubles are associated with groups, some of them poor. The lobes in these environments may be bent by clumped gas in the vicinity of the radio source. The galaxies may have high velocities relative to this gas if they are parts of groups or clusters in formation. X-ray observations would shed light on this scenario.
Some of the sources in the complete sample exist in previously recognized clusters: six in Abell (1958, 1989) clusters, including two in Coma, and four in Zwicky (1968) clusters. Within the area of the complete sample, there are a total of 102 clusters in the Abell catalog, so our sources “discovered” of them, suggesting, to the extent the Abell catalog is complete, that of clusters house bent-double sources.
Almost all of the radio sources in the complete sample are associated with the first-ranked galaxy in their cluster or group, consistent with results from other WAT samples. In addition, their large linear sizes (approximately 100 – 500 kpc) and powers near the FR I/II break are typical of WAT sources (O’Donoghue et al. 1993).
Few of the radio and optical properties were found to be correlated. In particular, no correlations are seen between richness of the host environment and the linear extent or bending angle of the radio lobes. The complicated interactions between cluster gas, central engine, and extended lobes, as well as the position of the host galaxy in the cluster and its velocity relative to the ICM, make it unsurprising that there is not a one-to-one relationship between either richness and linear size or richness and bending angle.
Before making the magnitude cut, there were 99 bent doubles in the area of the complete sample, implying that more than half of the radio sources have host magnitudes fainter than . Given the narrow distribution in host optical luminosities (Figure 4), these sources must have redshifts greater than or 0.5, and can be used to identify such distant clusters with an efficiency of at least 50 (cf. Blanton et al. 2000).
Several of the objects in our sample are in notably low density environments, and may be associated with fossil groups or single galaxies. These types of systems may represent a significant mass component of the Universe that would be missed by optical surveys. X-ray observations are planned to study these objects to determine if there is indeed extended gas associated with them, or if we must find another explanation for the bending of the radio lobes.
This material is based upon work supported by the National Science Foundation under Grants AST-98-02732 and 99-70884. In addition, support for this work was provided by the National Aeronautics and Space Administration through Award Numbers GO0-1019X, GO0-1141X, and GO0-1173X, issued by the X-ray Observatory Center, which is operated by the Smithsonian Astrophysical Observatory for and on behalf of NASA under contract NAS8-39073. Some support was provided by LTSA NAG5-6548. Part of the work reported here was done at the Institute of Geophysics and Planetary Physics, under the auspices of the U.S. Department of Energy by Lawrence Livermore National Laboratory under contract No. W-7405-Eng-48. The FIRST survey has also been supported by grants from the National Geographic Society, IGPP, and Columbia University.
References
- (1)
- (2) Abell, G. O. 1958, ApJS, 3, 211
- (3)
- (4) Abell, G. O., Corwin, H. G., Jr., & Olowin, R. P. 1989, ApJS, 70, 1
- (5)
- (6) Allington-Smith, J. R., Ellis, R. S., Zirbel, E. L., & Oemler, A. 1993, ApJ,404, 521
- (7)
- (8) Becker, R. H., White, R. L., & Helfand, D. J. 1995, ApJ, 450, 559
- (9)
- (10) Blanton, E. L., Gregg, M. D., Helfand, D. J., Becker, R. H., & White, R. L. 2000, ApJ, 531, 118
- (11)
- (12) Burns, J. O., Rhee, G., Roettiger, K., & Owen, F. 1993, in Observational Cosmology, eds. G. Chincarini, A. Iovino, T. Maccacaro, & D. Maccagni (ASP Conf. Ser., 51), 407
- (13)
- (14) Burns, J. O., Rhee, G., Owen, F. N., & Pinkney, J. 1994, ApJ, 423, 94
- (15)
- (16) Burns, J. O., Gómez, P., Pinkney, J. Roettiger, K., & Loken, C. 1996, in Clusters, Lensing, and the Future of the Universe, eds. V. Trimble & A. Reisenegger (ASP Conf. Ser., 88), 184
- (17)
- (18) Coleman, G. D., Wu, C.-C., & Weedman, D. W. 1980, ApJS, 43, 393
- (19)
- (20) Colina, L. & Perez-Fournon 1990, ApJS, 72, 41
- (21)
- (22) Condon, J. J., Cotton, W. D., Greisen, E. W., Yin, Q. F., Perley, R. A., Taylor, G. B., & Broderick, J. J. 1998, AJ, 115, 1693
- (23)
- (24) Deltorn, J.-M., Le Fèvre, O., Crampton, D., & Dickinson, M. 1997, 483 L21
- (25)
- (26) Dickinson, M. 1997, in The Early Universe with the VLT, ed. J. Bergeron, Berlin:Springer, 274
- (27)
- (28) Fanaroff, B. L., & Riley, J. M. 1974, MNRAS, 167, 31L
- (29)
- (30) Gómez, P. L., Pinkney, J., Burns, J. O., Wang, Q., Owen, F. N., Vo ges, W. 1997, ApJ, 474, 580
- (31)
- (32) Hill, G. J., & Lilly, S. J. 1991, ApJ, 367, 1
- (33)
- (34) Landolt, A. U. 1992, AJ, 104, 340
- (35)
- (36) Ledlow, M. J. & Owen, F. N. 1995a, AJ, 109, 853
- (37)
- (38) Ledlow, M. J. & Owen, F. N. 1995b, AJ, 110, 1959
- (39)
- (40) Ledlow, M. J. & Owen, F. N. 1996, AJ, 112, 9
- (41)
- (42) Ledlow, M. J., Owen, F. N., & Eilek, J. A. 2000, astro-ph/9908336
- (43)
- (44) Lilly, S. J., Cowie, L. L., & Gardner, J. P., ApJ, 369, 79
- (45)
- (46) Metcalfe, N., Shanks, T., Fong, R., & Jones, L. R. 1991, MNRAS, 2 49, 498
- (47)
- (48) O’Donoghue, A. A., Eilek, J. A., & Owen, F. N. 1993, ApJ, 408, 428
- (49)
- (50) Owen, F. N., & Rudnick, L. 1976, ApJ, 205, L1
- (51)
- (52) Owen, F. N. & White, R. A. 1991, MNRAS, 249, 164
- (53)
- (54) Ponman, T. J et al. 1994, Nature, 369, 462
- (55)
- (56) Postman, M. & Lauer, T R. 1995, ApJ, 440, 28
- (57)
- (58) Rector, T. A., Stocke, J. T., Ellingson, E. 1995, AJ, 110, 1492
- (59)
- (60) Roettiger, K., Burns, J. O., & Loken, C. 1996, ApJ, 473, 651
- (61)
- (62) Romer, A. K. et al. 2000, ApJS, 126, 209
- (63)
- (64) Schlegel, D. J., Finkbeiner, D. P., & Davis, M. 1998, 500, 525
- (65)
- (66) Steidel, C. C. & Hamilton, D. 1993, AJ, 105, 2017
- (67)
- (68) Stocke, J. T. & Burns, J. O. 1987, ApJ, 319, 671
- (69)
- (70) Stocke, J. T., Perlman, E. S., Gioia, I. M., & Harvanek, M. 1999, AJ, 117, 1967
- (71)
- (72) Tonry, J. & Davis, M. 1979, AJ, 84, 10
- (73)
- (74) Valdes, F. 1983, Faint Object Classification and Analysis System , Central Computer Services, National Optical Astronomy Observatories, P.O. Box 26732, Tucson, AZ 85725
- (75)
- (76) Vikhlinin, A. et al. 1999, ApJ, 520, L1
- (77)
- (78) Zirbel, E. L. 1997, ApJ, 476, 489
- (79)
- (80) Zwicky, F., Herzog, E., Wild, P., Karpowicz, M., & Kowal, C. T. 1968, Catalogue of Galaxies and Clusters of Galaxies, (California Institute of Technology, Pasadena)
- (81)
| Images | Spectra | |||
|---|---|---|---|---|
| id # | UT | Exp. (s) | UT | Exp. (s) |
| 082 | 02/13/99 | 3480 | ||
| 087 | 02/24/98 | 3300 | 02/23/98 | 1200 |
| 092 | 02/04/00 | 1900 | 02/23/98 | 3600 |
| 099 | 02/04/00 | 1900 | 06/02/97 | 1500 |
| 105 | 02/04/00 | 1900 | 02/16/98 | 600 |
| 115 | 02/12/99 | 3480 | 02/11/99 | 1800 |
| 116 | 02/24/98 | 3300 | 02/23/98 | 900 |
| 119 | 02/13/99 | 3480 | 02/10/99 | 1800 |
| 124 | 02/14/99 | 3480 | 02/11/99 | 1800 |
| 127 | 02/13/99 | 3480 | 02/10/99 | 1800 |
| 135 | 02/04/00 | 1900 | 02/23/98 | 1200 |
| 147 | 02/04/00 | 1900 | 02/23/98 | 1800 |
| 150 | 02/14/99 | 3480 | 02/10/99 | 1800 |
| 153 | 02/24/98 | 1300 | 06/02/97 | 900 |
| 158 | 02/24/98 | 1300 | 02/23/98 | 1200 |
| 161 | 02/14/99 | 3480 | 02/10/99 | 1800 |
| 167 | 02/13/99 | 3480 | 12/21/98 | 1200 |
| 176 | 02/13/99 | 3480 | 12/21/98 | 1200 |
| 177 | 02/04/00 | 1900 | 05/25/95 | 900 |
| 186 | 02/12/99 | 3480 | 12/22/98 | 1200 |
| 189 | 02/14/99 | 3480 | 02/11/99 | 1200 |
| 195 | 02/04/00 | 1900 | 02/23/98 | 900 |
| 196 | 02/14/99 | 3480 | 02/10/99 | 1800 |
| 198 | 02/13/99 | 3480 | 12/22/98 | 1200 |
| 199 | 02/15/99 | 3480 | 02/10/99 | 1800 |
| 200 | 02/12/99 | 3480 | 02/09/99 | 1200 |
| 204 | 02/12/99 | 3480 | 02/09/99 | 1200 |
| 205 | 02/13/99 | 3480 | 02/09/99 | 1200 |
| 213 | 02/04/00 | 1900 | 02/23/98 | 1800 |
| 214 | 01/01/96 | 3090 | 12/16/96 | 1320 |
| 216 | 02/04/00 | 1900 | 02/23/98 | 1200 |
| 217 | 02/15/99 | 3480 | 02/11/99 | 1800 |
| 228 | 02/04/00 | 1900 | 02/23/98 | 1500 |
| 232 | 02/04/00 | 1900 | 02/23/98 | 1200 |
| 234 | 02/04/00 | 1900 | 02/23/98 | 1200 |
| 236 | ||||
| 237 | ||||
| 249 | 02/04/00 | 1900 | 02/10/99 | 1200 |
| 261 | 02/12/99 | 3480 | 02/09/99 | 1800 |
Note. — The observations were taken at the MDM 2.4m telescope with the Echelle CCD and the R-band filter and the Mk III spectrograph with a few exceptions. The spectra for objects 99 and 153 were taken at the Lick Observatory 3m telescope. The spectral observation of #177 was done at the KPNO 4m telescope. Object #214 was imaged at the KPNO 4m telescope, and a spectrum was taken at the Keck II Observatory (Blanton et al. 2000). Spectra for objects 167, 176, 186, and 198 were contributed by Jules Halpern. Where no data is presented (objects #236 and 237 in the Coma cluster and #82), observations were taken from the literature.
| id # | RA(J2000) | Dec(J2000) | mR | Redshift | FluxaaNVSS total flux density. bRatio of NVSS to FIRST flux density. cColina & Perez-Fournon (1990). dPostman & Lauer (1995) | (N/F)bbSource extent, as listed in the RASS catalog, where a value of zero indicates a point source. However, visual examination of the RASS images associated with sources with a catalogued value of zero confirms that the X-ray sources matching with #249 and #082 are point sources, the source associated with #261 could be point-like or extended, and the sources associated with #186 and #228 are clearly extended. | P1440 | Angle | Size | Size | FR | Comments |
|---|---|---|---|---|---|---|---|---|---|---|---|---|
| mJy | deg. | arcsec | kpc | |||||||||
| 082 | 08 03 16.5 | 40 35 | 14.50 | 0.045 | 140.2 | 3.1 | 0.12 | 112 | 85 | 102 | I | CGCG 118-054 |
| 087 | 08 06 11.2 | 31 38 | 16.75 | 0.172 | 85.7 | 1.0 | 1.14 | 89 | 56 | 212 | I | |
| 092 | 08 14 46.0 | 15 48 | 17.74 | 0.280 | 28.1 | 1.2 | 1.02 | 145 | 37 | 195 | I | |
| 099 | 08 18 10.6 | 32 11 | 17.88 | 0.246 | 52.8 | 1.5 | 1.46 | 24 | 80 | 389 | I | |
| 105 | 08 28 39.4 | 36 55 | 15.57 | 0.087 | 350.9 | 1.4 | 1.17 | 84 | 81 | 177 | I | Zw 0825+2447, 4C +24.17 |
| 115 | 08 39 51.6 | 28 18 | 18.50 | 1.137 | 139.8 | 1.2 | 94.31 | 155 | 66 | 568 | II | quasar |
| 116 | 08 44 33.4 | 06 15 | 15.63 | 0.109 | 136.2 | 1.4 | 0.71 | 143 | 62 | 163 | I | |
| 119 | 08 45 59.4 | 31 09 | 18.86 | 0.373 | 26.6 | 1.2 | 1.74 | 102 | 58 | 360 | I | |
| 124 | 08 50 40.5 | 09 07 | 18.51 | 0.433 | 34.4 | 1.1 | 3.06 | 102 | 33 | 220 | II | |
| 127 | 08 53 31.9 | 24 00 | 17.74 | 0.306 | 43.3 | 1.2 | 1.88 | 146 | 56 | 312 | I | |
| 135 | 09 06 52.1 | 55 49 | 16.65 | 0.156 | 40.7 | 1.3 | 0.45 | 92 | 45 | 159 | I | Zw 0903+2907 |
| 147 | 09 35 24.9 | 55 03 | 17.82 | 0.264 | 165.8 | 1.2 | 5.30 | 36 | 91 | 462 | I | Abell 0824 |
| 150 | 09 42 09.5 | 57 17 | 17.88 | 0.297 | 26.5 | 1.2 | 1.09 | 123 | 45 | 246 | I/II | |
| 152 | 09 46 55.4 | 23 23 | 18.45 | 0.337 | 36.9 | 1.0 | 1.95 | 156 | 30 | 176 | II | uncertain z |
| 153 | 09 50 04.6 | 17 27 | 17.77 | 0.251 | 45.1 | 1.4 | 1.31 | 111 | 38 | 187 | I | Abell 0876 |
| 158 | 10 06 23.6 | 05 26 | 15.57 | 0.075 | 69.1 | 1.5 | 0.17 | 91 | 18 | 35 | I | |
| 161 | 10 16 02.4 | 00 07 | 17.64 | 0.309 | 32.4 | 1.0 | 1.44 | 105 | 60 | 336 | I | |
| 167 | 10 29 44.9 | 23 11 | 17.07 | 0.237 | 230.5 | 5.91 | 50 | 99 | 469 | I | ||
| 176 | 10 45 16.2 | 51 40 | 15.88 | 0.140 | 34.1 | 1.3 | 0.30 | 103 | 49 | 158 | I | |
| 177 | 10 50 10.9 | 39 55 | 18.00 | 0.256 | 146.2 | 1.0 | 4.40 | 127 | 39 | 197 | II | Zw 1047+3055 |
| 186 | 11 08 12.3 | 10 35 | 16.36 | 0.175 | 116.0 | 1.3 | 1.60 | 128 | 68 | 261 | I | |
| 189 | 11 12 20.7 | 01 13 | 18.26 | 0.728 | 55.0 | 1.3 | 14.51 | 138 | 44 | 354 | I/II | quasar |
| 195 | 11 20 38.5 | 12 34 | 17.12 | 0.240 | 86.9 | 1.5 | 2.28 | 126 | 120 | 573 | I | |
| 196 | 11 20 48.0 | 42 03 | 17.55 | 0.241 | 15.1 | 2.4 | 0.40 | 135 | 52 | 249 | I | |
| 198 | 11 25 59.8 | 28 37 | 16.11 | 0.116 | 46.8 | 1.2 | 0.28 | 85 | 46 | 128 | II | Abell 1258 |
| 199 | 11 26 31.4 | 38 04 | 18.12 | 0.341 | 89.6 | 1.2 | 4.89 | 22 | 30 | 178 | I/II | |
| 200 | 11 30 48.8 | 24 35 | 16.06 | 0.145 | 91.5 | 1.2 | 0.86 | 74 | 93 | 309 | II | |
| 204 | 11 46 39.9 | 41 35 | 17.11 | 0.177 | 34.4 | 0.49 | 69 | 49 | 190 | I | ||
| 205 | 11 48 33.1 | 32 26 | 16.87 | 0.176 | 34.7 | 1.3 | 0.49 | 124 | 38 | 147 | I | |
| 213 | 12 09 38.4 | 20 38 | 17.38 | 0.240 | 35.3 | 1.1 | 0.93 | 83 | 33 | 158 | I | Zw 1207+2439 |
| 214 | 12 09 50.1 | 48 07 | 18.90 | 0.336 | 15.0 | 1.2 | 0.79 | 91 | 30 | 176 | I | |
| 216 | 12 12 58.0 | 09 26 | 18.04 | 0.397 | 68.2 | 1.2 | 5.09 | 138 | 44 | 282 | II | |
| 217 | 12 16 27.4 | 28 44 | 18.55 | 0.429 | 38.8 | 1.4 | 3.40 | 165 | 72 | 479 | I/II | |
| 228 | 12 41 08.7 | 34 47 | 16.52 | 0.199 | 177.6 | 1.2 | 3.18 | 126 | 57 | 240 | I | Abell 1587 |
| 232 | 12 46 51.9 | 05 21 | 16.24 | 0.140 | 125.1 | 1.0 | 1.09 | 53 | 63 | 203 | I | |
| 234 | 12 49 42.2 | 38 38 | 16.72 | 0.194 | 94.7 | 1.4 | 1.61 | 104 | 89 | 367 | I | |
| 236 | 12 59 23.3 | 54 44 | 14.00ccUnabsorbed X-ray flux in units of 10-13 erg cm-2 s-1, in the keV band, assuming a thermal bremsstrahlung model, Galactic , and kT = 3 keV / 1 keV. | 0.023 | 249.3 | 1.5 | 0.06 | 135 | 89 | 56 | I | Abell 1656 (Coma), NGC4869 |
| 237 | 12 59 35.6 | 57 35 | 12.28ddX-ray luminosity in units of 1043 erg s-1, in the keV band, using the flux from the previous column and assuming km s-1 Mpc-1 and . | 0.023 | 206.7 | 1.1 | 0.05 | 93 | 39 | 25 | I/II | Abell 1656 (Coma), NGC4874 |
| 249 | 13 29 03.2 | 31 10 | 17.73 | 0.987 | 89.3 | 1.3 | 44.72 | 102 | 36 | 306 | II | quasar, RGB J1329+255A |
| 261 | 13 51 03.4 | 54 05 | 16.77 | 0.247 | 123.0 | 1.1 | 3.44 | 176 | 44 | 214 | I/II | Zw 1348+3109 |
| id | Rank | MV | N | Bgnd | N | Abell est. | Notes | |
|---|---|---|---|---|---|---|---|---|
| (1) | (2) | (3) | (4) | (5) | (6) | (7) | (8) | (9) |
| 082 | 1 | -21.92 | poor group11Stocke & Burns (1987) | |||||
| 087 | 1 | -22.78 | 20.53 | 22 | 13.9 | |||
| 092 | 1 | -23.04 | 21.78 | 33 | 18 | 0 | ||
| 099 | 1 | -22.60 | 21.48 | 30 | 19.1 | |||
| 105 | 1 | -22.37 | 18.94 | 25 | 10.6 | Zw 0825+2447 | ||
| 116 | 1 | -22.85 | 19.48 | 22 | 11.6 | |||
| 119 | 1 | -22.68 | 22.54 | 42 | 24 | 0 | ||
| 124 | 1 | -23.57 | 23.08 | 67 | 29 | 1 | ||
| 127 | 1 | -23.28 | 22.02 | 22 | 28 | |||
| 135 | 1 | -22.66 | 20.31 | 29 | 13.2 | 0 | Zw 0903+2907 | |
| 147 | 1 | -22.80 | 21.62 | 58 | 17 | 1 | Abell 0824, Rich 0 | |
| 150 | 4 | -23.01 | 21.89 | 44 | 26 | 0 | ||
| 152 | 1 | -22.76 | 22.21 | 33 | 30 | |||
| 153 | 2 | -22.68 | 21.45 | 47 | 18.1 | 1 | Abell 0876, Rich 1 | |
| 158 | 1 | -22.05 | 18.62 | 16 | 10.3 | |||
| 161 | 1 | -23.38 | 22.02 | 38 | 19 | 0 | ||
| 167 | 2 | -23.25 | 21.32 | 33 | 17.4 | 0 | ||
| 176 | 1 | -23.16 | 20.04 | 25 | 12.5 | |||
| 177 | 2 | -22.53 | 21.53 | 54 | 28 | 0 | Zw 1047+3055 | |
| 186 | 1 | -23.20 | 20.56 | 29 | 13.8 | 0 | ||
| 195 | 3 | -23.22 | 21.35 | 25 | 17.5 | |||
| 196 | 1 | -22.79 | 21.34 | 22 | 17.3 | |||
| 198 | 2 | -22.45 | 19.56 | 25 | 11.1 | Abell 1258, Rich 1 | ||
| 199 | 1 | -23.15 | 22.27 | 31 | 24 | |||
| 200 | 1 | -23.02 | 20.08 | 22 | 12.2 | |||
| 204 | 1 | -22.46 | 20.57 | 29 | 13.7 | 0 | ||
| 205 | 1 | -22.69 | 20.56 | 44 | 13.7 | 1 | ||
| 213 | 1 | -23.00 | 21.38 | 51 | 18.0 | 1 | Zw 1207+2439 | |
| 214 | 1 | -22.24 | 22.14 | 28 | 14 | |||
| 216 | 1 | -23.69 | 22.73 | 23 | 31 | |||
| 217 | 1 | -23.41 | 22.96 | 34 | 13 | 0 | ||
| 228 | 1 | -23.29 | 20.81 | 40 | 14.3 | 0 | Abell 1587, Rich 0 | |
| 232 | 1 | -22.74 | 19.98 | 31 | 11.9 | 0 | ||
| 234 | 1 | -23.08 | 20.80 | 15 | 14.7 | |||
| 236 | -20.85 | Abell 1656, Rich 2 | ||||||
| 237 | 2 | -22.57 | Abell 1656, Rich 2 | |||||
| 261 | 1 | -23.64 | 21.41 | 41 | 17.8 | 0 |
Note. — Column (1) lists the bent double i.d. numbers, column (2) shows the rank of the galaxy’s optical magnitude within its group or cluster, column (3) lists the absolute V-magnitude of the radio source host galaxy, column (4) gives the apparent R-magnitude corresponding to at the redshift of the radio source, column (5) lists the number of galaxies within a radius of 0.5 Mpc from the radio galaxy, and with magnitudes brighter than M, column (6) lists the field galaxy counts taken directly from the frame for those bent doubles that have or from Metcalfe et al. (1991) for those that have , column (7) gives the richness value (raw counts - background (field) counts) along with the Poisson error, column (8) lists our estimate of the Abell richness class based on the N0.5 counts, and column (9) lists known cluster associations.
| id # | z | daaMatch distance, in arcminutes, between the radio source and RASS source | RASS id | Ct. Rate | ExtentbbSource extent, as listed in the RASS catalog, where a value of zero indicates a point source. However, visual examination of the RASS images associated with sources with a catalogued value of zero confirms that the X-ray sources matching with #249 and #082 are point sources, the source associated with #261 could be point-like or extended, and the sources associated with #186 and #228 are clearly extended. | ccUnabsorbed X-ray flux in units of 10-13 erg cm-2 s-1, in the keV band, assuming a thermal bremsstrahlung model, Galactic , and kT = 3 keV / 1 keV. | ddX-ray luminosity in units of 1043 erg s-1, in the keV band, using the flux from the previous column and assuming km s-1 Mpc-1 and . | NeeRichness value. A = Abell cluster, Zw = Zwicky cluster. |
|---|---|---|---|---|---|---|---|---|
| () | (ct/s) | (arcsec) | () | () | ||||
| 249 | 0.987 | 0.18 | 1RXS J132903.8+253103 | 0.04559 | 0 | quasar | ||
| 205 | 0.176 | 0.49 | 1RXS J114834.8+233208 | 0.02600 | 23 | 4.03/3.66 | 4.23/3.84 | 30.3 |
| 261 | 0.247 | 0.55 | 1RXS J135103.8+305332 | 0.01449 | 0 | 1.87/1.64 | 3.53/3.09 | 23.2 Zw |
| 186 | 0.175 | 0.66 | 1RXS J110811.8+260956 | 0.03642 | 0 | 5.03/4.46 | 5.21/4.62 | 15.2 |
| 198 | 0.116 | 0.90 | 1RXS J112602.8+252801 | 0.02426 | 32 | 3.29/2.91 | 1.62/1.43 | 13.9 A |
| 232 | 0.140 | 1.94 | 1RXS J124659.1+300411 | 0.01793 | 11 | 2.32/2.03 | 1.60/1.40 | 19.1 |
| 228 | 0.199 | 1.29 | 1RXS J124104.2+273535 | 0.07328 | 0 | 8.39/7.16 | 6.48/5.53 | 25.7 A |
| 082 | 0.045 | 5.42 | 1RXS J080307.8+243532 | 0.03276 | 0 | poor group | ||