Zooming in on the Coma cluster with Chandra: compressed warm gas in the brightest cluster galaxies
Abstract
The Chandra image of the central region of the Coma cluster reveals that both its dominant galaxies, NGC 4874 and NGC 4889, retain the central parts of their X-ray gas coronae. The interstellar gas with a temperature of 1–2 keV is confined by the hot intergalactic medium of the Coma cluster into compact clouds (only 3 kpc in radius) containing of gas. The physical state of the gas in these clouds appears to be determined by a delicate balance between radiative cooling and suppressed (by a factor of 30–100) heat conduction through the interface between these clouds and the hot cluster gas.
Submitted to ApJ Letters, February 27 2001
1 Introduction
ROSAT observations showed that the Coma cluster, once thought to be an archetype of a relaxed system, contains substructures on a wide range of linear scales (Briel, Henry & Böhringer 1992, White, Briel & Henry 1993, Vikhlinin, Forman & Jones 1997). The detected structures include 100 kpc-scale X-ray enhancements around the two dominant cluster galaxies, NGC 4874 and NGC 4889 (Vikhlinin, Forman, & Jones 1994). Recent XMM observations confirmed these findings and also revealed unresolved X-ray sources coincident with these galaxies (Arnaud et al. 2001, Briel et al. 2001). In this Letter, we resolve these sources with Chandra. Both sources are extended arcsec-scale ( kpc) remnants of galactic X-ray coronae with temperatures 1–2 keV, compressed by the hot, 9 keV, gas of the Coma cluster. Their very existence poses interesting physical questions.
The problem of thermal evaporation of cold clouds embedded in a hot medium has been considered in a number of papers (Cowie & McKee 1977, McKee & Cowie 1977, Balbus & McKee 1982, McKee & Begelman 1990, Bandiera & Chen 1994 among others). This problem is relevant for the survival of cold clouds in multi-phase cluster cooling flows (e.g., Böhringer & Fabian 1989, Fabian, Canizares, & Böhringer 1994). The general consensus emerging from these studies, as summarized by Fabian (1994), is that heat conduction must be suppressed by one to two orders of magnitude below the Spitzer value, otherwise the radiative cooling of the gas will be overcome by heat conduction. However, the direct evidence for suppression of heat conductivity in the intracluster medium (ICM) is scarce (one of a few examples can be found in Bechtold et al. 1983). The Chandra observations of the interstellar medium in the Coma galaxies presented here allow a direct study of cold clouds embedded in a hot intracluster medium.
We use km s-1 kpc-1, which implies a linear scale of 0.68 kpc per arcsec at the Coma distance ( Mpc).
2 CHANDRA observations
The Coma cluster was observed with ACIS in the fall of 1999 in a series of 6 pointings with individual exposures of ksec. The pointing position was kept the same during these observations, with NGC 4874 and NGC 4874 located at off-axis distances of 2.8′ and 4.0′, respectively. The detector was moved in the focal plane between the pointings, so that the galaxies were observed by both ACIS-I (4 times) and ACIS-S (2 times). There were no background flares in the Coma observations. In one pointing, NGC 4874 was located in the gap between the ACIS-I chips. The total exposure was 48 ksec for NGC 4874 and 56 ksec for NGC 4889.
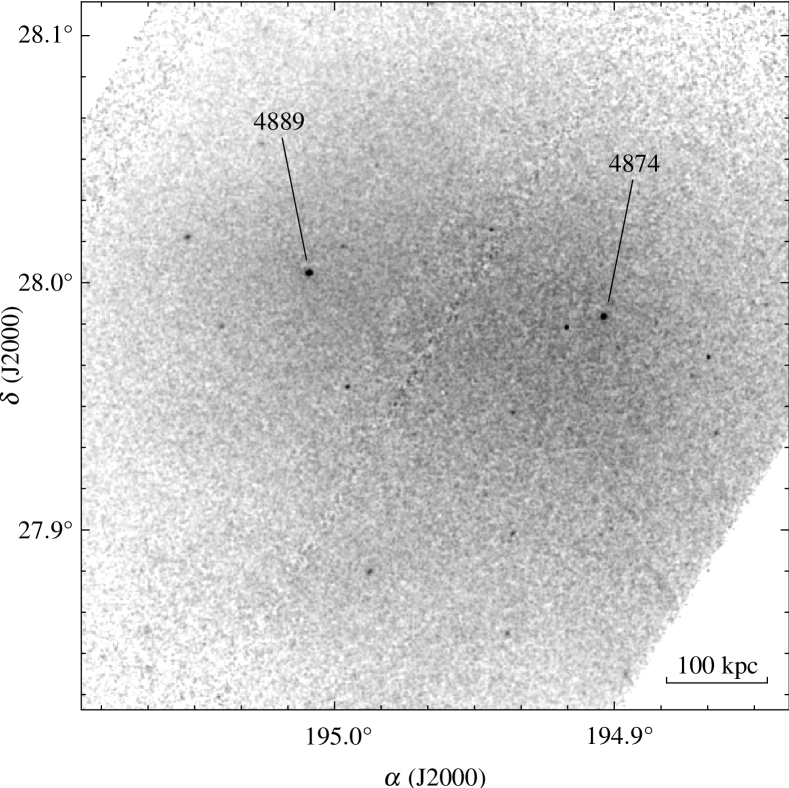
The central part of the composite ACIS-I image is shown in Fig. 3. Notice the faint arcmin-scale X-ray enhancements around NGC 4874 and 4889, previously detected by ROSAT. At the center of these extended structures there are bright (500 counts) compact sources coincident with the optical positions of the galaxies. The observed 0.5–2 keV flux is erg s-1 cm-2 for NGC 4874 and erg s-1 cm-2 for NGC 4889, corresponding to luminosities in the same band of and erg s-1.
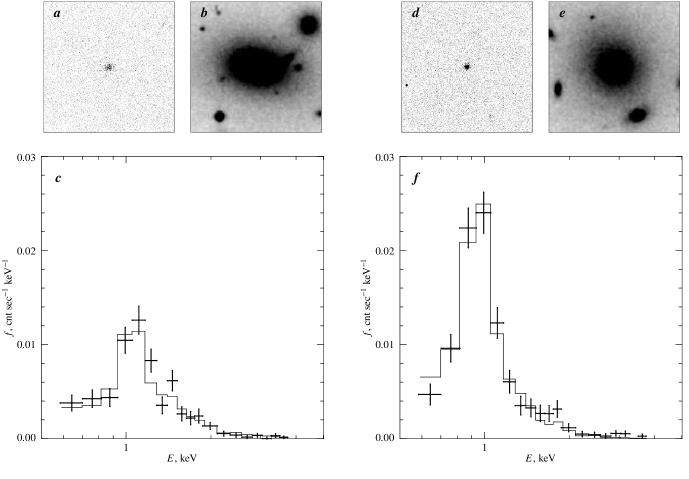
The enlarged X-ray and optical images of NGC 4874 and 4889 are shown in Fig. 2. The X-ray sources associated with the galaxies are extended, but unlike most ellipticals, the X-ray emission is much more compact than the distribution of optical light. Below we discuss these interesting objects in detail.
3 Spectral analysis
The spectra of the NGC 4874 and 4889 sources were extracted within a radius of 7′′ (which encompasses most of the observed X-ray flux). Since we are interested in the intrinsic properties of the galaxies, we collected the background spectra in the 15′′–30′′ annuli around them, so it includes the true background as well as the emission of the Coma cluster. The source, background spectra, and the response files were generated individually for each pointing. We then co-added the observed spectra and averaged the response files for each source.
In the spectra for both galaxies (Fig. 2), one immediately notices strong emission lines near 1 keV — a key signature of a 1 keV-temperature plasma. Indeed, the spectra are well fit by the Mewe-Kaastra-Liedahl model in XSPEC with the absorption fixed at the Galactic value cm-2. Therefore, the observed X-ray emission is most likely produced by warm interstellar gas. The X-ray emission cannot be due to the integrated emission of stars because its spatial distribution does not follow the optical light (Fig. 2 and 4). Any significant contribution by low-mass X-ray binaries (LMXB) can be ruled out because it also should follow the starlight and have a very different (hard) spectrum (Sarazin, Irwin, & Bregman 2001).
The best-fit temperatures and metal abundances of these sources are listed in Table 3 (the uncertainties hereafter are at the 68% confidence level for one interesting parameter). The average temperature is 1.0 keV for NGC 4874 and 1.8 keV for NGC 4889. The average abundance of heavy elements is close to the Solar value in both galaxies. This is significantly higher than the metal abundance in the surrounding Coma gas (, Arnaud et al. 2001).
Chandra’s angular resolution permits spectral fitting in several concentric annuli in NGC 4874. This analysis reveals a marginally significant (at the 99% confidence level) decrease of the gas temperature towards the center of the galaxy (Fig. 4 and Table 3). NGC 4889 does not show any non-isothermality, but the statistical errors are much larger.
| Object | (keV) | (Solar) | |
|---|---|---|---|
| NGC 4874 | 23.5/16 | ||
| NGC 4874 (0′′–1.5′′) | 16.5/17 | ||
| NGC 4874 (1.5′′–4′′) | 14.1/17 | ||
| NGC 4889 |
∗ — fixed.
The errorbars are at the confidence level for one interesting parameter. The lower limit on the average metal abundance is and for NGC 4874 and NGC 4889, respectively.
We also checked for a possible fall in the projected temperature of the main cluster emission on an arcmin scale around the galaxies, as observed by XMM around NGC 4874 (Arnaud et al. 2001). We find no indication for cool gas beyond the small radius of the galactic sources. In the 10′′–1′ annuli centered on the galaxies, we measure and keV for NGC 4874 and 4889, respectively; these temperatures are consistent with Chandra and XMM temperatures farther away, in the 1′–3′ annuli around the galaxies.
4 Spatial distribution of the interstellar gas
The X-ray surface brightness profile of NGC 4874 is shown in Fig. 4. A comparison with the point source profile (dotted line) clearly shows that the observed X-ray emission is extended. We fit the observed profiles with the -model, , truncated at some radius, , which is also a free parameter. The truncation of the gas distribution at is required because the ISM is embedded in the high-pressure cluster gas and, obviously, cannot extend beyond the radius at which the internal and external pressures are equal. The distribution of volume emissivity was computed assuming a constant temperature for NGC 4889 and the observed temperature gradient for NGC 4874 (Fig. 4).
We had to account for the Chandra PSF in fitting the surface brightness profiles because the source size is comparable to that of the PSF. The PSF model was obtained from the library of raytracing simulations; the PSF model is consistent with the image of the point source located East of NGC 4874.
| Object | , cm-3 | , kpc | , kpc | |
|---|---|---|---|---|
| NGC 4874 | ||||
| NGC 4874, no cut | ||||
| NGC 4889 | ||||
| NGC 4889, no cut |
∗ — fixed.
The results of the surface brightness profile modeling are summarized in Table 4. We were unable to obtain meaningful constraints on because of the parameter correlation and finite PSF. Generally, all are allowed. The cutoff and core-radii are well-constrained for . For larger , the cutoff radius becomes much larger than the core-radius and hence has almost no effect on the observed profile. For a pure -model without a cutoff, must be in excess of , mimicking the cutoff at , which is consistent with the best-fit . Of course, different models correspond to very similar absolute gas density distributions in the radial range of interest.
![[Uncaptioned image]](/html/astro-ph/0102483/assets/x3.png) Figure 3: Temperature profile of NGC 4874. Metal abundance and absorption
were fixed at their average values. The statistical significance of
the temperature difference in the radial ranges 0′′–1.5′′ and 1.5′′–4′′ is 99%. The temperature gradient can be
modeled as
Figure 3: Temperature profile of NGC 4874. Metal abundance and absorption
were fixed at their average values. The statistical significance of
the temperature difference in the radial ranges 0′′–1.5′′ and 1.5′′–4′′ is 99%. The temperature gradient can be
modeled as
![[Uncaptioned image]](/html/astro-ph/0102483/assets/x4.png) Figure 4: X-ray surface brightness profile of NGC 4874 in the 0.5–2 keV
band. Dotted line shows the expected radial profile for a point-like
source; it is consistent with the observed profile of the source
located to the East of NGC 4874 (Fig. 2).
The solid line shows a -model fit. The long-dashed line shows a
-model fit truncated at . The fits are almost
indistinguishable because of the PSF smearing. The dashed line shows
the HST optical surface brightness profile multiplied by the observed
ratio (Sarazin et al. 2000) and therefore
should represent the LMXB contribution to the observed X-ray flux.
Figure 4: X-ray surface brightness profile of NGC 4874 in the 0.5–2 keV
band. Dotted line shows the expected radial profile for a point-like
source; it is consistent with the observed profile of the source
located to the East of NGC 4874 (Fig. 2).
The solid line shows a -model fit. The long-dashed line shows a
-model fit truncated at . The fits are almost
indistinguishable because of the PSF smearing. The dashed line shows
the HST optical surface brightness profile multiplied by the observed
ratio (Sarazin et al. 2000) and therefore
should represent the LMXB contribution to the observed X-ray flux.
5 Discussion
5.1 Pressure Equlibrium of ISM and Cluster Gas
It is interesting to compare the pressure of the ISM at the best-fit cutoff radius with the external pressure of the cluster gas. Even though the three-dimensional location of the galaxies within the cluster is uncertain, the ICM density in their vicinity can be determined rather accurately because each galaxy has an associated arcmin-scale X-ray enhancement (Vikhlinin et al. 1994): cm-3 around NGC 4874 and cm-3 around NGC 4889. The temperature of the cluster gas around both galaxies is keV (see above). Remarkably, we find that for the observed ISM parameters, the pressure ratio at is for NGC 4874 and for NGC 4889. Therefore, the pressure of the ISM in both galaxies equals the external pressure at a radius where the Chandra image independently indicates an ISM density cutoff. This is a clear indication that the distribution of the ISM is affected by the external pressure. The derived central ISM densities are higher by a factor of 2–10 than those normally found in isolated elliptical galaxies ( cm-3; Forman, Jones & Tucker 1985), which also suggests compression by an external pressure.
5.2 Origin and Lifetime Scales for the ISM
Stellar ejecta is the most likely source of interstellar gas since the metal abundance in the ISM of both galaxies is significantly higher than that in the Coma ICM. The observed gas mass ( and in NGC 4874 and NGC 4889, respectively) would be ejected by stars over the time , where is the stellar mass loss rate per unit optical luminosity. Using the generally adapted value yr-1 (Faber & Gallagher 1976) and the optical luminosity within (Faber et al. 1997), we find yr in both galaxies. Therefore, stellar ejecta easily produce the observed ISM over the galaxy lifetime. The ISM is subject to radiative cooling, thermal evaporation due to the surrounding hot gas, heating by stellar winds and supernovae, and possibly to ram pressure stripping.
Ram pressure stripping. The observed X-ray centroids are within 0.5 kpc of the optical centers (limited by the Chandra aspect accuracy). This and the azimuthally symmetric X-ray morphology probably exclude any significant ongoing stripping. Stripping will be unimportant if the galaxies move together with their surrounding 100 kpc scale gas density enhancements.
Radiative cooling. The average cooling time of the ISM is . For the observed ISM parameters, we find yr for NGC 4874 and yr for NGC 4889, with a uncertainty.
Stellar winds and supernovae. After years past the burst of star formation, the average temperature of ejecta from normal stars and supernovae is keV (David, Forman, & Jones 1990). Therefore, stellar mass loss cannot be a source of heating for the ISM with keV.
Thermal evaporation. Following Cowie & McKee (1977), one can show that classical heat conduction through the ISM-ICM boundaries of our galaxies should be saturated. From their equation (64), we find the saturated evaporation timescales yr for NGC 4874 and for NGC 4889, with a 20% formal statistical uncertainty.
The timescales for radiative cooling and classical evaporation are both very short and the ISM would be destroyed quickly by either mechanism, unless the radiative cooling and the heat influx that drives evaporation balance each other. This would be achieved if the conductivity through the ICM-ISM interface is a factor of below the classical value. A plausible reason for such a suppression is a disjoint magnetic structure of the ISM and ICM.
5.3 Thermal Balance in NGC 4874
If heat influx from the ICM does balance radiative cooling of the ISM, one expects that at each radius, the X-ray volume emissivity of the ISM equals the divergence of the heat flux (i.e., the local heating rate). Interestingly, this can be verified for NGC 4874, where we observe a temperature gradient and therefore can estimate the heat flux. Assuming that conductivity in the ISM is classical, the heat flux is erg cm-2 s-1 where is the plasma temperature in degrees (McKee & Cowie 1977). For the observed radial dependence of temperature in NGC 4874 which can be modeled as (Fig. 4), the divergence of is indeed within a factor of 1.5 of the observed X-ray volume emissivity.
For NGC 4889, the uncertainty in the temperature profile is too large to compute the heat flux. However, we can say that its ISM temperature is too high to be plausibly maintained by internal heat sources such as stellar mass loss and supernovae, so there should be external heating, most likely due to conduction through the ISM boundary.
6 Summary
Chandra observations show that the dominant Coma galaxies retain a fraction of their X-ray coronae in the form of compact ( kpc in size) clouds with temperatures of and keV which are in the pressure equilibrium with the hot intracluster gas. Time scales for radiative cooling and classical evaporation are very short but the ISM observed in two galaxies is unlikely to be a transient phenomenon. We propose that cooling in the ISM is balanced by heat influx through the cluster/ISM interface. For this, thermal conductivity through the interface should be 30–100 times below the classical value, perhaps because of the disjoint magnetic field structure. Furthermore, in NGC4874, the observed radial temperature gradient implies that if the conductivity inside the ISM cloud is classical, then heat from outside the cloud is distributed through the cloud volume in such a way that it precisely balances radiative cooling at each radius. This leaves little or no energy for the ISM evaporation, preserving the ISM clouds for a sufficiently long time.
References
- (1)
- (2) Arnaud, M., et al. 2001, A&A, 365, L67
- (3)
- (4) Balbus, S. A. & McKee, C. F. 1982, ApJ, 252, 529
- (5)
- (6) Bandiera, R. & Chen, Y. 1994, A&A, 284, 637
- (7)
- (8) Bechtold, J., Forman, W., Giacconi, R., Jones, C., Schwarz, J., Tucker, W., & Van Speybroeck, L. 1983, ApJ, 265, 26
- (9)
- (10) Böhringer, H. & Fabian, A. C. 1989, MNRAS, 237, 1147
- (11)
- (12) Briel, U. G., Henry, J. P., & Böhringer, H. 1992, A&A, 259, L31
- (13)
- (14) Briel, U. G., et al. 2001, A&A, 365, L60
- (15)
- (16) Cowie, L. L. & McKee, C. F. 1977, ApJ, 211, 135
- (17)
- (18) David, L. P., Forman, W., & Jones, C. 1990, ApJ, 359, 29
- (19)
- (20) Faber, S. & Gallagher, J. 1976, ApJ, 204, 365
- (21)
- (22) Faber, S. M. et al. 1997, AJ, 114, 1771
- (23)
- (24) Fabian, A. C. 1994, ARA&A, 32, 277
- (25)
- (26) Fabian, A. C., Canizares, C. R., & Böhringer, H. 1994, ApJ, 425, 40
- (27)
- (28) Forman, W., Jones, C., & Tucker, W. 1985, ApJ, 293, 102.
- (29)
- (30) McKee, C. F. & Begelman, M. C. 1990, ApJ, 358, 392
- (31)
- (32) McKee, C. F. & Cowie, L. L. 1977, ApJ, 215, 213
- (33)
- (34) Sarazin, C. L., Irwin, J. A., & Bregman, J. N. 2001, ApJ, submitted
- (35)
- (36) Vikhlinin, A., Forman, W., & Jones, C. 1994, ApJ, 435, 162
- (37)
- (38) Vikhlinin, A., Forman, W., & Jones, C. 1997, ApJ, 474, L7
- (39)
- (40) White, S. D. M., Briel, U. G., & Henry, J. P. 1993, MNRAS, 261, L8
- (41)