22institutetext: Isaac Newton Institute of Chile, SAO Branch
On the metallicities of UM 133, UM 283 and UM 382
The study of group properties of the extremely metal-deficient gas-rich local dwarfs is very promising for the understanding the galaxy formation process at high redshifts. About 20 such objects have been picked up from the literature in the recent review by Kunth & Östlin (Kunth00 (2000)). However part of these galaxies got low metallicity as a result of earlier observations, and can have rather large uncertainties in their cited element abundances. Before to perform the detailed studies of such galaxies as of some extreme group, it is useful to revise their metallicities. We present the results of the SAO 6 m telescope spectrophotometry of two Blue Compact Galaxies (BCG) reported from earlier studies as very metal-poor objects. Well measured [O iii] line 4363 Å allows to deduce the temperature in Hii regions and get reliable abundances of chemical elements. For UM 133 we derive 12+log(O/H) = 7.630.02, coincident with the published value. UM 382, according to our data, is significantly more metal-rich: its 12+log(O/H) = 7.820.03 in comparison to the published value 7.45. The third galaxy, UM 283 seems have got its very low 12+log(O/H) = 7.59 due to a misprint. We used its published emission line intensities and derived instead the value of 7.95. Thus the latter two galaxies should NOT be considered as the extremely metal-poor BCGs.
Key Words.:
galaxies: abundances – galaxies: dwarf – galaxies: star-forming – galaxies: individual (UM 133, UM 283, UM 382)1 Introduction
Since the discovery of low metallicity gas in H ii regions of Blue Compact Galaxies (BCGs) by Searle & Sargent (Searle72 (1972)), a debate lasting for decades on possible existence of local truly young galaxies is still continuing. While the great majority of BCGs have metallicities Z in the range of (1/10 – 1/3) Z⊙, or respectively 12+log(O/H) in the range 7.92 – 8.42 11112+log(O/H)⊙ = 8.92 (Anders & Grevesse Anders89 (1989))., very few galaxies have O-abundance as low as 12+log(O/H) = 7.1–7.6, consistent with the expected oxygen enrichment produced in one star formation (SF) episode. Izotov & Thuan (IT99 (1999)) from the analysis of variations of C and N abundances have shown, that namely the BCGs with 12+log(O/H) 7.6 are the best candidates to the galaxies with the first SF episode. To clear up the true evolution status of these extremely metal-poor BCGs is a serious challenge for observational astrophysics. However, independently on whether their current SF burst is the first or second one, properties of these local well resolved galaxies best approximate those of primeval low-mass galaxies at high redshifts. Therefore systematic studies of the group properties of this small sample are very important from cosmological point of view.
Kunth & Östlin (Kunth00 (2000)) (KÖ), in their review of the problems related to the most metal-poor galaxies, summarized published up-to-now data and presented the compilative list of these galaxies. In course of the studies of new large samples of BCGs in a broader context, we attempt to find and study as well new very metal-poor galaxies (e.g., Kniazev et al. Kniazev98 (1998), 2000a , 2000b , Pustilnik et al. VLA (2001)). In parallel we check old measurements for several BCGs, claimed to have very low metallicities. In particular, we reobserved two BCGs presented in the KÖ list – UM 133 and UM 382. Reticon spectrophotometry for these two BCGs is originally from Terlevich et al. (TMMMC91 (1991)) and Masegosa et al. (MMMC-A94 (1994)).
In this paper we present a new spectrophotometry with the SAO RAS 6 m telescope for UM 133 and UM 382. For UM 283 with its published emission line intensities we revised its claimed very low O abundance. Hubble constant = 75 km s-1Mpc-1 was used through the paper.
| Galaxy | Btot | A | |||||
| Name | |||||||
| (1) | (2) | (3) | (4) | (5) | (6) | (7) | (8) |
| UM 133 | 01 44 41.3 | +04 53 26 | 15710051 | 0.300.061,4 | 0.16 | 162342 | –1604 |
| UM 283 | 00 51 49.5 | +00 33 53 | 16970025 | 0.10 | 41975 | –1667 | |
| UM 382 | 01 58 09.4 | –00 06 38 | 18560063 | 0.400.083 | 0.12 | 3526300 | –1491 |
| Btot – total blue magnitude; AB – Galactic extinction; MB – absolute blue magnitude; | |||||||
| N Data from NED; E With Galactic extinction correction; | |||||||
| References: 0 This paper 1 Kniazev et al. (UM133 (2001)); 2 Thuan et al. (Thuanetal99 (1999)); 3 Salzer et al. (SAB89 (1989)); | |||||||
| 4 Telles & Terlevich (TT97 (1997)); 5 Pérez-Gonzáles et al. (PG2000 (2000)). | |||||||
| Galaxy | Date | Instrument | Exposure | Wavelength | Dispersion | Slit | Seeing | PA | Airmass |
|---|---|---|---|---|---|---|---|---|---|
| Name | time [s] | Range [Å] | [Å/pixel] | [arcsec] | [arcsec] | ||||
| (1) | (2) | (3) | (4) | (5) | (6) | (7) | (8) | (9) | (10) |
| UM 133 | 04.09.1999 | 6 m, LSS | 1200 | 4.6 | 1.3 | 1.5 | 22 | 1.31 | |
| UM 133 | 03.10.2000 | 6 m, LSS | 3600 | 2.4 | 2.0 | 1.2 | 22 | 1.30 | |
| UM 133 | 05.10.2000 | 6 m, LSS | 1800 | 2.4 | 2.0 | 1.2 | 22 | 1.29 | |
| UM 382 | 04.09.1999 | 6 m, LSS | 1200 | 4.6 | 1.3 | 1.5 | 46 | 1.52 | |
| UM 382 | 06.10.1999 | 6 m, LSS | 1200 | 2.4 | 2.0 | 1.0 | 46 | 1.39 | |
| UM 382 | 03.10.2000 | 6 m, LSS | 1800 | 2.4 | 2.0 | 1.2 | 0 | 1.39 | |
| UM 382 | 05.10.2000 | 6 m, LSS | 1800 | 2.4 | 2.0 | 1.2 | 0 | 1.39 |
2 Observations and data reduction
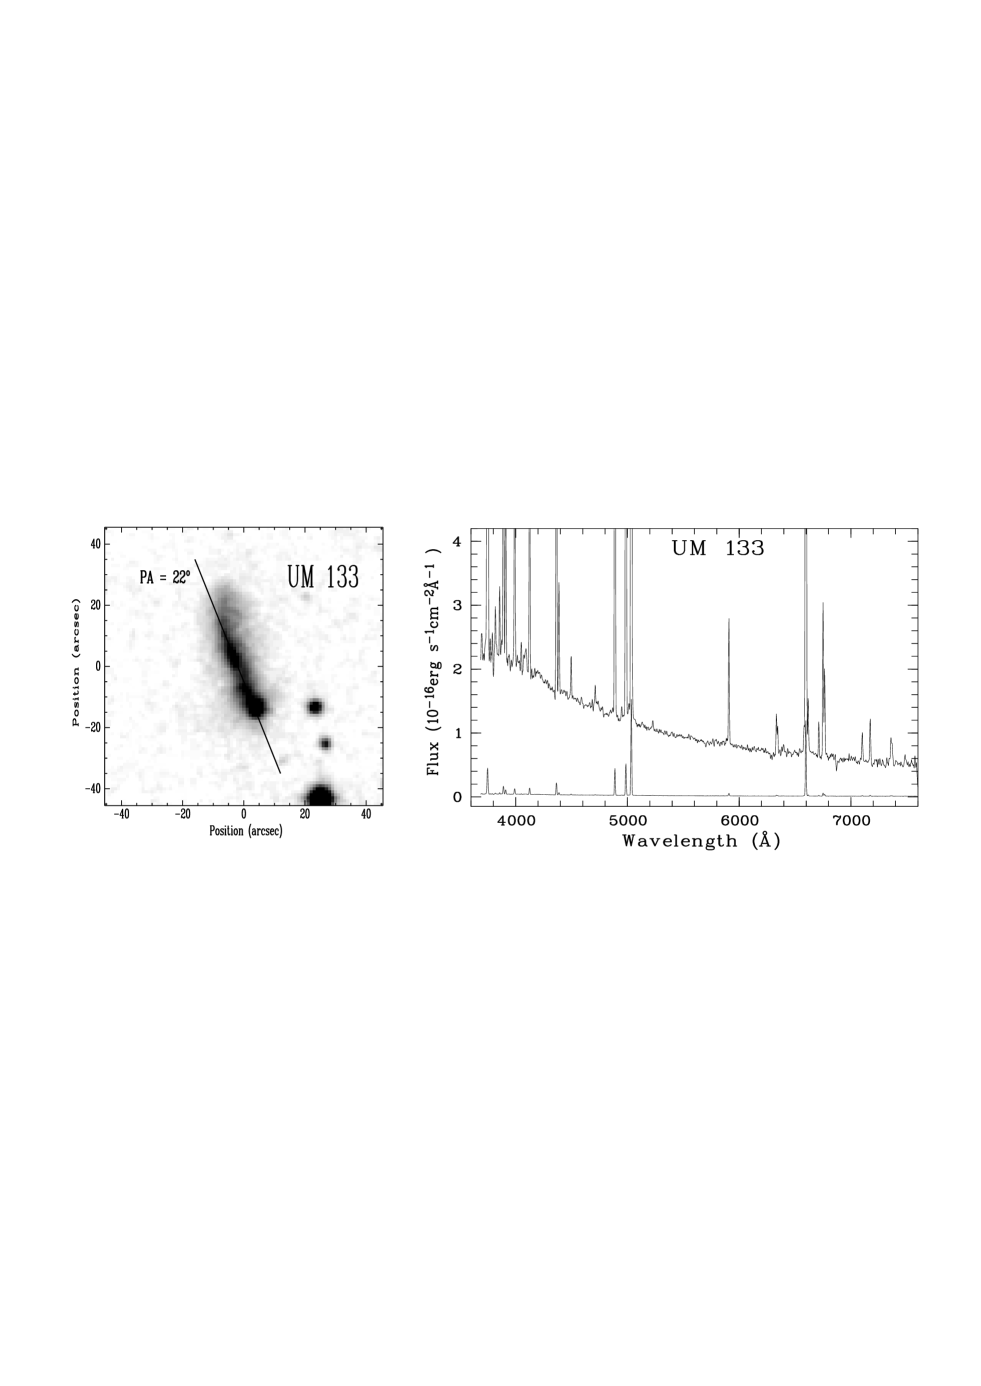
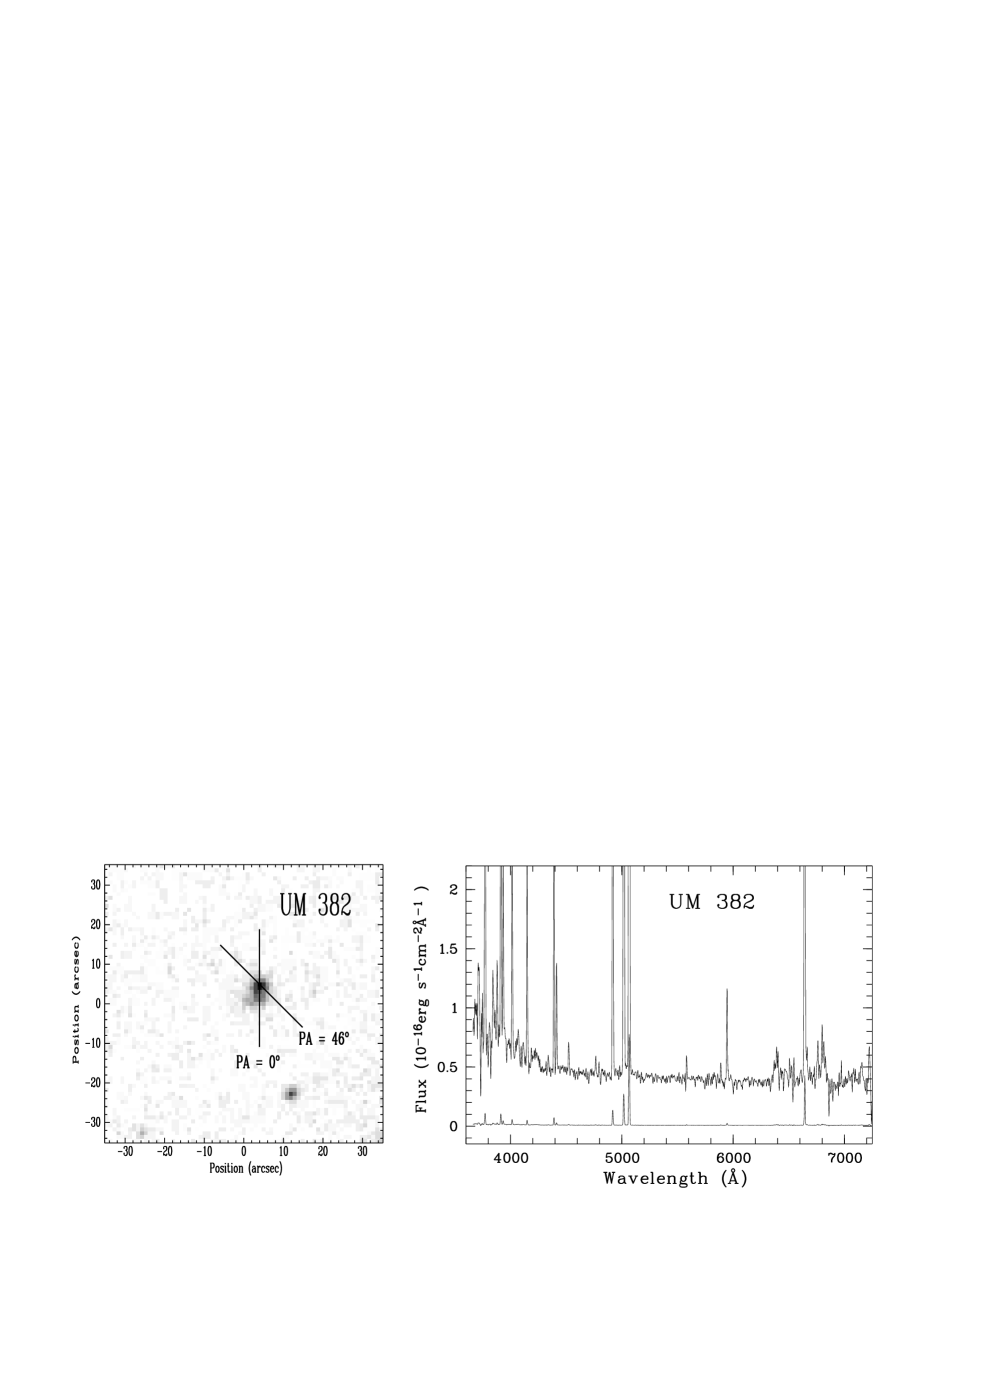
Some parameters of the studied galaxies either known from the literature or derived in this paper are presented in Table 1. The spectroscopic data were obtained with the 6 m telescope of the Special Astrophysical Observatory of Russian Academy of Science (SAO RAS) during the runs in September 1999 and October 2000 (see Table 2 for details). The Long-Slit spectrograph (LSS) (Afanasiev et al. Afanasiev95 (1995)) at the telescope prime focus was equipped with the Photometrics CCD-detector 10241024 pixels with m pixel size. The long-slit (180″) spectra were obtained with the gratings of 325 and 650 grooves/mm with corresponding dispersions of 4.6 and 2.4 Å/pixel and a spectral resolution 12-15 Å (FWHM) and 7-9 Å respectivelty. The wavelength ranges of the obtained spectra for different hardware configurations are given in Table 2. The slit widths of 1.3″ and 2″ were used. The scale along the slit was 0.39 ″/pixel in all cases. For UM 133 the slit, centered on the brightest SW knot (see in Fig. 1), was oriented along the main body of the galaxy.
Reference spectra of an Ar–Ne–He lamp were recorded before or after each observation to provide wavelength calibration. Spectrophotometric standard stars from Bohlin (Bohlin96 (1996)) were observed for flux calibration. Observations have been conducted mainly under the software package NICE in MIDAS, described by Kniazev & Shergin (Kniazev95 (1995)).
To be confident that we observed the same parts of the galaxies with the different set-ups in different nights we employed the differential method of pointing the telescope to the specific position in the target galaxy. It consisted of the following steps: 1). the positions of both the specific bright knot in the target galaxy and that for off-set bright enough star at the distance (1–2)′ were carefully measured from DSS-2; 2). the position angle of the slit for observations of the target was set; 3). the telescope was pointed on the coordinates of the off-set star; 4). the center of the slit was shifted to the center of this off-set star and the respective correction was saved by the telescope pointing program; 5). finally the telescope was pointed on the coordinates of the specific knot in the target galaxy using this correction. The latter was defined for each observation independently, since it depends on concrete azimuth and zenith distance of the target.
Procedures of primary data reduction included cosmic-ray removal in MIDAS222MIDAS is an acronym for the European Southern Observatory package – Munich Image Data Analysis System. and bias subtraction and flat-field correction in IRAF333IRAF: the Image Reduction and Analysis Facility is distributed by the National Optical Astronomy Observatories, which is operated by the Association of Universities for Research in Astronomy, In. (AURA) under cooperative agreement with the National Science Foundation (NSF). software packages. For the following reduction of the long-slit spectra we used IRAF. After the wavelength mapping and night sky subtraction, each 2D frame was corrected for atmospheric extinction and was flux calibrated. To derive the sensitivity curves, we used the spectral energy distributions of the standard stars. Average sensitivity curves were produced for each observing night. 2D blue and red parts of spectra were extracted using APALL IRAF task and 2D combined spectrum for each object was created by SCOMBINE task.
Finally, the 1D spectrum was extracted from a region along the slit, where (4363 Å) 2 ( is the dispersion of a noise statistics around this line). The size of integrated region was 3.5″ for UM 133 and 3.1″ for UM 382. The 1D extracted spectra of UM 133 and UM 382 are shown in Fig. 1 and Fig. 2.
| UM 133 | UM 382 | UM 283b | ||||
| (Å) Ion | F()/F(H) | I()/I(H) | F()/F(H) | I()/I(H) | F()/F(H) | I()/I(H) |
| 3727 [O ii] | 1.17120.0148 | 1.18890.0159 | 0.6890.013 | 0.7840.038 | 5.24 | 5.74 |
| 3835 H9 | 0.04920.0040 | 0.06140.0065 | 0.0600.002 | 0.0720.007 | — | — |
| 3868 [Ne iii] | 0.32290.0072 | 0.32680.0074 | 0.6780.022 | 0.7580.038 | — | — |
| 3889 He i + H8 | 0.17990.0066 | 0.19300.0082 | 0.2670.017 | 0.3000.022 | — | — |
| 3967 [Ne iii] + H7 | 0.23190.0060 | 0.24500.0074 | 0.2530.010 | 0.2830.016 | — | — |
| 4101 H | 0.25230.0079 | 0.26420.0090 | 0.2550.010 | 0.2800.014 | — | — |
| 4340 H | 0.46270.0065 | 0.47250.0074 | 0.4420.010 | 0.4680.015 | 0.39 | 0.41 |
| 4363 [O iii] | 0.08690.0046 | 0.08720.0046 | 0.1380.006 | 0.1460.007 | — | — |
| 4686 He ii | 0.01180.0032 | 0.01180.0033 | — | — | — | — |
| 4861 H | 1.00000.0127 | 1.00000.0130 | 1.0000.025 | 1.0000.025 | 1.00 | 1.00 |
| 4959 [O iii] | 1.21340.0123 | 1.20390.0123 | 2.2230.050 | 2.1970.050 | 1.15 | 1.14 |
| 5007 [O iii] | 3.64180.0352 | 3.61050.0351 | 6.4500.130 | 6.3460.130 | 3.24 | 3.21 |
| 6563 H | 2.85140.0284 | 2.77250.0302 | 3.2140.344 | 2.7870.325 | 3.15 | 2.86 |
| 6717 [S ii] | 0.11480.0053 | 0.11130.0052 | 0.0910.016 | 0.0780.014 | 0.42 | 0.38 |
| 6731 [S ii] | 0.06740.0048 | 0.06540.0047 | 0.0660.016 | 0.0570.014 | 0.39 | 0.35 |
| C(H) dex | 0.030.01 | 0.180.14 | — | |||
| EW(abs) Å | 1.000.35 | 0.250.35 | — | |||
| F(H)a | 1912 | 602 | 136 | |||
| EW(H) Å | 1591 | 1352 | 122 | |||
| a in units of 10-16 ergs s-1cm-2; b all data are taken from Gallego et al. (Gallego96 (1996)). | ||||||
All spectra of UM 133 and UM 382 obtained during the different observational runs (see Table 2) were used for calculation of chemical element abundances. These values of abundances are consistent within the observational uncertainties for different runs. As final results we used the best quality spectra obtained during October 2000 run.
The redshifts and line fluxes were measured with MIDAS software as described in Kniazev et al. (2000b ) and Hopp et al. (Hopp2000 (2000)). The errors of the line intensities have been propagated in the calculations of the element abundances. For the simultaneous derivation of (H) and (abs) and correction for extinction we used the procedure described in detail by Izotov et al. (Izotov97b (1997)). The high S/N ratio 6 m spectra permit to derive the element abundances with a higher precision than in the previous studies. The abundances of the ionized species and the total abundances of O, Ne and Ar also have been obtained following the procedure detailed in Izotov et al. (Izotov94 (1994)), Thuan et al. (Thuan95 (1995)), Izotov et al. (Izotov97b (1997). The abundance of O3+ ion is derived following to Izotov & Thuan (IT99 (1999)) with use of the intensity of He ii 4686 line.
The observed emission line intensities , and those corrected for the interstellar extinction and underlying stellar absorption are presented in Table 3. The observed H equivalent width (H), absorption Balmer hydrogen lines equivalent widths (abs), H flux and the extinction coefficient (H) are also shown in Table 3.
| Value | UM 133 | UM 382 | UM 283 |
|---|---|---|---|
| (OIII)(K) | 16,669451 | 16,187421 | 16,100a |
| (OII)(K) | 14,502373 | 14,297354 | 14,070 |
| (SIII)(K) | 15,535374 | 15,135349 | — |
| (SII)(cm-3) | 10 | 45376 | 100a |
| O+/H+(105) | 1.1400.080 | 0.7890.065 | 2.99 |
| O++/H+(105) | 3.0550.204 | 5.8000.387 | 6.09 |
| O+++/H+(105) | 0.0630.020 | — | — |
| O/H(105) | 4.2580.220 | 6.5890.392 | 9.08 |
| 12+log(O/H) | 7.630.02 | 7.820.03 | 7.95 |
| Ne++/H+(105) | 0.5940.043 | 1.4900.128 | — |
| ICF(Ne)b | 1.394 | 1.136 | — |
| log(Ne/O) | –0.710.04 | –0.590.05 | — |
| a data from Gallego et al. (Gallego97 (1997)). | |||
| b ICF is the ionization correction factor for unseen stages of ionization. The expressions for ICFs are adopted from Izotov et al. (Izotov94 (1994)). | |||
3 Results
The results of the chemical abundance determination for the studied galaxies are presented in Table 4. The comparison of the respective data for Ne abundance for UM 133 and UM 382 with the abundance ratios from Izotov & Thuan (IT99 (1999)) shows that they well agree with the derived average values for the sample of low metallicity BCGs.
3.1 UM 133
The galaxy is elongated and resembles on morphology a comet-like object. In fact, according to NED, UM 133 is a bright H ii region at the SW edge of Sc galaxy CGCG 412–024. It looks like an edge-on disk, bent on NE edge. The full range of the velocity curve from our 2D spectrum is about 100 km s-1. This is slightly lower than W0.2=12211 km s-1 – the full width for the 21 cm line of the integrated Hi emission at the level 0.2 of peak (Thuan et al. Thuanetal99 (1999)). We derived from our data the systemic radial velocity of host galaxy of 162015 km s-1, which is well consistent with that derived from the integral Hi profile (Thuan et al. Thuanetal99 (1999)) and with optical data from Huchra et al. (Huchra1999 (1999)). The radial velocity of UM 133 itself is on our data 1590 km s-1. The continuous H-emission and a smooth velocity distribution along the galaxy body supports its interpretation as a single galaxy (CGCG 412–024) with a bright Hii region (UM 133) at the SW edge.
As it is well seen on 1D spectrum of UM 133, there is blue bump near 4700Å, characteristic of WR stars. Its detailed quantitative analysis along with other observational data is the subject of a forthcoming paper by Kniazev et al. (UM133 (2001)).
3.2 UM 382
The galaxy has a star-forming region on the Northern edge. We got the spectra of this region during 2 observational runs. The derived oxygen abundance of UM 382 (12+log(O/H) = 7.820.03) is significantly higher than those presented by Masegosa et al. (MMMC-A94 (1994)) (7.450.04) and derived on the same data by Telles (Telles95 (1995)) (7.520.07). Since the latter results were obtained from a Reticon spectrum with a lower S/N ratio and our data from two observational runs are consistent each to other, we consider the new data as a more reliable. Therefore UM 382 is not an extremely metal-poor H ii galaxy. The main reason for the difference with earlier results is in the relative fluxes of [Oiii] 4363 line. Masegosa et al. (MMMC-A94 (1994)) got for this parameter the value of 0.25, while in our spectra it is only 0.1380.006. The another more reliable value from our data is the extinction coefficient (H) = 0.18 in opposite to quite unusual for this sort of galaxies value of 0.71 from Terlevich et al. (TMMMC91 (1991)). The heliocentric velocity for this galaxy on our data is Vhel = 352630 km s-1 in comparison to the value of 3598 km s-1 from Terlevich et al. (TMMMC91 (1991)).
3.3 UM 283
This galaxy have appeared with the oxygen abundance of 12+log(O/H)=7.59 in Gallego et al. (Gallego97 (1997)) as UCM 0049+0017. We have paid attention that the relative line intensities for this object reproduced in our Table 1 from Table 4 of Gallego et al. (Gallego96 (1996)), according to the standard method by Pagel et al. (Pagel92 (1992)) lead, with Te=16,100 (Gallego et al. Gallego97 (1997)) to the value 7.95, but not 7.59. Therefore, we suggest that UM 283 appeared as a very metal-poor object just as a result of a misprint.
4 Conclusions
From the data and discussion above we draw the following conclusions:
-
1.
UM 133 is confirmed as an object with very low metallicity (Z 1/20 Z⊙). From the radial velocity distribution along the slit we conclude that this is a bright Hii region on the SW edge of dwarf comet-like galaxy CGCG 412–024. The radial velocities of this Hii region and the whole galaxy differ by no more than 40 km s-1.
-
2.
UM 382 (Z 1/13 Z⊙) and UM 283 (Z 1/9 Z⊙) are significantly more metal-rich than they were claimed in the literature.
Acknowledgements.
Authors are pleased to thank A. Burenkov for the help in observations with the 6 m telescope. The suggestions of the referee F.Legrand helped to improve the presentation of the data. This work was partly supported by the INTAS grant 97-0033. This research has made use of the NASA/IPAC Extragalactic Database (NED) which is operated by the Jet Propulsion Laboratory, California Institute of Technology, under contract with the National Aeronautics and Space Administration. The use of the Digitized Sky Survey from the Space Telescope Science Institute was very helpful on various stages of this research.References
- (1) Afanasiev V.L., Burenkov A.N., Vlasyuk V.V., Drabek S.V. 1995, SAO RAS internal report No. 234
- (2) Anders E., Grevesse N. 1989, Geochim.Cosmochim.Acta, 53, 197
- (3) Bohlin R.C. 1996, AJ, 111, 1743
- (4) Gallego J., Zamorano J., Rego M., Alonso O., Vitores A.G. 1996, ApJS, 120, 323
- (5) Gallego J., Zamorano J., Rego M., Vitores A.G. 1997, ApJ, 475, 502
- (6) Hopp U., Engels D., R.Green, et al. 2000, A&AS, 142, 417
- (7) Huchra J.P., Vogeley M.S., Geller M.J. 1999, ApJS, 121, 287
- (8) Izotov Y., Thuan T.X., Lipovetsky V. 1994, ApJ, 435, 647
- (9) Izotov Y., Thuan T.X., Lipovetsky V. 1997, ApJS, 108, 1
- (10) Izotov Y.I., Thuan T.X. 1999, ApJ, 511, 639
- (11) Kniazev A.Y., Shergin V.S. 1995, SAO RAS internal report No. 249, 1
- (12) Kniazev A.Y., Pustilnik S.A., Ugryumov A.V. 1998, Bulletin SAO, v.46, 23
- (13) Kniazev A.Y., Pustilnik S.A., Ugryumov A.V., Kniazeva T.F. 2000a, Astronomy Letters, 26, 129
- (14) Kniazev A.Y., Pustilnik S.A., Masegosa J., et al. 2000b, A&A, 357, 101
- (15) Kniazev A.Y., Pustilnik S.A., Pramsky A.G., Ugryumov A.V., Kniazeva T.F. 2001, A&A, in preparation
- (16) Kunth D., Östlin G. 2000, A&A Review, 10, 1
- (17) Masegosa J., Moles M., Campos-Aguilar A. 1994, ApJ, 420, 576
- (18) Pagel B.E.J., Simonson E.A., Terlevich R.J., Edmunds M.G. 1992, MNRAS, 255, 325
- (19) Pérez-Gonzáles P.G., Zamorano J., Gallego J., Gil de Paz A. 2000, A&AS, 141, 409
- (20) Pustilnik S.A., Brinks E., Thuan T.X., Lipovetsky V.A., & Izotov Y.I. 2001, AJ, 121, March 2001 (astro-ph/0011291)
- (21) Salzer, J.J., Boroson, T.A., MacAlpine, G.M. 1989, ApJS, 70, 447
- (22) Searle L., Sargent W.L.W. 1972, ApJ, 173, 25
- (23) Telles E. 1995, Ph.D. thesis, University of Cambridge
- (24) Telles, E., Terlevich, R. 1997, MNRAS, 286, 183
- (25) Terlevich R., Melnick J., Masegosa J., Moles M., Copetti M.V.F. 1991, A&AS, 91, 285
- (26) Thuan T.X., Izotov Y., Lipovetsky V. 1995, ApJ, 445, 108
- (27) Thuan T.X., Lipovetsky V.A., Martin J.-M., Pustilnik S.A. 1999, A&AS, 139, 1