THE STRUCTURE AND EVOLUTION OF MAGNETIZED
CLOUD CORES IN A ZERO–DENSITY BACKGROUND11affiliation: To appear in ApJ: June 20, 2001
Abstract
Molecular-line observations of star-forming cloud cores indicate that they are not the flattened structures traditionally considered by theory. Rather, they are elongated, perhaps in the direction of their internal magnetic field. We are thus motivated to consider the structure and evolution of axisymmetric, magnetized clouds that start from a variety of initial states, both flattened (oblate) and elongated (prolate). In this first contribution, the clouds are of fixed mass, and are surrounded by a fictitious medium of zero density and finite pressure. We devise a new technique, dubbed the -method, that allows us to construct magnetostatic equilibria of any specified shape. The mass loading of the field lines then follows from the self-consistent model solution, just the reverse of the standard procedure. We find, in agreement with previous authors, that the field lines in oblate clouds bend inward. However, those in prolate clouds bow outward, confining the structures through magnetic tension.
We next follow the quasi-static evolution of these clouds via ambipolar diffusion. An oblate cloud either relaxes to a magnetically force-free sphere or, if sufficiently massive, flattens along its polar axis as its central density runs away. A prolate cloud always relaxes to a sphere of modest central density. We finally consider the evolution of an initially spherical cloud subject to the tidal gravity of neighboring bodies. Although the structure constricts equatorially, it also shortens along the pole, so that it ultimately flattens on the way to collapse. In summary, none of our initial states can evolve to the point of collapse while maintaining an elongated shape. We speculate that this situation will change once we allow the cloud to gain mass from its environment.
1 INTRODUCTION
After two decades of intense observational effort, astronomers have learned much about the nature of the dense, molecular cloud cores that form low-mass stars (see, e.g., Myers 1999). A typical core, with a mass of several solar masses and a diameter of order 0.1 pc, has a central density somewhat in excess of cm-3 and a kinetic temperature of about 10 K. Zeeman measurements, still only marginally feasible at such densities, suggest magnetic field strengths no larger than 30 G (Crutcher 1999). These figures refer specifically to dense cores in relatively sparse environments like Taurus-Auriga. Those within regions such as Orion, that form high-mass stars, appear to be more massive and warmer, although the measurements here are generally less precise because of the greater distances involved (e.g., Jijina, Myers, & Adams 1999).
To see how a dense core evolves to form a star, one must first have a physical understanding of its structure. A core’s internal velocity dispersion, as gauged from the linewidths of tracer molecules like NH3 and CS, depends on its mass. In low-mass cores, the dispersion is typically 0.2–0.4 km s-1, significantly lower than the background gas. This range in dispersion matches that expected from the virial theorem for objects of the appropriate mass and size. The line profiles, moreover, show only slight nonthermal broadening (Myers & Benson 1983). Finally, the internal magnetic field strength is also consistent with the virial expectation, and with approximate equipartition of thermal and magnetic energies (Myers & Goodman 1988). These facts together imply that the typical low–mass core is in dynamical equilibrium, supported against self-gravity by a combination of ordinary gas pressure and the Lorentz force associated with a largely static magnetic field (McKee et al. 1993).
Theorists have long recognized that such a magnetostatic structure evolves quasi-statically through ambipolar diffusion, i.e., the relative drift of neutrals and ions (Mestel & Spitzer 1956). As the configuration slips through the ambient magnetic field, its central density gradually increases to the point where rapid, protostellar collapse begins (Nakano 1979). While this basic picture continues to provide a framework for our conception of dense core evolution, its quantitative implementation is not without problems. One important issue, and the focus of this paper, concerns the three-dimensional shape of the objects.
Radio maps in a number of tracer lines show dense cores to be distinctly nonspherical, whether they are in loose associations (Benson & Myers 1989) or massive, turbulent complexes (Harju, Walmsley, & Wouterloot 1993), and whether they contain stars or not (Jijina et al. 1999). The observed distribution of projected axial ratios is well matched if the cores are intrinsically prolate structures, with a random orientation of their long axes in the plane of the sky (Myers et al. 1991; Ryden 1996). Theoretical models of magnetostatic clouds, on the other hand, generally predict that they are oblate, flattened along the direction of the background magnetic field (Mouschovias 1976b; Tomisaka, Ikeuchi, & Nakamura 1988a). Under ambipolar diffusion, the central region flattens even more as the central density climbs (Tomisaka, Ikeuchi, & Nakamura 1990).
A useful step toward reconciling theory and observation is to broaden the range of models and consider cores with a variety of intrinsic shapes, including prolate configurations. This is the first task of the present study. The essential reason why previous authors obtained flattened structures is not difficult to see. In solving the equations for force balance, one customarily specifies the amount of mass loading each magnetic flux tube (Mouschovias 1976a). Lacking any observational indication of this mass-to-flux distribution, theorists have taken it from geometrically simple reference states, such as uniform spheres or cylinders threaded by a spatially constant field. Such configurations, however, are clearly not in force balance. If allowed to evolve, they immediately collapse along the field until dynamical equilibrium is restored (see, e.g, Fig. 2 of Fiedler & Mouschovias 1993). The magnetostatic structures resulting from such collapse are inevitably flattened, and become more so during the subsequent phase of quasi-static settling via ambipolar diffusion. This qualitative behavior is unaltered by the presence of isotropic, subsonic turbulence (see, e.g., the schematic treatment of Lizano & Shu 1989).
To remedy this situation, we break from tradition and use the core shape itself as input, rather than the unknown mass-to-flux distribution. That is, we solve the magnetostatic equations subject to the constraint that the gas pressure fall to some uniform, ambient value along a specified boundary. The mass-to-flux distribution then results from the self-consistent numerical solution. We use this technique, dubbed the q-method, to construct a variety of equilibria, with shapes ranging from oblate to prolate. We further distinguish two classes of states, those which are spatially isolated, and those subject to the tidal gravitational field of nearby cores. Study of the first class allows ready comparison with previous authors, while the tidal boundary condition approximates the observed situation within filamentary clouds, where neighboring cores are typically separated by only 0.5–1.0 pc (e.g., L1495 in Taurus; Onishi et al. 1996).
Our next task is to follow the quasi-static evolution of selected initial states through ambipolar diffusion. In this paper, we assume each core to be of fixed total mass. That is, we take the ambient pressure to arise from a fictitious medium of negligible mass density and correspondingly high temperature. Our numerical results first confirm that isolated, oblate structures undergo significant central flattening as their density rises steeply. Isolated, prolate structures experience no runaway increase in density, but instead relax to spheres. Finally, an initially spherical, but tidally stressed configuration does undergo central condensation, but concurrently shrinks along the polar axis. In summary, none of our states both evolves to a high central density and maintains an elongated shape, as the observations seem to demand.
Section 2 below details our numerical method for constructing magnetostatic equilibria with specified shapes. In Section 3, we describe the physical properties of these equilibria. Section 4 then presents numerical results for the quasi-static evolution of a few representative models. Finally, Section 5 assesses our results in light of previous observational and theoretical work. We conclude by emphasizing the potential value in relaxing the assumption of fixed core mass. In a second paper, we shall explore cloud evolution under these more general circumstances.
2 FORMULATION OF THE PROBLEM
2.1 Governing Equations of Equilibrium
The theory of self-gravitating, magnetized cloud equilibria, first discussed by Mestel (1965) and Strittmatter (1966), has been extended and reformulated by many authors—notably Mouschovias (1976a), Nakano (1979, 1984), and Tomisaka et al. (1988a). Here, we briefly review the basic equations, before passing to a discussion of the features unique to our method.
The governing equations are the condition of force balance, Poisson’s equation, and Ampère’s law:
| (1) | |||||
| (2) | |||||
| (3) |
where the chosen symbols are standard. Our adopted equation of state is that of an isothermal gas, , where is the constant sound speed. The ancillary relation
| (4) |
where is the magnetic vector potential, ensures that is satisfied identically.
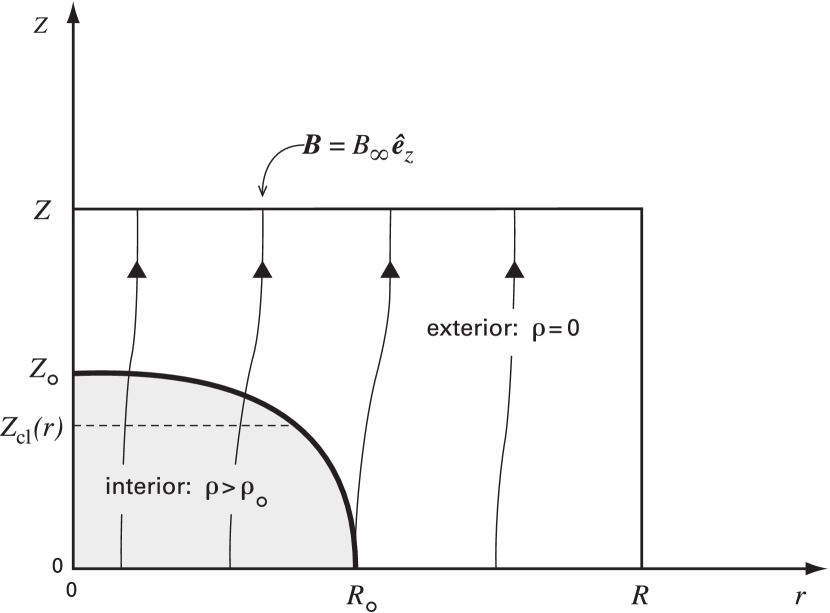
We adopt a cylindrical coordinate system whose origin lies at the cloud center; see Figure 1. We assume axial symmetry about the -axis, and reflection symmetry about the plane . Hence, only the quadrant needs to be considered explicitly. We assume that is poloidal, and hence toroidal. We thus take . Alternatively, , where is the scalar function defined by
The quantity is invariant along each magnetic surface: . Since it is proportional to the usual magnetic flux , i.e. , we refer to loosely as the “magnetic flux,” and use it to label field lines.
It is convenient to resolve the forces in equation (1) both along and across field lines. Following Dungey (1953) and Mouschovias (1976a), we introduce the scalar function
| (5) |
Equation (1) may be rewritten in terms of and as
| (6) |
where we have noted that . While depends on both and , its real utility comes from the fact that it is a function of alone. That is, it follows from equation (6) and that . This property represents force balance in the direction parallel to . Since , we may use equation (6) to express force balance perpendicular to the field as
| (7) |
Using equations (4) and (7), equation (3) becomes
| (8) | |||||
where the terms “interior” and “exterior” refer to the regions inside and outside the cloud, respectively. As in previous studies, the cloud exterior is assumed to be composed of a hot and tenuous gas that has no dynamical effect except to exert a finite pressure, , on the cloud boundary. The exterior region is itself bounded by a cylinder of radius and half-height (see Figure 1). It is on this cylindrical surface that we apply our boundary conditions (see §2.2 below).
Equation (8) is to be solved throughout the entire volume, simultaneously with Poisson’s equation (2),
| (9) | |||||
where we have made use of equation (5) on the right-hand side of the interior equation. Solving the equations in this form guarantees that the relevant continuity conditions for the gravitational and magnetic fields across the cloud surface are satisfied (Mouschovias 1976a).
2.2 Boundary Conditions
The boundary conditions are applied along the cylindrical surface bounding the exterior zero-density region. The boundary condition on is that the magnetic field approach a uniform background value, , at the boundary. That is,
| (10) |
We consider two types of boundary condition on the potential , reflecting different assumptions regarding the external medium. (i) Point-Mass, or “Isolated” Boundary Condition. This boundary condition has been adopted in most previous studies. It asserts that in the exterior region far from the cloud is indistinguishable from that of a point particle of the same mass:
| (11) |
where is the mass of the cloud. In practice, we have used and when applying this boundary condition. Here and are, respectively, the radial and vertical extent of the cloud. Calculations employing larger cylinders give essentially identical results. (ii) Periodic, or “Tidal”, Boundary Condition. This boundary condition dictates that the gravitational force vanish along some surface at a finite distance from the cloud, as is appropriate when surrounding matter is present. We take these surfaces to be the top and bottom of our cylindrical outer boundary (e.g. Fiedler & Mouschovias 1992). The conditions on the potential then become
| (12) |
Note that the first condition holds if the cloud of interest is one of an infinite chain, with a spacing of . The constancy of the potential at simulates the presence of a larger background filament.111Our periodic boundary condition differs from that used by Lizano & Shu (1989), in that the latter authors took the gravitational potential to be constant on a specified locus corresponding to a chain of point masses. Moreover, they forced to equal a uniform background value on that surface.
Finally, the assumed reflection symmetry about implies that
while the vanishing of the radial gravitational force and the lack of magnetic sources along the -axis imply
2.3 Construction of Initial States: The Method
Consider a single magnetic flux tube penetrating the cloud, containing mass and flux . The former is given by (Mouschovias 1976a)
where describes the boundary shape (Figure 1). Changing variables from to , we have , so that a trivial integration over yields the cloud’s mass-to-flux distribution
| (13) | |||||
where we have substituted for from equation (5). Here is the total mass contained within a given (axisymmetric) surface of constant magnetic flux :
| (14) |
Denoting the total flux enclosed in the cloud by , the total mass is then .
The customary procedure for obtaining magnetostatic equilibria is to solve equation (13) for , obtaining
| (15) | |||||
This expression is then used in the right-hand sides of equations (8) and (9). Note that all quantities on the right-hand side of equation (15) are determined iteratively in a numerical scheme, except , which is specified a priori (§1).
As noted in §1, we invert the customary procedure when constructing our initial states. We do not specify a priori within the cloud; instead, the latter is a result of the magnetostatic calculation. Our method is to specify the shape of the cloud boundary . On the boundary, the pressure is a known constant, while the potential, , is obtained through concurrent solution of Poisson’s equation. From the definition of , equation (5), this quantity is therefore determined everywhere within the cloud by
| (16) |
where is known along each flux tube. With successive iterations, estimates of , and improve, until convergence is achieved. (For convergence criteria and other numerical details, see the Appendix.) Henceforth, we refer to this technique as the q-method. We revert to the customary, or free-boundary method when constructing equilibria that have evolved from the initial state.
2.4 Quasi-static Evolution
At typical molecular densities of cm-3, the cloud can remain in equilibrium with a frozen field for roughly yr. Over longer periods, however, self-gravity causes the neutral species to drift inward relative to the ions, which are tied to the magnetic field lines (Mestel & Spitzer 1956). The drift velocity of neutrals with respect to ions, (no subscript indicating neutrals), depends both on the cloud’s level of ionization and on the amount of collisional drag between neutrals and ions. At the low density contrasts characterizing our equilibria, , so that the term normally appearing on the right-hand side of the equation of motion (equation 1) can safely be ignored. We are thus describing the quasi-static phase of evolution (Nakano 1984), during which the cloud slowly progresses along a sequence of exact, magnetostatic equilibria. As the cloud evolves, it becomes more centrally condensed, and gravity becomes relatively more important than magnetic forces near the cloud center. Once the neutral velocities there approach the sound speed, the quasi-static approximation breaks down, and the cloud undergoes essentially hydrodynamic collapse (e.g., Fiedler & Mouschovias 1993). In this paper, we shall follow the quasi-static phase only, while also keeping track of the neutral velocities during the evolution.
The drift speed is given by
| (17) |
where we have chosen the opposite sign convention to Nakano (1979), who gave an equivalent expression for the magnetic field (or ion) drift. Here is the damping time of ions relative to neutrals, is the mass density of the ions, and cm3 g-1 s-1 is the frictional drag coefficient (Nakano 1979). In the second step, we have made use of equations (3) and (7), and have assumed , where g1/2 cm-3/2 (Nakano 1979; Elmegreen 1979). This expression for assumes that ionization from cosmic rays balances recombination. We ignore negatively charged grains, since their effect is small for the typical neutral gas densities we consider in this paper ( cm-3). For a poloidal magnetic field that decreases outward in the cloud, both and are positive, so , indicating inward drift of the neutrals (note that during most of the quasi-static phase). The neutral velocity, , is calculated using the prescription of Lizano & Shu (1989).222Note, however, that Lizano & Shu (1989) used values of and which result in drift velocities 80 percent larger than those found in Tomisaka et al. (1990) and the present paper. Their evolutionary timescales are correspondingly shorter. The qualitative behavior of both and is shown in Figure 2.
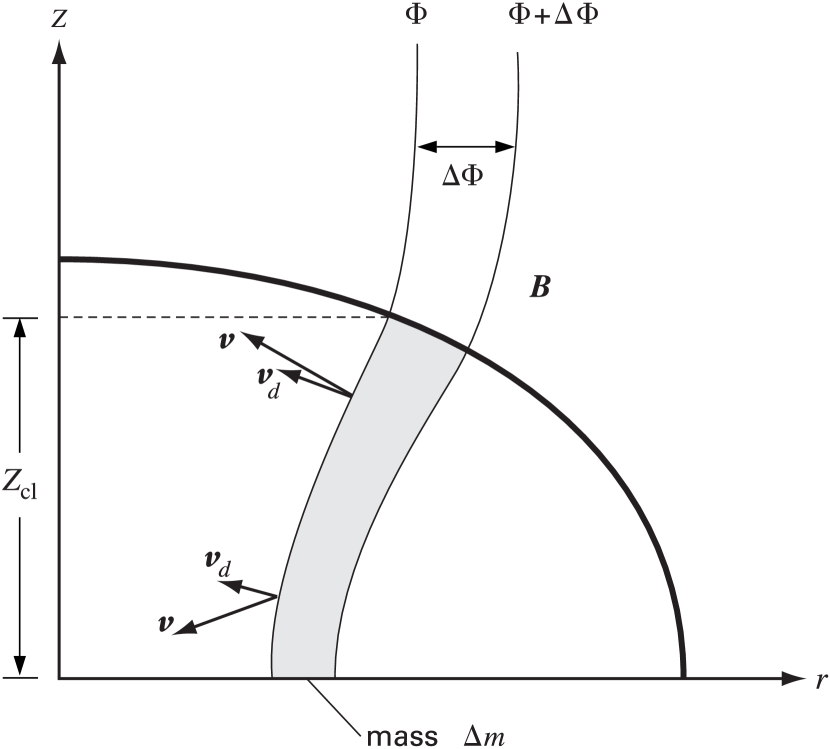
Neutral-ion drift leads to a redistribution of mass with magnetic flux in the cloud. More precisely, the time rate of change of the mass contained within a given (axisymmetric) surface of constant magnetic flux is
| (18) |
where the surface integration is performed along the entire flux tube constant (Figure 2), and where the definition (14) of the mass function has been extended to the quasi-static case, i.e. . Since points outward by definition, generally opposite to the direction of , is usually positive for all . It then follows that is usually a decreasing function of time, i.e., the cloud as a whole loses flux. In the present coordinates, equations (17) and (18) combine to give
| (19) | |||||
The quantity vanishes at both and . At each time step , one may adjust the mass-to-flux distribution as follows:
| (20) | |||||
Given at the next time step, may be calculated from equation (15). Recall that is known from the initial state, constructed via the method (equation 13). During the subsequent evolution the boundary shape is allowed to vary, with the solution at all times obeying the same boundary conditions as in the magnetostatic case. Equation (15) is therefore used to calculate during the quasi-static phase of the calculation, and the new equilibrium is constructed via the free-boundary method. Here, the boundary location is calculated by finding the locus of points where .
2.5 Nondimensionalization and Free Parameters
2.5.1 Magnetostatic equations
We nondimensionalize our equations with respect to the sound speed , cloud boundary density , and background magnetic field . From these, we construct the following dimensionless quantities for the remaining variables:
Observations suggest that the typical cloud core temperature is K (Jijina et al. 1999), while a typical number density outside cores is cm-3 (Nercessian et al. 1988). Using with , one then finds that corresponds to a dimensional length of pc. Similarly, corresponds to , and to yr.
With these definitions, the dimensionless forms of the fundamental equations (8) and (9) are
| (21) | |||||
| (22) | |||||
The dimensionless parameter appearing on the right-hand side of equation (21) is defined in terms of fiducial quantities by
That is, is the ratio of magnetic pressure far from the cloud to gas pressure at the cloud surface.
2.5.2 Quasi-static evolution equations
2.5.3 Free parameters and functions
To construct equilibria under the point-mass boundary condition, we need to specify one parameter, , and one function, the cloud shape, . Measurements of magnetic field strengths in low-mass star-forming regions (mostly upper limits) suggest a mean of roughly 20 G (Crutcher 1999), corresponding to . Given the uncertainty in the field measurements, we have performed calculations for and .
We constructed both spherical clouds and oblate/prolate ellipsoidal clouds with shapes given by
| (26) |
where and are the principal axes of the ellipsoid. In the oblate and prolate cases, the cloud’s axial ratio was fixed at 1/2 and 2, respectively. These figures are in accord with the most likely intrinsic mean value derived from observations (Myers et al. 1991; Ryden 1996). As we describe below in §3, equilibrium sequences were constructed by considering a range of sizes .
Finally, under the periodic boundary condition, we need to specify the additional parameter , the intercore spacing. For the typical spacings in Taurus discussed in §1, i.e. , we have . We adopt the value , corresponding to a dimensional spacing of pc. We also fix the extent of the computational volume in the -direction at .
3 INITIAL STATES
In this section, we present the entire set of equilibria obtained using the method (§2.3). We refer to them as “initial” states, since we shall later be concerned with their quasi-static evolution via ambipolar diffusion.
3.1 Calculation of Equilibrium Sequences
For a given cloud shape and boundary condition (point-mass or periodic), a sequence of states is obtained, each member of which is uniquely specified by its center-to-surface density contrast . (Henceforth, we shall use only nondimensional quantities, omitting the primes, unless otherwise specified.) As increases, and first rise to maximum values, and , respectively. Both quantities then decline. For much larger than covered in this study, and should undergo damped, oscillatory behavior, as found in the sequence of isothermal spheres (Chandrasekhar 1939).
For the low- portion of each sequence, we used the radius as an input parameter for the models. That is, we specified the cloud shape and then used the -method to find both and the internal structure of each model. At this stage, convergence was not overly sensitive to the initial guesses for the gravitational and magnetic fields. In practice, and proved satisfactory initial guesses, where the latter corresponds to a uniform magnetic field set to the background value.
In each sequence, the equatorial and polar radius always peaked well before the cloud mass. This feature is familiar from the sequence of isothermal, nonmagnetic (Bonnor-Ebert) spheres, for which and in our units. In general, one cannot proceed to models with higher than that of by specifying the cloud shape. This is because, along this portion of the sequence, each radius may correspond to more than one value and internal structure. We therefore modified the procedure, with the technique depending on the particular sequence (see below). Proceeding in the appropriate manner to larger , one eventually surpasses the mass peak of the sequence, . Since this peak signifies, at least roughly, the transition to dynamically unstable clouds (§3.4), we halted the search for equilibria soon thereafter.
3.2 Isolated Clouds
3.2.1 Force-Free States
In the absence of a magnetic field and under the point-mass boundary condition, all equilibria are perfect spheres. The entire class of such isolated configurations bounded by a constant surface pressure was found by Ebert (1955) and Bonnor (1956). The addition of a magnetic field satisfying our prescribed boundary conditions (eq. 10) does not change this situation; i.e., each sphere is still an exact, equilibrium state. The reason is that a uniform, parallel field at the background value exerts no internal forces. Thus, isolated, spherical clouds should be magnetically force-free states.
As a first test of the method, we used it to construct the spherical sequence. For , initial guesses of led quickly to convergence. For the higher models beyond the radius peak, we again chose and used the exact, nonmagnetic solutions with higher as initial guesses for . Members of the resulting sequence all contained uniform fields. For example, we found that never differed fractionally from unity (i.e., the background value) by more than . We also checked that the density profile of each configuration matched that of its nonmagnetic, isothermal counterpart having the same central density . Thus, spherical clouds under the point-mass boundary condition are indeed members of the Bonnor-Ebert sequence.
3.2.2 Oblate Equilibria
More general, nonspherical, configurations with shapes given by equation (26) require magnetic support. To offset the weight of the extra mass in the equatorial region, an oblate cloud has a field that rises inward, i.e., for all and . We used the -method to construct a number of states with axial ratio . Our purpose was mainly to compare results with those of previous authors who employed the point-mass boundary condition (Mouschovias 1976a,b; Tomisaka et al. 1988a,b).
Figure 3 shows a representative equilibrium with . As expected, the field lines have a modest inward bending toward the polar axis. The horizontal arrows in the figure represent the drift velocities in this initial state, and show the instantaneous pattern of mass redistribution in the cloud. All of these velocities point inward. The peak drift speed occurs at the cloud equator (i.e., ), where the magnitude of the current also has a maximum.
Figure 3 displays the mass-to-flux distribution as a function of the magnetic flux . Because the density rises substantially toward the center, peaks toward the axis (). We note again that previous authors specified this function ab initio. For example, Tomisaka et al. (1988a) used the from a uniform-density sphere threaded by a constant magnetic field. This also rises inward, but lacks the sharp central peak seen in our model. The resulting cloud is oblate, but more “boxy” in appearance than ours. (See Fig. 2 of Tomisaka et al. 1988a.)
In constructing the entire sequence of oblate equilibria, it is necessary to include states with higher central density than that at the radius peak (§3.1). To find these higher states, we proceeded as follows. Taking a previously converged state with , we first increased by a small, fixed amount at every . This altered was then used in the free-boundary method (§2.3) to converge a new state. The resulting equilibrium, which was only roughly ellipsoidal, had the same total flux as the original cloud, but a slightly larger mass and central density. Now using this state as an initial guess, its was increased again, resulting in a cloud of still higher mass and central density. The exercise was repeated several times, until significantly exceeded that of the last state converged via the method. This high-density, roughly ellipsoidal model then served as an initial guess for the construction, now via the method, of a truly ellipsoidal state lying well past the radius peak. In a typical case, the highest-density guesses constructed in this manner sufficed to converge equilibria that lie not only beyond , but beyond as well.
Figure 4 displays the masses of our oblate clouds as a function of their central density, for -values of 1 and 10. Note that in these and all subsequent equilibrium sequences, the total flux threading the cloud is not fixed a priori, but varies continuously along the sequence. The dotted curve shows, for comparison, the equivalent plot for the spherical, force-free states. It is evident that the mass of any oblate configuration is significantly greater than that of a force-free state with the same central density. For example, the sequence has a peak mass of , attained at . This mass is 1.77 times the corresponding spherical value, which occurs at . Note that while the central density corresponding to the peak mass is certainly smaller than in the spherical case, the broadness of the peak and finite sampling of the numerical calculations prevent an accurate determination of by the present method; our estimate may be in error by as much as 5–10 percent.
The increased mass of oblate configurations has been noted by other authors (beginning with Mouschovias 1976b), and is readily understood. As Figure 3 indicates, the actual bending of the magnetic field is relatively slight in all our models. Hence, force balance in the vertical direction involves mainly gravity and thermal pressure. Suppose now that we envision building up an oblate cloud by adding mass equatorially to an initially spherical configuration. Then , which is largely determined by the weight of the central column, rises only slightly even for significant mass addition. By the same token, it is clear that configurations even more oblate than ours will have correspondingly higher masses at any central density.333Any extra mechanical support beyond thermal pressure will allow higher cloud masses. For the mass increase due to rotation, see Figure 9 of Stahler (1983) and Figure 9 of Kiguchi et al. (1987).
One feature of the oblate models that may appear somewhat surprising is that their masses are insensitive to the background magnetic field strength, as parameterized by . This is again a consequence of the relatively minor role played by the magnetic field in the vertical equilibrium. When the vertical magnetic force is small, the polar radius is set almost entirely by , as can be seen in the top panel of Figure 5. This property, coupled with the fact that the cloud shapes are constrained to be identical, means that two clouds of the same must have nearly identical masses, whatever their values of .
The above results imply that it is the shape of a cloud, not the strength of the magnetic field threading it, that determines the maximum equilibrium mass. However, the degree of field line bending in a particular state does depend on the background field, as well as on the cloud shape. We remarked earlier that the extra equatorial mass in oblate clouds creates an additional gravitational force in the radial direction. In response, the magnetic field bends inward, until the associated tension helps offset this force. The lower panel of Figure 5 quantifies the situation by plotting the central field value as a function of . For , rises substantially, reflecting the increased field line bending in higher-mass clouds. This rise is much less for , where the stronger field resists the equatorial gravity more effectively.
3.2.3 Prolate Equilibria
We next consider clouds that are prolate ellipsoids, with their long axes parallel to the background magnetic field. Imagine creating such an object by shaving off equatorial mass from an initially spherical configuration. By our previous reasoning, this change would only marginally affect the central density. Thus, a prolate cloud is less massive than a spherical one with the same . In addition, the pressure gradient is higher in the radial direction than along the pole. Since the equatorial gravity is now insufficient to offset this extra force, the magnetic field bends outward, creating inward tension. The central field is reduced from the background value, and is positive. In this sense, isolated, prolate clouds are magnetically confined.
Using the -method, we constructed sequences of prolate clouds with axial ratio . A representative state from the sequence is shown in Figure 6. The outward bowing of the field lines is evident, and is particularly strong near the center. Here the field attains its minimum value, less than 10 percent of the background. The figure also shows the drift velocities associated with ambipolar diffusion. These now point outward, reflecting the new field curvature. The maximum drift speed, here equal to 0.3, occurs at the cloud equator. We were not able to obtain equilibria with lower values of , most likely due to the very large gradient of at the origin as approaches zero. Note that, because is a significant fraction of the sound speed in these low- states, our basic assumption of quasi-static equilibrium begins to fail. We shall revisit this issue in §4, when we attempt to follow explicitly the temporal evolution of prolate configurations.
Figure 6 shows the mass-to-flux distribution in the cloud discussed above. Comparing with the analogous Figure 3 for an oblate state, we see first that the maximum flux is considerably smaller. This reduction is a consequence of the prolate cloud’s smaller cross section in the equatorial plane. We also see that climbs much more steeply toward the central axis, a result of both the increased column of gas near the pole and the reduced flux in that region.
We display the cloud mass as a function of for the and sequences in Figure 7. As in the oblate case, the curves are rather insensitive to . However, the deficit in equatorial mass now implies that is significantly less than the force-free value at every . Specifically, the mass is always below the Bonnor-Ebert value. The curve has the usual broad peak, now centered at . This mass is 0.72 times the corresponding maximum in the spherical sequence. For , however, the central field becomes so small that we were unable to construct models for beyond 15.5. Prolate clouds thus have a maximum mass set by the background field strength, if the latter is sufficiently low.
The top panel in Figure 8 shows the polar radii of all our configurations, again as a function of . The insensitivity with respect to is apparent, and demonstrates once more the minor role of the magnetic field in vertical force balance. The polar radii are now uniformly greater than their force-free counterparts. Finally, the bottom panel of Figure 8 shows in detail how the central field diminishes as the field lines bow outward. This curvature, and hence the drop in , is relatively small for . On the other hand, rapidly falls to zero in the case, where the curvature is much more pronounced.
3.3 Tidally Stressed Clouds
3.3.1 Force-Free States
Under the periodic boundary condition, magnetically force-free configurations are no longer spherical. Our stipulation that vanish at accounts for the gravitational influence of external masses located above and below the cloud of interest. Their tidal force distorts the cloud vertically, i.e., in the direction of the uniform magnetic field. The resulting equilibria are mildly prolate, although not perfectly ellipsoidal. At fixed and (the dimensions of the bounding cylindrical surface), there is a unique sequence parametrized again by . The cloud axial ratio now varies along this sequence.
Figure 9 shows isodensity contours for three equilibria in a representative sequence. Here, we have chosen and , following the discussion of §2.5.3. The clouds are nearly spherical at low , as shown in the first panel. They become maximally distorted when the cloud’s polar axis peaks. The central panel of Figure 9 shows this pivotal configuration, at which has reached 2.39, , and . At higher central density, the polar axis shrinks and the cloud becomes more spherical again. The third panel is an example of such a high-density state.
If we view the cloud as one in a periodic chain, then the value of represents half of the intercloud spacing. It is hardly surprising, then, that the character of our force-free sequences is sensitive to . The choice , as we have seen, results in a sequence for which the maximum is close to itself. For larger , the clouds are less tidally distorted. For and sufficiently large , the upper and lower boundaries of the cloud penetrate the cylindrical boundary, i.e., the individual clouds in the chain partially coalesce. Note that our results are much less sensitive to the value of , at least beyond some minimum. For the case, for example, we found that raising to 20 had a negligible effect on our models. Interestingly, the masses of the clouds in the force-free, tidal sequence do not differ significantly from their counterparts of the same central density in the Bonnor-Ebert sequence; the agreement is better than 1 percent throughout the range of examined.
3.3.2 Spherical Equilibria
The properties of tidally stressed clouds of various shapes may be deduced from their relation to the force-free states. Thus, consider a true prolate ellipsoid with a higher aspect ratio than the mildly elongated, force-free state of the same . The ellipsoidal configuration experiences less gravitational force toward its axis, and so has an internal magnetic field that bows outward. Its structure will be qualitatively similar to that of the prolate clouds studied in §3.2.3. By analogy, a highly oblate cloud has field lines that bow inward, again like its isolated counterpart.
An interesting difference arises, however, when we study spherical clouds. These are no longer force-free. In fact, their aspect ratio is less than that of the corresponding force-free states. Their field lines thus bend inward, and . During ambipolar diffusion, the drift velocities point toward the symmetry axis, leading to states of higher central density. We are thus motivated to study these objects further. Historically, various authors have considered spherical, magnetized clouds as a convenient idealization (Mestel 1965; Strittmatter 1966). However, these studies ignored the detailed field topology, as did the more recent evolutionary calculations of Safier, McKee, & Stahler (1996) and Li (1998).
To construct the spherical sequence we again utilized the -method, now with the tidal boundary condition, equation (12). As always, the procedure was straightforward up to the radius peak. In converging states beyond this point, we used Bonnor-Ebert solutions of similar to supply an initial guess for . We guessed by first constructing a slightly oblate cloud of nearly the same , under the same tidal boundary condition. Such a state has an inwardly bent magnetic field, similar to the tidally stressed sphere of interest. As we moved to higher- spherical states, the amount of field-line bending increased. Hence, we needed to use progressively more oblate clouds to supply the guess for .
Figure 10 shows the isodensity contours and field lines for a cloud from the sequence. The degree of field line bending and enhancement of are only slight for this relatively high -value. As expected, the drift velocities point inward, with the largest velocity occurring at the equator. Both the field topology and pattern of drift speeds resemble those for the isolated, oblate cloud of Figure 3, which has nearly the same central density. The mass-to-flux distribution in the sphere, shown in Figure 10, is also qualitatively similar.
Figure 11 displays the mass of our spherical clouds as a function of central density, for and 10. The outer cylindrical boundary was again held fixed at . The force-free sequence is represented by the dotted curve. For a given , the magnetically supported states are evidently more massive than both force-free, tidally stressed clouds and Bonnor-Ebert spheres. In the first case, the greater mass is a consequence of the objects’ larger equatorial extent, while the tidal boundary condition is responsible in the second. More specifically, the vanishing potential gradient at effectively weakens self-gravity everywhere, so that a higher equilibrium mass is required at a given than for the point-mass boundary condition. The maximum mass of 60.1 in the tidally stressed, spherical sequence exceeds the force-free and Bonnor-Ebert values by 13 percent. Note finally that the mass in our sequence peaks earlier () than in either the force-free () or Bonnor-Ebert () case.
The top panel of Figure 12 shows the variation in radius along the sequence. Notice that the radii are intermediate between the force-free polar and equatorial values, shown by the dashed and dotted curve, respectively. The radius curve for the sequence is nearly identical to the result, and so is not displayed. Both curves lie slightly above the radii of Bonnor-Ebert spheres (compare Figure 5). In the lower panel of the figure, we display the variation in the central magnetic field value. The two sequences are now clearly distinguishable, with the curve having greater field bending and thus a higher .
3.4 Remarks on Dynamical Stability
Figures 4, 7, and 11 all show the cloud mass reaching a maximum value and then declining as increases. Such behavior is well known in other contexts, where the mass extrema demarcate a stability transition within the fundamental mode of oscillation, and thus the onset of dynamical instability (Tassoul 1978). In addition to its stellar applications, this “static method” for diagnosing instability has also been used for rotating clouds (Stahler 1983; Kiguchi et al. 1987).
The situation is more subtle for magnetostatic configurations. The physical basis of the static method is that two equal-mass equilibria on either side of an extremum may be considered endstates in a normal mode of zero frequency. For this interpretation to hold, however, the two configurations must have identical distributions of all quantities that are conserved during such an oscillation. For example, two rotating, axymmetric states must have the same variation of specific angular momentum, since the oscillation exerts no internal torques.
In the case of magnetized clouds, we may assume that flux freezing holds during the dynamical oscillation (even one of zero frequency). Thus, application of the static method requires that the mass-to-flux distribution not change along the sequence. This is the case for magnetostatic models constructed via the free-boundary method, i.e., with a specified functional form of (§2.3). In our models, on the other hand, varies continuously along the sequence, so the static method is not applicable. While clouds of sufficiently high central density are certainly unstable, the actual transition must be displaced somewhat from the extremum.
Another consideration comes into play for the prolate states. We have stressed that these equilibria, especially those of low and high , are magnetically confined, with the field bowing outward in the central region (recall Fig. 6). In laboratory plasmas, such a field curvature tends to be dynamically unstable. If one interchanges two adjacent flux tubes, the energy of the system decreases. (For an elementary demonstration, see Section 8.3 of Nicholson 1983.) A normal mode analysis shows that the unstable perturbations have short wavelengths perpendicular to the magnetic field, and long wavelengths parallel to it (Freidberg 1987, p. 267). Self-gravity, neglected in the plasma context, should not materially affect the properties of such a mode.
4 TIME EVOLUTION
The presence of a non-zero drift velocity in the states constructed in the previous section indicates that they will evolve in time via ambipolar diffusion. Thus we next consider the quasi-static evolution of these clouds, as outlined in §2.4. We chose as initial configurations the oblate, prolate, and spherical clouds depicted in Figs. 3, 6, and 10, respectively. The calculations in this stage employed the free-boundary method, rather than the method (§2.3 and 2.4). As soon as the cloud was allowed to evolve, its shape immediately began to depart from a perfect ellipsoid. In those cases where the central concentration increased with time, the calculation terminated when the large density gradient near the cloud center made convergence difficult on our uniformly spaced grid. This typically occurred when the maximum neutral velocity was 0.2–0.5 times the sound speed. Hence the termination roughly coincided with the breakdown of the quasi-static approximation and the beginning of dynamical collapse.
4.1 Oblate Initial States
We begin with the oblate cloud shown in Figure 3, which has an axial ratio of . By use of the evolution equation (24), this state was evolved in time steps of magnitude , until the central density reached 115, at . Beyond this point, we could find no more equilibria. We determined the endpoint accurately by reducing the time step to after . The final time corresponds to 6.2 Myr, using the fiducial parameter values of Section 2.5.1.
Figure 13 shows the cloud at the final converged time, . Note the pronounced dip in the cloud boundary near the pole, a feature seen in previous oblate, magnetized models (see, e.g., Figure 1 of Tomisaka et al. 1990). This is a result of the increasing self-gravity in the central region, where gravity is unopposed by magnetic forces along the field lines. The neutral velocity increases toward the center, and the vectors become more radial. The maximum value of is 0.45, and occurs near the midplane at .
The increase of the cloud’s central density and mass-to-flux ratio with time is shown in Figure 14. As matter drifts into the central region, rises steadily, increasing by 73 percent in the course of the evolution. Simultaneously, the central field lines squeeze together, causing the value of to more than double by . Since the total flux decreases, the global distribution of is becoming both narrower and more sharply peaked. The rapid increase of , along with the large value of near the center, both indicate that the quasi-static stage of evolution is ending.
Finally, consider the evolution of the density profiles. At all times, the profiles exhibit a turnover, leading to an envelope with nearly power-law density. The radius of this turnover, i.e., of the inner core region, shrinks with time, while the profile in the envelope steepens. Both results are in accord with earlier studies (e.g., Mouschovias 1991).
4.2 Prolate Initial States
The unique feature of prolate structures is that they are magnetically confined. That is, the field lines bow outward from the central axis, creating the tension needed to oppose the larger pressure gradient in the radial direction. Since the drift velocities also point outward, we expect the evolution through ambipolar diffusion to differ qualitatively from the oblate case.
We attempted to evolve the prolate initial state with shown in Figure 6, but did not succeed. As discussed in §3.2.3, this state possesses a steep gradient of at the origin, which makes convergence difficult using the free-boundary method. Since this gradient is not as extreme for larger values of , we followed instead the evolution of a 2:1 prolate cloud with . Figure 15 shows the results. The upper left panel displays the initial state. At early times, the outward neutral velocity causes the equatorial region to expand. By the time (2.8 Myr with our fiducial parameters), the central density has dropped to 11.2 and the maximum neutral velocity has decreased to less than half its initial value (see Fig. 15). During the same interval, the magnetic field has begun to straighten; its central value has increased slightly from 0.89 to 0.90.
By the next time displayed in Figure 15, (11 Myr), the equator has moved out still further, while the pole has shrunk noticeably from its initial position. The cloud is clearly becoming less prolate, and now has an axial ratio of . The trends noted above in , and continue. Because the field is straightening, ambipolar diffusion begins to slow down. By (28 Myr; Fig. 15), where we stopped the calculation, the cloud is approaching a spherical shape (), albeit slowly, since the maximum neutral velocity is only 0.5 percent of the sound speed. The central density has decreased to one-quarter of its starting value, so that the density profile is now much flatter than the initial one (see below). Over most of the cloud, the neutral velocities are oriented perpendicular to the field lines, and still point outward. Taken together, these developments indicate that the configuration will never reach the point of dynamical collapse.
Instead, our calculation suggests that the endstate of a prolate, magnetized cloud is a sphere threaded by a uniform magnetic field. Since a uniform field exerts no forces, the sphere would be indistinguishable from a non-magnetic, pressure-bounded configuration of the same mass as the initial prolate cloud. To test this idea, we constructed a sphere having the same central density () as the prolate final state. The corresponding mass of this non-magnetic state is (in our units) , which is only 5 percent larger than that of the state shown in Figure 15. Given that the axial ratio of this “final” prolate state is still 7 percent greater than unity, this difference is understandable. Finally, we compare the mean of the equatorial and polar radii, , with the radius of an equilibrium sphere of the same . We find that the two quantities differ by only 2 percent.
The evolution of the prolate cloud’s central density and mass-to-flux ratio are shown in Figure 16. The central density decreases smoothly from its initial value, asymptotically approaching the spherical, force-free value of at large . The central mass-to-flux ratio also decreases steadily with time. Once the final state is reached, has decreased to one-third of its original value. Comparison of Figures 14 and 16 shows how the oblate and prolate clouds evolve in essentially opposite directions. Figure 17 displays the equatorial and polar density profiles of the initial, prolate state, and the same profiles in the final configuration. We also show the profile of a non-magnetic sphere with a central density of 3.8. In contrast to the oblate case, the core region expands with time, with the envelope gradient becoming significantly shallower by .
4.3 Spherical Initial States
An isolated spherical cloud, i.e., one in which the gravitational potential obeys the point-mass boundary condition, is actually a member of the Bonnor-Ebert sequence (§3.2.1). Since the internal magnetic field is uniform and force-free, the drift velocity should be identically zero, and the cloud should not evolve under ambipolar diffusion. We checked that this was the case. Thus, a cloud with an initial of 14.0 increased its central density by only 2 percent over a period of 10 Myr. Its central magnetic field changed by 0.3 percent during this time, remaining very close to unity, while the maximum neutral velocity never exceeded 0.012. Finally, the equatorial and polar radii never differed from the Bonnor-Ebert value by more than 2 percent.
The more interesting case is a spherical cloud constructed with the tidal boundary condition. Here, the magnetic field bows inward, leading to drift velocities that point toward the central axis. Starting with the configuration shown in Figure 10, we found that the central density rose monotonically. We were able to follow the evolution until t = 20.15, corresponding to 11.2 Myr in our fiducial units. By this time, had increased from its initial value of 11.7 to 111. Note that a comparable rise in for the isolated, oblate cloud took about half the time, as the drift velocities were roughly twice as large.
Imposition of the tidal boundary condition effectively weakens the gravitational force in the vertical direction. Nevertheless, the climb in central density causes the polar region to compress, just as in the isolated, oblate case. The pronounced polar dip may be seen in Figure 18, which shows the density contours and magnetic field lines at t = 20.15. The pattern of drift velocities is also similar to the oblate case.
Figure 19 displays the evolution of the cloud’s central density and mass-to-flux distribution. By the time the final state has been reached, has increased by almost an order of magnitude, has nearly doubled, and the central mass-to-flux value has increased by 74 percent. Once again, is undergoing a very sharp increase, a sign that the dynamical phase of evolution is close at hand. The largest neutral speed, which occurs near the cloud center at , has the value 0.16. The density profiles of the evolving configuration exhibit the same qualitative features as in the oblate cloud evolution, i.e., a shrinking core region and a steepening envelope gradient.
5 DISCUSSION
In this paper, we have taken the novel approach of specifying the cloud shape, rather than the mass-to-flux distribution, in order to construct equilibrium models. One of our significant findings is that these structures can be either oblate or prolate. Furthermore, we did not encounter, in our admittedly limited parameter survey, any restrictions on the aspect ratio in either case. This result contrasts sharply with the traditional view, inherited from Mouschovias (1976b), that magnetostatic equilibria are necessarily flattened along the direction of the ambient field. We now see that this conclusion arose from the method of constructing models. Specifically, mass-to-flux distributions that plateau toward the cloud center yield flattened equilibria, while more centrally-peaked distributions result in elongated clouds.444 Both our models and all previous ones assume that the cloud is axisymmetric about the background field direction. Ward-Thompson et al. (2000) have recently published the first observations of magnetic fields in starless dense cores, using submillimeter polarimetry. In their three examples, the projected field direction appears to be at an oblique angle with respect to the cores’ long axes. This result, if confirmed by future studies, may indicate that the assumption of axisymmetry requires modification (Basu 2000).
We are not the first, however, to construct elongated equilibria. Tomisaka (1991) added a toroidal field component to the purely poloidal models of Tomisaka et al. (1988a,b), and thereby obtained moderately prolate configurations. In these models, the toroidal field exerts a radial pinch that aids gravity in squeezing gas toward the central axis. Fiege & Pudritz (2000) have recently explored a large number of such models. Their clouds, which span a wide range of aspect ratios, are all of low mass and density contrast (, where is the maximum mass of the force-free spherical sequence). Interestingly, a subset of their equilibria exhibit bowed-out field lines similar to those in our own prolate models (see, e.g., their Figures 2 and 7). In their case, however, the bowing is most pronounced near the cloud boundary, and only occurs when the toroidal field strength is comparable to, or exceeds, the poloidal one. Because these twisted-field solutions have a non-zero toroidal component at infinity, the elongation of the clouds depends in part on the magnetic field configuration throughout the larger, parent body. In our solutions, the prolate shape arises solely from the local mass-to-flux distribution.
Our second major result is that the fate of a cloud under ambipolar diffusion is determined both by its density contrast and by its shape. Figure 20 summarizes this finding for the case of isolated clouds. Here we have reproduced, from Figures 4 and 7, the mass curves for oblate, prolate, and spherical (force-free) configurations, where the first two have . The three open circles represent initial states whose evolution we followed numerically.
Consider first the two oblate configurations. The initial state of higher density contrast has a mass larger than (). Since its field lines bend inward, the cloud’s central density increases as it evolves, and the representative point moves toward the right. Note that the contraction rate for this cloud is much slower than for the example in §4.1, which was at the mass peak of the oblate sequence. Initially, the equatorial region shrinks rapidly enough that the aspect ratio actually increases, from 0.50 at to 0.74 at . Eventually, however, the polar dip becomes so pronounced that falls, reaching 0.55 at our last computed model (). At this time, the central density is and is climbing rapidly. Thus, all oblate equilibria ultimately flatten before they collapse.
By contrast, the initially oblate cloud of lower density contrast shown in Figure 20 has a mass below (). Although still increases with time, the configuration does not collapse, but reaches the force-free, spherical state marked by the filled circle. By , the central density is 3.58, within 25 percent of the predicted final value of 4.80, and the aspect ratio is , very close to 1. Thus the cloud becomes less oblate and more spherical, while the field lines straighten out.
Finally, we turn to the prolate sequence, also shown in Figure 20. Since the mass curve now lies wholly below the spherical one, no initial state will lead to dynamical collapse. The example shown by an open circle corresponds exactly to the state discussed previously in §4.2. There it was demonstrated that the central density falls as the configuration becomes more spherical, and that the cloud does not collapse. To summarize, all states move toward the force-free curve in the diagram, but only those with can actually reach the curve and so avoid collapse. An analogous situation holds for our spherical, tidally stressed equilibria. Referring again to Figure 11, we see that the initial state with lies above the force-free curve, and so inevitably collapses.
Our third, and last, major result is that none of our initial equilibria, whether isolated or tidally stressed, evolves in a manner consistent with observed, star-forming clouds. As we reviewed in Section 1, the radio maps of dense cores are best explained as an ensemble of elongated, three-dimensional objects projected onto the plane of the sky. There is no appreciable difference between the shapes of cores with or without internal stars (Jijina et al. 1999). Thus, a correct theoretical account should start with an elongated configuration and have it remain elongated through the onset of dynamical collapse.
The fault may lie in our neglect of external matter. In this study, we have
followed the conventional route of surrounding the cloud by a fictitious,
zero-density medium of finite pressure. Real dense cores, however, are embedded
within larger filamentary structures. This fact alone hints why the initial
states are elongated. During ambipolar diffusion, matter from the external
reservoir can flow down magnetic field lines, piling up until it is halted
by the internal pressure gradient. Thus, the polar flattening we obtained
may be alleviated or even avoided entirely. It will be interesting to see how
cloud evolution proceeds under these very different conditions.
The authors would like to thank Jason Fiege, Chris McKee, and Steve
Shore for useful
discussions. This research is supported in part by a NASA grant to
the Center for Star Formation Studies. The research of CC was
supported in part by an NSERC Postdoctoral Fellowship, while that of
SS was funded by NSF Grant AST-9987266.
Appendix A APPENDIX: NUMERICAL TECHNIQUES
To implement the method, equations (21) and (22) were solved simultaneously on a uniform grid covering the upper right quadrant of the large cylinder; i.e., . We begin with an initial guess , and a fixed cloud boundary . The function is then given by equation (16), which we rewrite as
| (A1) |
with the superscript indicating the zeroth iteration. Recall that the subscript zero on and denotes their boundary values. As mentioned in Section 2, the specification of is sufficient to calculate the right-hand side source terms of equations (21) and (22). At each subsequent iteration, solutions for and subject to the boundary conditions (10) and (11) (point-mass) or (12) (tidal) were obtained to within an accuracy of . These were used as provisional iterates in generating subsequent guesses, as explained below. At each step, the updated was then used in equation (A1) to generate a new .
The number of grid points in the radial and vertical directions, and , for the different cloud shapes adopted in Section 3 were:
Oblate:
Prolate:
Spherical:
The number of field lines, , was chosen equal to . To ensure accurate derivatives near the cloud center, the flux value of the field line was chosen as . In practice, it was necessary to switch back and forth between two interwoven meshes: one fixed spatially , and another, defined by the current field line positions (Mouschovias 1976).
The sequence of iterates was chosen according to the scheme:
where and are constant relaxation parameters, taken to be between 0.5 and 1 in most of our calculations. A solution was deemed acceptable if the conditions
| (A2) |
were satisfied simultaneously, with .
We typically found solutions within 50 iterations or less, using an initial guess . We checked that the solutions were relatively insensitive to: (i) increasing the number of grid points in either direction; (ii) increasing the values of and ; and (iii) allowing the program to continue for up to twice the number of iterations required to satisfy conditions (A2). None of these resulted in a change of more than 5 percent in or at any grid point, or of more than 8 percent in the central density.
The numerical implementation of the free-boundary method was discussed by Mouschovias (1976). In applying the method, we imposed an additional convergence criterion on the location of the cloud boundary:
| (A3) |
where . Thus, at each timestep, convergence was achieved when conditions (A2) and (A3) were simultaneously satisfied.
In order to evolve the cloud over the hundreds of timesteps typical of our calculations in Section 4, it was essential that the mass-to-flux distribution given by equation (20) remain smooth throughout the evolution. To ensure this was the case, we approximated the function at each timestep by a least-squares polynomial. Thus, was also a polynomial, lending an additional degree of smoothness to equations (19) and (20).
References
- (1) Basu, S. 2000, ApJ, 540, L103
- (2) Benson, P.J., & Myers, P.C. 1989, ApJS, 71, 89
- (3) Bonnor, W.B. 1956, MNRAS, 116, 350
- (4) Chandrasekhar, S. 1939, An Introduction to the Study of Stellar Structure (New York: Dover)
- (5) Crutcher, R.M. 1999, ApJ, 520, 706
- (6) Dungey, J. 1953, MNRAS, 113, 180
- (7) Ebert, R. 1955, ZAp, 37, 216
- (8) Elmegreen, B.G. 1979, ApJ, 232, 729
- (9) Fiedler, R.A., & Mouschovias, T.Ch. 1992, ApJ, 391, 199
- (10) Fiedler, R.A., & Mouschovias, T.Ch. 1993, ApJ, 415, 680
- (11) Fiege, J.D., & Pudritz, R.E. 2000, ApJ, 534, 291
- (12) Freidberg, J.P. 1987, Ideal Magnetohydrodynamics (New York: Plenum)
- (13) Harju, J., Walmsley, C.M., & Wouterloot, J.G.A. 1993, A&AS, 98, 51
- (14) Jijina, J., Myers, P.C., & Adams, F.C. 1999, ApJS, 125, 161
- (15) Kiguchi, M., Narita, S., Miyama, S.M., & Hayashi, C. 1987, ApJ, 317, 830
- (16) Li, Z.-Y. 1998, ApJ, 493, 230
- (17) Lizano, S., & Shu, F.H. 1989, ApJ, 342, 834
- (18) McKee, C.F., Zweibel, E.G., Goodman, A.A., & Heiles, C. 1993, in Protostars and Planets III, ed. E.H. Levy & J.I. Lunine (Tucson: University of Arizona Press), 327
- (19) Mestel, L. 1965, QJRAS, 6, 265
- (20) Mestel, L., & Spitzer, L. 1956, MNRAS, 116, 503
- (21) Mouschovias, T.Ch. 1976, ApJ, 206, 753
- (22) Mouschovias, T.Ch. 1976, ApJ, 207, 141
- (23) Mouschovias, T.Ch. 1991, in The Physics of Star Formation and Early Stellar Evolution, ed. C.J. Lada & N.D. Kylafis (Dordrecht: Kluwer), 449
- (24) Myers, P.C. 1999, in The Origin of Stars and Planetary Systems, ed. C.J. Lada & N.D. Kylafis (Dordrecht: Kluwer), 67
- (25) Myers, P.C., & Benson, P.J. 1983, ApJ, 266, 309
- (26) Myers, P.C., & Goodman, A.A. 1988, ApJ, 326, L27
- (27) Myers, P.C., Fuller, G.A., Goodman, A.A., & Benson, P.J. 1991, ApJ, 376, 561
- (28) Nakano, T. 1979, PASJ, 31, 697
- (29) Nakano, T. 1984, Fund. Cosm. Phys. 9, 139
- (30) Nercessian, E., Castets, A., Benayoun, J.J., Cernicharo, J. 1988, A&A, 189, 207
- (31) Nicholson, D.R. 1983, Introduction to Plasma Theory (New York: Wiley)
- (32) Onishi T., et al. 1996, ApJ 465, 815
- (33) Ryden, B.S. 1996, ApJ 471, 822
- (34) Safier, P., McKee, C.F., & Stahler, S. 1997, ApJ, 485, 660
- (35) Stahler, S.W. 1983, ApJ, 268, 165
- (36) Strittmatter, P.A. 1966, MNRAS, 132, 359
- (37) Tassoul, J.-L. 1978, Theory of Rotating Stars (Princeton: Princeton University Press)
- (38) Tomisaka, K. 1991, ApJ, 376, 190
- (39) Tomisaka K., Ikeuchi, S., & Nakamura, T. 1988, ApJ 326, 208
- (40) Tomisaka, K., Ikeuchi, S., & Nakamura, T. 1988, ApJ, 335, 239
- (41) Tomisaka, K., Ikeuchi, S., & Nakamura, T. 1990, ApJ, 362, 202
- (42) Ward-Thompson, D., Kirk, J.M., Crutcher, R.M., Greaves, J.S., Holland, W.S., & André, P. 2000, ApJ, 537, L135