Mushroom-Shaped Structures as Tracers of Buoyant Flow in the Galactic Disk
Abstract
Recent Hi emission observations of the Southern Galactic hemisphere have revealed a mushroom-like structure extending from to pc, composed of a stem and a cap. Similar structures occur in three-dimensional simulations of a dynamic galactic disk driven by isolated and clustered supernovae. Using these simulations, we show that hot gas in the Galactic disk that is not evacuated through chimneys expands into the cooler gas of the thick disk, forming mushroom-shaped structures. This new class of objects traces buoyant flow of hot gas into the thick disk.
1 Introduction
Hi emission maps from the Canadian Galactic Plane Survey (Taylor 1999, Higgs 1999) reveal a structure resembling a mushroom, with a stem and a fragmenting cap (English et al. 2000). Assuming a distance of 3.8 kpc, the stem has a length of pc and the cap has a width of pc. The top of the cap lies pc below the Galactic plane. This feature covers a total velocity width of km s-1, with the cap redshifted from the stem by km s-1. English et al. (2000) estimate that the Mushroom has a kinetic energy of ergs and an Hi mass of at least . The column density contrast between the Mushroom and the ambient medium is no more than five, with the Mushroom having N cm-2.
Mashchenko et al. (1999) and English et al. (2000) used thin-shell and two-dimensional hydrodynamical simulations to study the origin and dynamics of the Mushroom. They modelled stellar winds and supernovae (SNe) in a smooth, stratified background atmosphere, and concluded that the observational data is consistent with a single off-plane SN having a total energy of at least erg s-1. In their model, the hot gas produced by the single supernova remnant (SNR) expanded buoyantly into a smooth gas disk.
In this Letter, we use the global models of Avillez (2000) to show that such mushroom-shaped structures can result from the buoyant rise of bubbles out of pools of hot disk gas created from both isolated SNRs and mergers of isolated SNRs.
2 Supernova-Driven ISM Modelling
2.1 Simulations
Large-scale modelling of the interstellar gas in the disk and halo has been carried out by Avillez (2000) with a three-dimensional hydrodynamical code that uses adaptive mesh refinement (AMR). The scheme uses the piecewise parabolic method (PPM) of Collela and Woodward (1984) in combination with the AMR scheme of Berger & Colella (1989), combined with the subgridding scheme of Bell et al. (1994).
The model includes a fixed gravitational field provided by the stars in the disk, and an ideal-gas equation of state. Radiative cooling is treated assuming collisional ionization equilibrium, using a cooling function following Kahn (1976) for K, Dorfi (1997) for K, and a fit to the curves of Shapiro & Moore (1976) for the remaining temperatures. Thermal conduction is not included due to the numerical complexity and the lack of strong observational evidence for its strength in the ISM (e.g. Mac Low 1999). Its inclusion may well change our quantitative results, but we believe that our qualitative results on the behavior of hot gas in the ISM will continue to hold.
The computational domain contains a section of the Galaxy with an area of 1 kpc2 and vertical extension from -10 to 10 kpc. The innermost edge lies 8.5 kpc from the Galactic centre. The computational grid has a resolution of 10 pc, except in the layer between -250 and 250 pc, where three levels of AMR are used, yielding a finest resolution of 1.25 pc.
Type Ib, Ic, and II SNe are set up at the beginning of their Sedov phases, with radii determined by their progenitor masses, at a rate compatible with observations (Capellaro et al. 1997), normalized to the volume under study. Sixty percent of the SNe are set up within associations (Cowie et al. 1979), and the rest are set up at random sites.
2.2 Global Evolution of the ISM
The disk and halo gas is initially smoothly distributed in hydrostatic equilibrium with the gravitational field, with scale heights given by Dickey & Lockman (1990) and Reynolds (1987). SNe start occurring at time zero, and the system is evolved for up to 1 Gyr. After the first 200 Myr, the system reaches a statistically steady state that shows a dynamic equilibrium between upward and downward flowing gas.
Once disrupted by the SN explosions, the disk never returns to its initial state. Instead, regardless of the initial vertical distribution of the disk gas, a thin disk of cold gas forms in the Galactic plane, and, above and below, a thick inhomogeneous gas disk forms. The code does not explicitly follow ionization states, but we can trace gas with temperature K and scale height of 180 pc, which we designate Hi, and gas with K and scale height of 1 kpc, which we designate Hii. These distributions reproduce those described in Dickey & Lockman (1990) and Reynolds (1987), respectively. The upper parts of the thick Hii disk form the disk-halo interface, where a large scale fountain is set up by hot ionized gas escaping in a turbulent convective flow.
The thick gas disk is punctured by chimneys that result from superbubbles occurring above the plane of the thin disk at pc. As they grow, they elongate along the -direction, owing to the local stratification of the ISM. Chimneys in the simulation typically have widths of approximately 120 pc. They inject high temperature gas directly from the Galactic disk into the halo, breaking through the warm neutral and ionized layers that compose the thick disk. This hot gas then contributes to the Galactic fountain.
3 Buoyant Outflow From the Galactic Plane
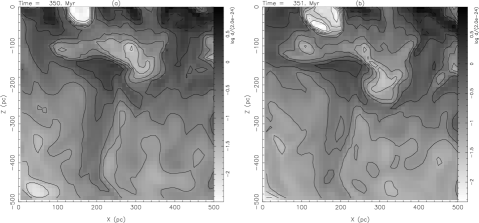
About forty percent of the hot gas generated in the disk does not flow through chimneys. This gas still has too much energy to be held gravitationally to the stellar disk though, so it expands buoyantly into the thick gas disk, accelerating through the cooler gas in the thin disk, with characteristic velocities of some 10 km s-1. As the hot gas rises, it entrains surrounding material to form a stem, often narrow, whose width does not depend on the scale height, as shown in Figure 1. The resulting structure resembles a mushroom composed of a cap and a stem. The cap drives the motion of the mushroom. During the first million years of evolution the mushroom consists of a rising low density cavity. The ascending gas comes from single SNRs as well as from pools of hot gas formed in the disk by isolated SNRs that merged together. On average, the hot gas produced by isolated SNe flows upward at a rate integrated over the disk of per year on each side of the Galactic plane, as measured at pc (Avillez 2000).
As the mushroom comes to equilibrium with the surrounding medium and cools down, there is a reversal in the column density contrast between the mushroom and the surrounding medium, with the mushroom cap sometimes going from a negative to a positive contrast. However, the positive column density enhancement is rather modest, making it very difficult to observationally identify mushrooms.
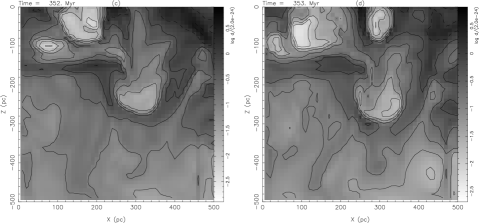
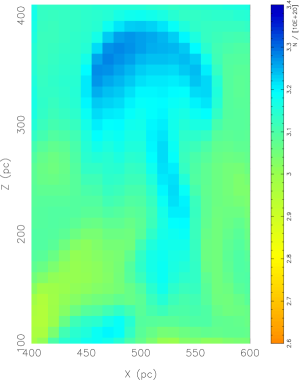
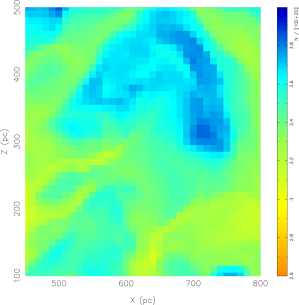
Figures 2 and 3 show two mushrooms that developed at different points in the simulation. Both structures cooled to ambient temperatures and have column density enhancements. On average the ambient column density is cm-2, while that of the mushrooms is cm-2. The caps have the largest column density enhancement (the bluish regions inside the caps), while the stems of the two mushrooms have lower column densities lower than their caps (light bluish regions in the stems). The mushroom in Figure 2 was created by a single SN, while the larger one in Figure 3 was created by three SNe.
We can roughly measure the mass ratio of the cap to stem of a mushroom by estimating the area and average column density of each, and taking the mass . The mushroom shown in Figure 2 has a cap with pc2 and cm-2; measuring the stem similarly yields a mass ratio , and a total mass of . The mushroom in Figure 3 has a mass ratio of 4.4 and a total mass of .
The observations of English et al. (2000) show the Mushroom to have a mass of and a mass ratio of three (while a classical superbubble would have a ratio of ). These observations are in rough agreement with the mushroom we show in Figure 3, suggesting that the Mushroom has been created by 3–4 SNRs. The greatest column density contrast between the mushrooms shown in Figures 2 and 3 and the ambient medium varies between 1.1 and 1.25, while English et al. (2000) detected a contrast of roughly two over the velocity range of the observed structure.
4 Discussion and Comparison with Observations
The simulations show that the disk gas is populated with strucures resembling mushrooms, resulting from hot gas buoyantly convecting through the thick gas disk. The dynamics of these structures resemble the expansion of nuclear fireballs in the Earth’s atmosphere. On the Earth, as the fireball passes through the tropopause it halts its rise and spreads because of the turnover in the temperature profile. The thick gas disk has an isothermal distribution, so there is no equivalent to the terrestrial tropopause. However, the cap still halts when it expands to buoyant equilibrium with the surrounding atmosphere at a stabilization height .
Let us estimate this height analytically. The simulations produce a gas distribution similar to that of Dickey & Lockman (1990), but for simplicity in our analytical calculation we assume that the thick disk is isothermal with a temperature of K and constant gravitational acceleration in the direction. Thus we approximate the thick disk with an exponential distribution given by , where is the density at the injection level and is the scale height of the medium. We choose somewhat arbitrarily a value of the gravitational acceleration inside the stellar disk cm s-2 (Kuijken & Gilmore 1989), giving pc.
The hot gas is lighter than its surroundings, so it rises, with buoyant force acting on it of , where and are the densities of the ambient medium and of the hot interior gas, respectively. As the hot gas rises, it maintains pressure equilibrium with the isothermal, hydrostatic surrounding gas, and continues to rise so long as a density difference is maintained.
The temperature difference between the hot gas and its surroundings is expressed in terms of the internal temperature gradient of the hot gas. Because the hot gas behaves adiabatically, its internal temperature gradient is given by
| (1) |
with
| (2) |
where is the adiabatic parameter and and are the temperature and pressure of the hot gas at height . Noting that the hot gas remains in pressure equilibrium,
| (3) |
and integration of equation (1), with the help of equations (2) and (3), gives
| (4) |
Therefore, the density of the ascending hot gas is . In these equations, refers to the injection level, rather than the plane of the galaxy.
The gas stops rising when the buoyant force vanishes, and . This allows the determination of the stabilization point, whose location above the injection level is
| (5) |
Taking the scale height of the isothermal, exponential atmosphere that we assumed, pc, hot gas with a density of g cm-3 will stabilize at some 435 pc above the injection level. This is slightly above the value observed in the Mushroom and found in the simulations, most likely due to radiative cooling, as we now discuss.
The adiabatic approximation for the buoyant rise only holds if the hot gas takes longer to radiatively cool than to rise. Let us assume that hot gas has its origin in the supernova remnant that generated the Mushroom. As the remnant comes into pressure equilibrium with the surrounding medium, it contains hot gas that eventually will mix with the surrounding medium with an increase in specific energy of
| (6) |
where dyn cm and g cm are the pressure and density of the hot gas. The adiabatic parameter for the mixed gas is then
| (7) |
and the time the gas takes to cool is (Kahn 1976)
| (8) |
where cm6 g-1 s-4 is a constant dependent on the mean mass of atoms and ions present in the plasma. This is a time much larger than the time needed for a supernova remnant to come into pressure equilibrium with the ISM, so the hot gas must expand upwards into the thick gas disk.
The dynamical time for the hot gas to reach the stabilization point is Myr for our usual parameters, roughly twice the cooling time. Thus, cooling does act during the buoyant rise of the hot gas, reducing the interior pressure and expansion during the rise, and therefore increasing the interior density and ultimately reducing the height of the stabilization point to that found in the simulations.
The description presented here applies to the mushroom-like structure described by English et al. (2000). We have shown that the structures found in the simulations resemble the observed structure in shape, size, vertical extension, and sign of column density enhancement.
In their numerical simulations, Mashchenko et al. (1999) and English et al. (2000) attempted to reproduce the Mushroom and the buoyant rise of the bubble that originated it. In their toy models they used artificially low density, low scale-height ( pc) atmospheres and an initial SN remnant with a temperature of some K. The simulations described in this Letter show that such a low scale height is not a requirement, and that structures similar to the Mushroom can occur in a fully dynamical, supernova-driven disk with a turbulent density distribution on average reproducing the observed distribution found by Dickey & Lockman (1990).
The temperature of the rising gas in our model is initially only K, and decreases further as a result of its adiabatic expansion. Thus, no observable X-ray emission is expected by the time a mushroom is fully developed with a column density higher than the surrounding medium.
Two issues remain: what determines the column density contrast between the mushrooms and the surrounding medium; and how frequently does this new class of objects occur in the Galaxy? The column density contrast may result from enhanced cooling due to the compression of the mushroom cap producing higher densities in the cap. A more physical treatment of the cooling may lead to the higher observed column densities.
The number of mushrooms that form is roughly correlated with the number of isolated SNe distributed in the stellar disk Assuming that the distribution of type Ib+c and II supernovae follow the distribution of the molecular gas, their rate decreases with the galactocentric radius (Ferrière 1998), and therefore, the number of mushrooms will decrease as well at similar rate. Low density cavities with small sizes may be detectable as regions with column density deficits during the first stages of the expansion, but later these become very hard to detect because of the low column density contrast between them and the ISM. The simulations indicate that, even neglecting Type Ia SNe, at least of the hot gas in the thin disk, heated by isolated SNe, should eventually form mushrooms.
References
- (1) Avillez, M. A. 2000, MNRAS, 315, 479
- (2) Bell, J., Berger, M., Saltzman, J., & Welcome, M. 1994, SIAM J. Sci. Comp., 15, 127
- (3) Berger, M. J., & Colella, P. 1989, J. Comp. Phys. 82, 64
- (4) Cappellaro, E., Turatto, M., Tsvetkov, D. Yu., Bartunov, O. S., Pollas, C., Evans, R., & Hamuy, M. 1997, A&A, 322, 431
- (5) Colella, P., & Woodward, P. 1984, J. Comp. Phys., 54, 174
- (6) Cowie, L. L., Songaila, A., & York, D. 1979, ApJ, 230, 469
- (7) Dickey, J. M., & Lockman, F. J. 1990, ARA&A, 28, 215
- (8) Dorfi, E. A., 1997, in Proc. Saas-Fee 27, Computational Methods for Astrophysical Fluid Flow, ed. Steiner, O., Gautschy, A. (Heidelberg: Springer-Verlag) 263
- (9) English, J. Taylor, A. R., Mashchenko, S. Y., Irwin, J., Basu, S., & Johnstone, D. 2000, ApJ, 533, L25
- (10) Ferrière, K. M. 1998, ApJ, 503, 700
- (11) Kahn, F. D. 1976, A&A, 50, 145
- (12) Kuijken, K., & Gilmore, G. 1989, MNRAS, 239, 651
- (13) Higgs, L. A. 1999, in “New Perspectives on the Interstellar Medium”, ed. A. R. Taylor, T. L. Landecker, & G. Joncas (San Francisco: ASP), 15
- (14) Mac Low, M.-M. 1999, Rev. Mex. Astron. Astrofis., Ser. Conf., 9, 273
- (15) Mashchenko, S. Y., Basu, S., English, J., Taylor, A. R., & Irwin, J. A. 1999, BAAS, 194, 72.05
- (16) Reynolds R. J. 1987, ApJ, 323, 118
- (17) Shapiro, P. R., & Moore, R. T. 1976, ApJ, 207, 460
- (18) Tammann G. A., Loeffler W., & Schroeder A. 1994, ApJS, 92, 487
- (19) Taylor, A. R. 1999, in “New Perspectives on the Interstellar Medium”, ed. A. R. Taylor, T. L. Landecker, & G. Joncas (San Francisco: ASP), 3