THE REST FRAME OPTICAL SPECTRA OF LYMAN BREAK GALAXIES: STAR FORMATION, EXTINCTION, ABUNDANCES, AND KINEMATICS11affiliation: Based on data obtained at the European Southern Observatory on Paranal, Chile, and at the W.M. Keck Observatory on Mauna Kea, Hawaii. The W.M. Keck Observatory is operated as a scientific partnership among the California Institute of Technology, the University of California, and NASA, and was made possible by the generous financial support of the W.M. Keck Foundation.
Abstract
We present the first results of a spectroscopic survey of Lyman break galaxies (LBGs) in the near-infrared aimed at detecting the emission lines of [O II], [O III], and H from the H II regions of normal star forming galaxies at . From observations of 15 objects with the Keck and VLT telescopes, augmented with data from the literature for an additional four, we reach the following main conclusions. The rest-frame optical properties of LBGs at the bright end of the luminosity function are remarkably uniform; their spectra are dominated by emission lines, [O III] is always stronger than H and [O II], and projected velocity dispersions are between 50 and 115 km s-1. Contrary to expectations, the star formation rates deduced from the H luminosity are on average no larger than those implied by the stellar continuum at 1500Å; presumably any differential extinction between rest-frame optical and UV wavelengths is small compared with the relative uncertainties in the calibrations of these two star formation tracers. For the galaxies in our sample, the abundance of oxygen can only be determined to within one order of magnitude without recourse to other emission lines ([N II] and H) which are generally not available. Even so, it seems well established that LBGs are the most metal-enriched structures at , apart from QSOs, with abundances greater than about 1/10 solar and generally higher than those of damped Lyman systems at the same epoch. They are also significantly overluminous for their metallicities; this is probably an indication that their mass-to-light ratios are low compared with present-day galaxies. At face value the measured velocity dispersions imply virial masses of about within half-light radii of 2.5 kpc. The corresponding mass-to-light ratios, in solar units, are indicative of stellar populations with ages between and years, consistent with the optical-IR spectral energy distributions. However, we are unable to establish conclusively if the widths of the emission lines do reflect the motions of the H II regions within the gravitational potential of the galaxies, even though in two cases we see hints of rotation curves. All 19 LBGs observed show evidence for galactic-scale superwinds; such outflows have important consequences for regulating star formation, distributing metals over large volumes, and allowing Lyman continuum photons to escape and ionize the intergalactic medium.
1 Introduction
Our current knowledge of the normal galaxy population at high redshift relies heavily on observations in the rest frame ultraviolet (UV) region, where we see the integrated light of OB stars and the strongest spectral features are interstellar absorption lines (e.g. Steidel et al. 1996, 1999; Lowenthal et al. 1996; Pettini et al. 2000; Steidel, Pettini, & Adelberger 2001). The situation is quite different at low redshift where the UV spectra of star forming galaxies have become accessible only relatively recently, requiring observations from space with the Hubble Space Telescope (HST ; see Leitherer 2000 for a recent overview). For the last fifty years local galaxies with active star formation have been studied first and foremost at optical wavelengths through the rich emission line spectrum produced by their H II regions.
There is therefore a strong incentive to obtain such spectra for galaxies at where the samples of UV-selected objects now number nearly one thousand. Apart from the surprises often associated with opening a new wavelength window, there are several obvious scientific motivations. The luminosity of the Balmer lines, primarily H and H, gives a measure of the star formation rate which is directly comparable to the values deduced in local surveys. Furthermore, since the optical emission lines and the far-UV continuum do not respond to dust extinction to the same degree, the relative luminosity of a galaxy in these two tracers of star formation could in principle be used as a reddening indicator. When integrated over an entire galaxy, the widths of the nebular lines should reflect the velocity dispersion of the H II regions within the overall gravitational potential so that a kinematical mass may be deduced. This is not possible in the UV, because the interstellar absorption lines are sensitive to small amounts of gas accelerated to high velocities by energetic events such as supernova explosions and bulk outflows, while the stellar absorption lines from OB stars are intrinsically broad. Finally, there are well established chemical abundance diagnostics based on the relative strengths of nebular emission lines, primarily [O II], [O III] and H. Abundance measurements are much more difficult in the UV where the more easily observed interstellar lines are generally saturated so that their equivalent widths depend mostly on the velocity dispersion of the gas and only to a lesser extent on the column density of the absorbing ions.
At the most prominent lines from H II regions are redshifted into the near-infrared (IR) where observations are more challenging than at optical wavelengths. Not only does atmospheric absorption by water vapour limit observations to specific wavelength bands, but even in these the night sky glows brightly in numerous OH emission lines which vary in intensity over timescales of minutes. However, with a large sample of galaxies such as that produced by the Lyman break technique (Steidel 2000) it is possible to isolate redshifts which place the transitions of interest in gaps between the OH sky lines; here the background is sufficiently dark for faint extragalactic work to become possible. In Pettini et al. (1998) we proved the feasibility of this approach with -band observations of five Lyman break galaxies (LBGs) using the CGS4 spectrograph on the 3.8 m United Kingdom Infrared Telescope (UKIRT). Although successful, these initial attempts showed that galaxies at are generally too faint to be studied in large numbers with 4-m class telescopes. The five galaxies targeted by Pettini et al. are among the brightest LBGs known and still required essentially one night of integration per object with CGS4. On the other hand, the recent commissioning of near-IR, high resolution spectrographs on the Keck II and VLT1 telescopes now makes it possible to extend this work to a larger and more representative sample of high redshift galaxies. We have begun such a program of near-IR spectroscopy and present here our results for 15 Lyman break galaxies. Preliminary reports have been published in conference proceedings (Pettini 2000; Cuby et al. 2000) and similar observations of individual galaxies have also been obtained by Teplitz et al. (2000a,b) and Kobulnicky & Koo (2000).
This paper is arranged as follows. In §2 we summarize details of
the observation and data reduction procedures. Individual objects
with features of special interest are discussed in §3. In §4 we
present our measurements of H luminosity, derive star
formation rates, and compare them with the values deduced from
the UV continuum. §5 deals with the abundance of Oxygen derived
from the strong line ratios, while in §6 we analyze the
kinematics of the galaxies observed. The most important results
of this work are reviewed in §7. Unless otherwise stated,
we adopt a , ,
km s-1 Mpc-1 cosmology throughout the paper.
2 Observations
Details of the Lyman break galaxies observed are collected in Table 1. The optical redshifts listed in columns (4) and (5) were measured from 12.5 Å resolution spectra obtained with the Low Resolution Imaging Spectrograph on the Keck telescopes. The optical photometry is from our , , deep imaging at the prime foci of the Palomar 5-m, La Palma 4.2-m, and Kitt Peak 4-m telescopes, while the () colors listed in column (7) are from the survey by Shapley et al. (in preparation) conducted with the Keck Near-Infrared Camera (NIRC). Objects were selected from a variety of fields, some including high redshift QSOs and radio galaxies, others being blank regions of sky already targeted by other deep surveys such as the Hawaii deep field SSA22, the Caltech Deep Field, and the Groth-Westphal strip. Coordinates of all the objects observed are given in columns (2) and (3) of Table 1.
The primary selection criterion in compiling the sample in Table 1 was redshift; as explained above we aimed to minimize the chance of interference from bright sky lines. We also limited ourselves to galaxies brighter than which at corresponds to in the rest frame ultraviolet (Steidel et al. 1999); thus the galaxies observed are drawn from the brightest 10% of the full sample of more than 800 spectroscopically confirmed LBGs with (Steidel 2000). We further attempted to span a range of () colors so as to sample objects with different UV continuum slopes, presumably reflecting different degrees of dust extinction. None of the galaxies show evidence for nuclear activity in their rest frame UV spectra. Most of the observations were targeted at H () and the [O III] doublet () in the -band; in a few additional cases we also searched for the corresponding [O II] () in the -band.
2.1 Data Acquisition
The data were secured during four observing runs in 1999 and 2000 using the NIRSPEC and ISAAC spectrographs on the Keck II and VLT1 telescopes respectively (see last column of Table 1).
A detailed description of NIRSPEC is given by McLean et al. (1998). It uses a 27m pixel (ALADDIN2) InSb detector; in the medium dispersion mode employed for the present observations each detector pixel corresponds to 0.143 arcsec in the spatial direction and the dispersion in the spectral direction is 4.2 Å/pixel. In the September 1999 observing run we used an entrance slit 0.57 arcsec wide which gives a spectral resolution of 11.6 Å FWHM (resolving power at 2.05 m) sampled with 2.8 wavelength bins (measured from the widths of sky emission lines in the reduced spectra). In April 2000 we changed to the wider 0.76 arcsec entrance slit, giving a resolution of 13.6 Å FWHM (resolving power ) sampled with 3.2 bins. The galaxies to be observed were placed in the slit by offsetting from a nearby bright star. This manoeuvre was ’blind’ in the sense that normally the galaxy and the offset star were separated by more than the 42 arcsec length of the NIRSPEC slit; however, on no occasion did we fail to acquire the target. Individual exposure times were 900 s; the detector was read out in multiple read mode (16 reads at the start and the end of each integration) to reduce noise. After each exposure the offsetting procedure was repeated and the target reacquired at a different position on the slit, typically 5 arcsec from the previous one. Conditions were mostly photometric during both Keck runs and the typical seeing in the -band was 0.5–0.6 arcsec FWHM.
The short wavelength channel of ISAAC (Moorwood et al. 1999) uses a 18.5m pixel Rockwell array; the projected pixel scale along the slit is very similar to that of NIRSPEC, 0.146 arcsec/pixel. The spectral dispersion, however, is 2.3 times higher at 1.24 Å/pixel; with the 1 arcsec wide slit we used, the resolution is 7.4 Å FWHM () sampled with six wavelength bins. Acquisition was also achieved via nearby bright stars; in this case however the 120 arcsec long ISAAC slit allowed us to have both offset star and target galaxy on the slit at the same time (having rotated the slit to the required position angle on the sky). The bright star spectrum is a useful reference for verifying the accuracy of the offsetting procedure, and monitoring seeing and sky transparency fluctuations. Our two VLT runs in September and November 1999 were mostly photometric and the seeing varied between 0.5 and 0.9 arcsec. The ISAAC observations were performed in beam-switching mode with the object moved between two positions on the slit separated by 10 arcsec. After an A-B-B-A series of s long exposures, the object was reacquired at a different position along the slit, and the four-exposure sequence repeated.
2.2 Data Reduction
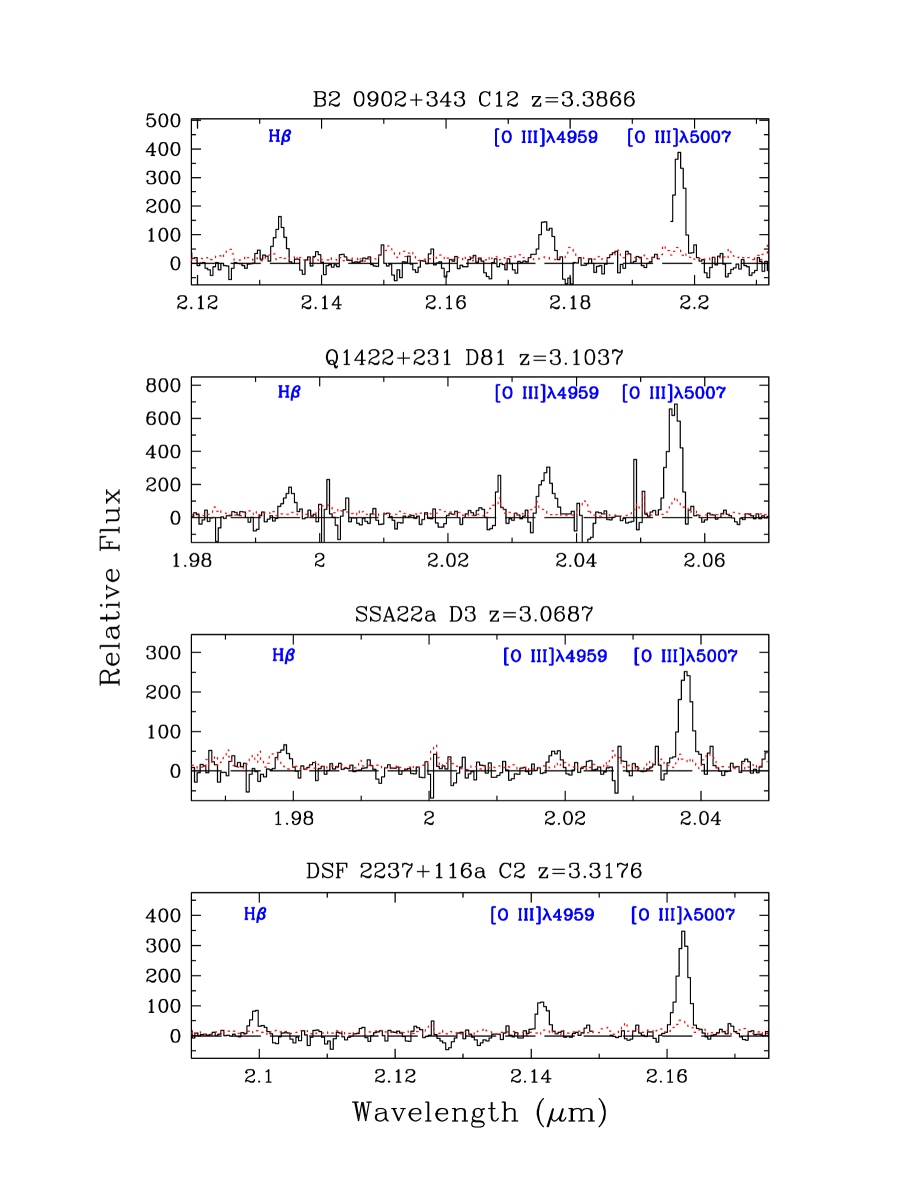
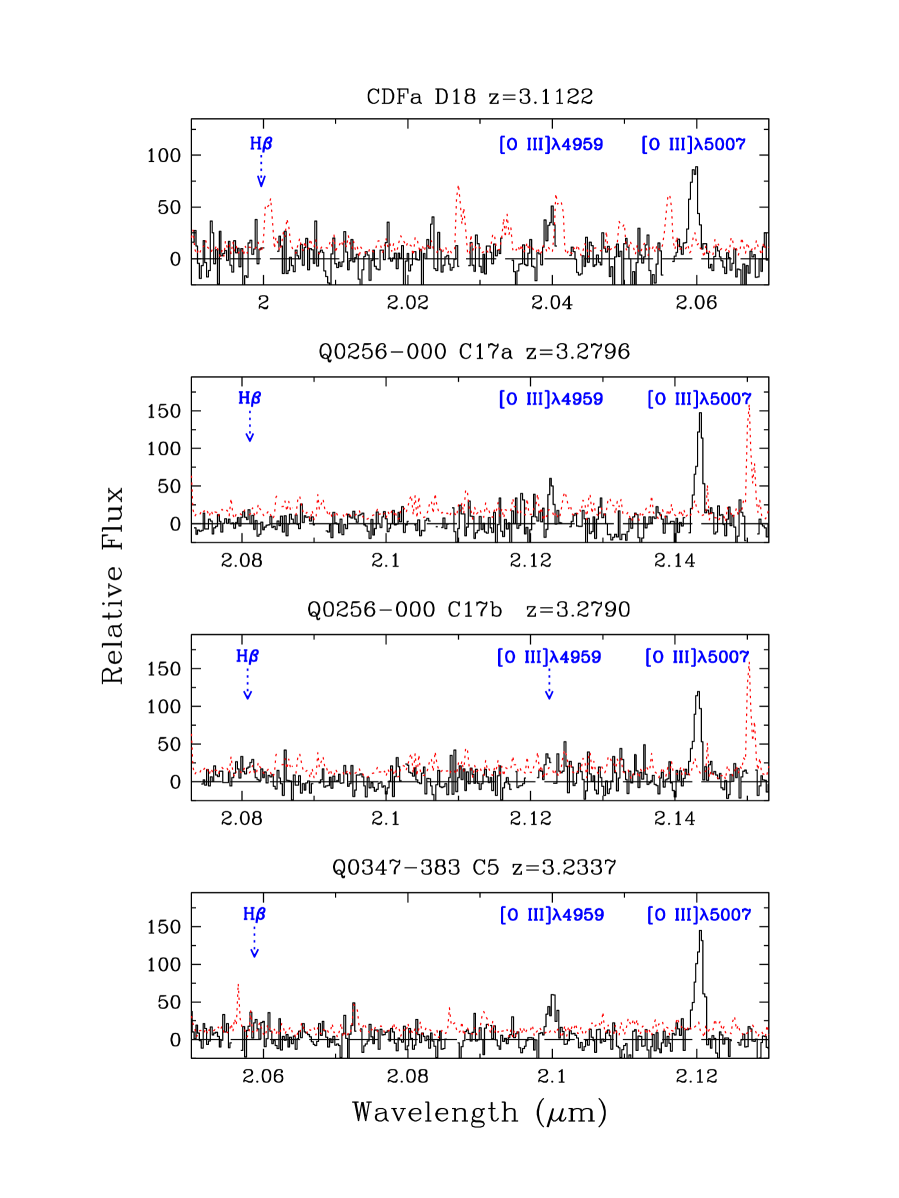
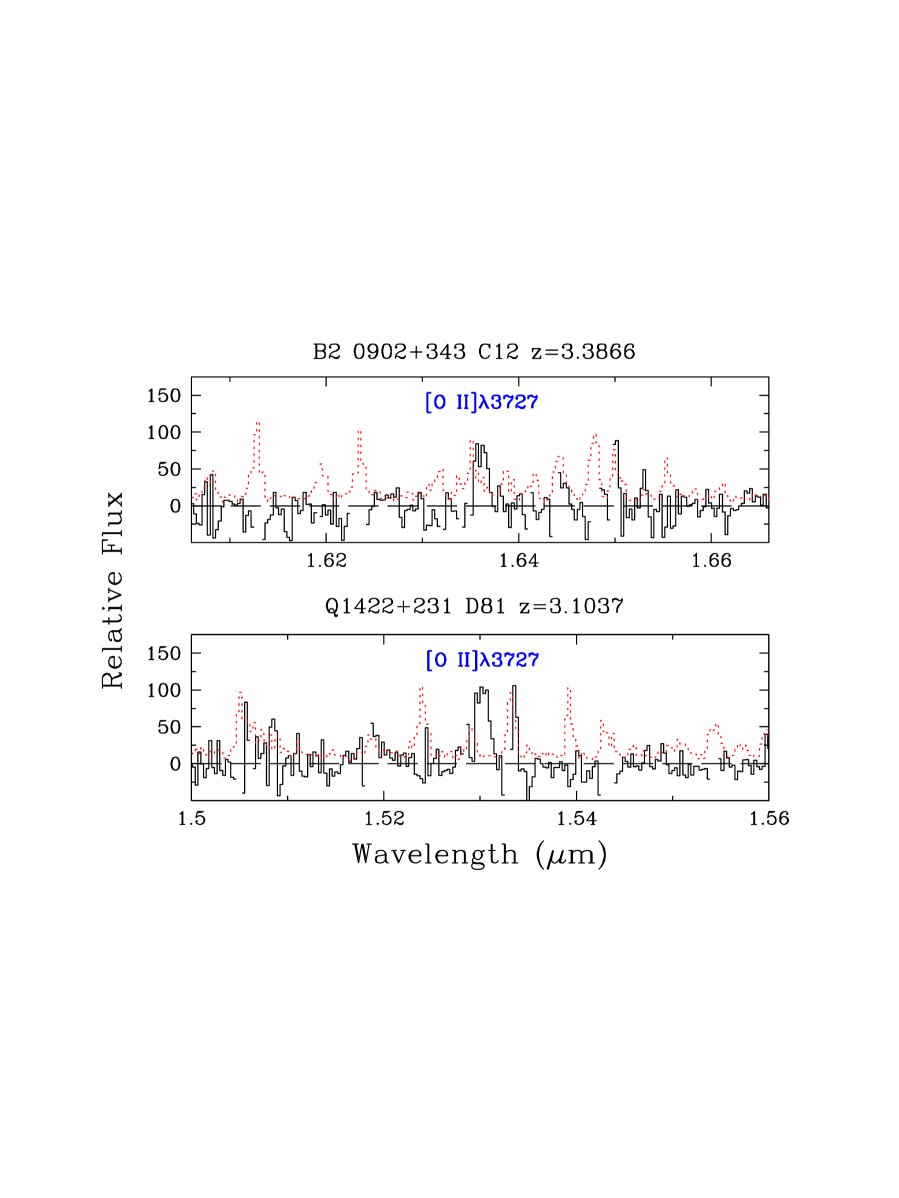
Examples of NIRSPEC and ISAAC spectra of Lyman break galaxies in the -band are reproduced in Figures 1 and 2 respectively, while Figure 3 shows detections of [O II] in the -band. In Figure 2 the ISAAC spectra have been rebinned to twice the original pixel size, so that the spectral resolution is sampled with three wavelength bins in these plots.
The two-dimensional data frames were reduced using a series of IRAF scripts, following the same basic steps for NIRSPEC and ISAAC spectra. After flat-fielding (by reference to the spectrum of a quartz halogen lamp), correcting for defective pixels (flagged from the analysis of the noise in flat-field and dark current frames), and rotating the images (so as to align the spectrum approximately along the columns of the detector), we applied a geometric transformation to correct for the spatial distortion and spectral curvature introduced by the spectrograph optics. The two-dimensional map used in this transformation was obtained by stepping a bright star in regular intervals along the slit and determining the star trace as a function of slit position. The rectified 2-D images were wavelength calibrated on a vacuum scale with the aid of the atlas of OH sky emission lines by Rousselot et al. (2000). The next steps in the reduction differed slightly between NIRSPEC and ISAAC spectra.
With NIRSPEC we moved the object along the slit every 900 s exposure. Consequently, we used the exposures immediately preceding and following a given image to construct a sky frame which was then subtracted in 2-D from each image, after appropriate line-by-line scaling. A further background correction was applied to each sky-subtracted image (by fitting a polynomial in the spatial direction at each wavelength bin) to remove the residuals at the wavelengths of the strongest sky lines. The individual frames so processed were then registered and co-added (with a rejection algorithm to exclude cosmic rays and other invalid pixels) to produce a fully reduced, two-dimensional spectrum of each galaxy observed. The final step in the reduction involved extracting one-dimensional spectra by summing the signal along the slit; we applied both weighted and unweighted extractions, but found the two methods to give very similar results. The IRAF scripts used in the manipulation of the data frames also generate at each step a corresponding 2-D frame of the statistical error appropriate to each pixel; in the last step this is used to produce the one-dimensional error spectrum applicable to the extracted galaxy spectrum.
Since the ISAAC observations were obtained in beam-switching mode, sky subtraction was achieved by adding separately the pair of frames with the object at position A and the pair with the object at position B. Two difference images were then produced from these pairs: AB and BA. After registering one difference image onto the other by the known A-B telescope offset, the two were added together; this produces a characteristic 2-D image with a positive galaxy spectrum flanked by two negative spectra (separated from the positive spectrum by the A-B spatial offset). Our observations usually consisted of a series of three or five such A-B-B-A patterns (at different positions along the slit); these were combined and extracted in the same way as the NIRSPEC spectra.
2.3 Flux Calibration
The extracted one-dimensional spectra were put on an absolute flux scale by reference to spectra of bright A0 stars observed each night at approximately the same airmass as the galaxies and with the same instrumental configuration. In some cases the stellar spectra were additionally recorded through a wide slit, so as to verify empirically the slit losses with the standard set-ups described at §2.1. The stars, which typically have ,, were selected from the list of UKIRT photometric standards111Available at http://www.jach.hawaii.edu/JACpublic/UKIRT/astronomy/calib (see also van der Bliek, Manfroid, & Bouchet 1996). The conversion factor (as a function of wavelength) between counts and flux (in Jy units) was based on the spectral energy distribution of Vega (Colina, Bohlin, & Castelli 1996) and the measured broad band and magnitudes of the A stars. Since the spectra of A0 stars are relatively smooth at the wavelengths of interest here, they were also used to correct for atmospheric absorption (although in only a few cases did the nebular emission lines fall near telluric features).
It is important to assess the overall reliability of the
spectrophotometric calibration—a notoriously difficult step in
the reduction of narrow-slit spectra—because it impacts
directly on the comparison at §4 below between Balmer line and
UV continuum luminosities, and on the abundance determinations in
§5. Observations of different A0 stars (on the same night and on
different nights) indicate a random uncertainty of %
() in the zero point of the flux calibration.
However, we are more
concerned with systematic errors which may result from inaccurate
placing of the targets in the spectrograph slit and from finite
aperture effects. Generally, we do not expect the latter to be very
large given that the typical half-light radius of Lyman break
galaxies in the rest-frame optical is 0.2–0.4 arcsec
(Giavalisco, Steidel, & Macchetto 1996; Dickinson 2000;
Calzetti & Giavalisco 2000), but see §6 below.
We have two ways to check on such
systematics. One is to compare observations of the same object
obtained with different telescopes. Out of the present sample,
Q0201113 C6 was observed in the -band with three different
instruments: NIRSPEC on Keck II, ISAAC on VLT, and CGS4 on UKIRT.
The three measurements of [O III] at ,
respectively (), (), and () in units of erg s-1 cm-2, are within
of one another.222As explained in §3.1
below, this line was misidentified as [O III] at
in the CGS4 spectrum analyzed by Pettini et al.
(1998). In a separate test, for two objects where a continuum
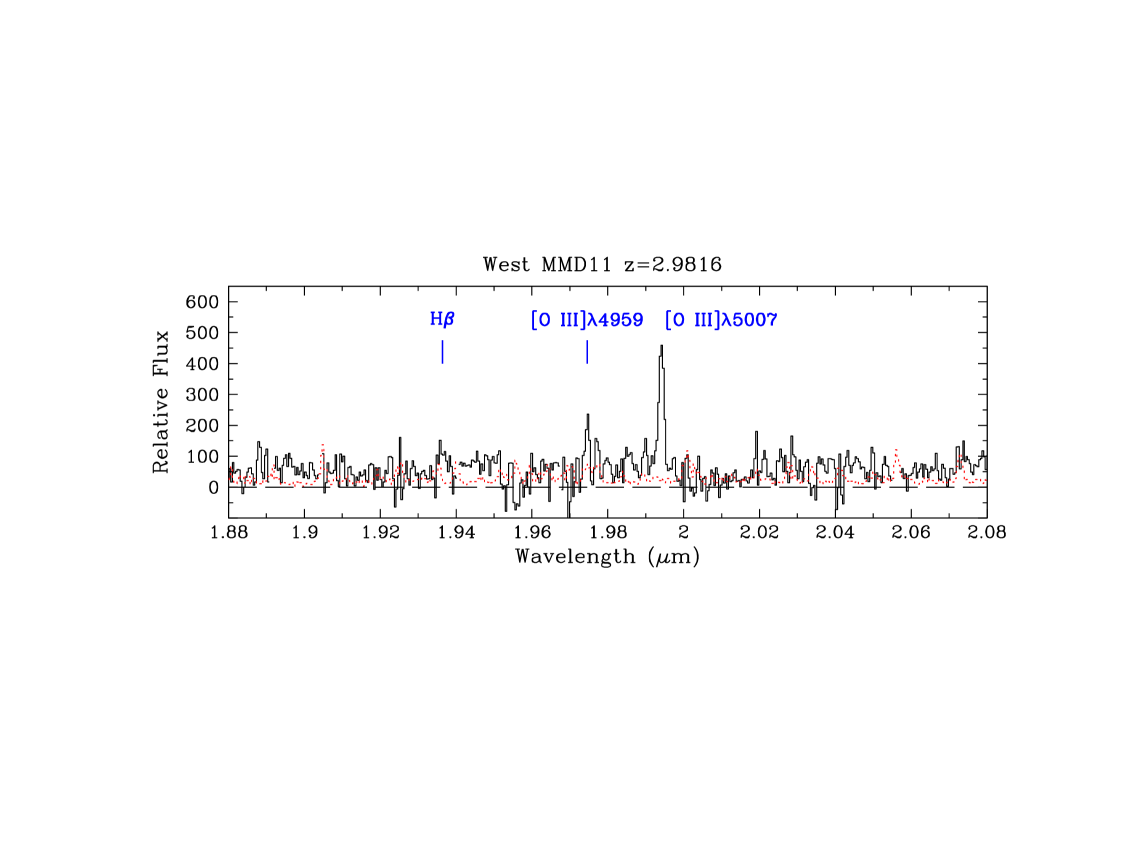
signal is clearly detected in our NIRSPEC spectra—West MMD11
(Figure 4) and SSA22a D3—we can compare it directly with the
broad-band magnitude (Table 1). In both cases we find that
the spectra underestimate the continuum flux by the same factor
of 1.4 . We intend to continue monitoring the issue of
spectrophotometric accuracy as our survey progresses. On the
basis of these limited tests it appears that our
absolute fluxes may be in error by up to about 50%. We shall
take this uncertainty into account in the analysis of our
results.
3 Comments on Individual Objects
From Figures 1–3 it can be readily realized that the rest-frame optical spectra of the Lyman break galaxies in the present sample share many similarities. The spectra are dominated by the strong nebular lines, as is the case in local H II galaxies, and the rest-frame blue continuum is generally too weak to be detected. There is a remarkable uniformity in the line widths (as we shall see at §6 below, the one dimensional velocity dispersion is between and 115 km s-1), and in the relative line strengths, with H generally weaker, or at most as strong as, [O III]. This probably explains why H is undetected in most of our ISAAC spectra which, because of their higher dispersion and the smaller aperture of the VLT, generally have a higher detection threshold than the NIRSPEC spectra. If these line ratios are typical of most galaxies at , [O III] is then the most prominent spectral feature to fall in near-IR wavelength region, rather than H. The generally high excitation of the H II gas is further reflected by the weakness of [O II] relative to [O III] in all five cases observed; compounded with the higher density of strong sky lines in the -band, this makes a difficult feature to detect, as can be appreciated by comparing Figure 3 with Figures 1 and 2. Thus the prospects for using [O II] to probe galaxies at , where [O III] and H are redshifted beyond the -band, are not encouraging even with 8-10 m telescopes.
Before discussing further the properties of the sample as a whole, we comment briefly on a few objects.
3.1 Comparison with UKIRT Observations
We reobserved two galaxies out of the five in the sample by Pettini et al. (1998), Q0201113 C6 and DSF 2237+116a C2 (the latter shown in the bottom panel of Figure 1). With the better spectra now available we realize that the spectral features in the former were misidentified, and the emission line redshift (vacuum heliocentric) is rather than 3.094 as reported earlier. The confusion arose because we incorrectly identified [O III] as and a noise feature as H. The new value of redshift is in much better agreement with that of the interstellar absorption lines in the rest-frame UV, thereby removing the anomaly noted by Pettini et al. In the case of DSF 2237+116a C2, we confirm the redshift, but not the strengths and widths of the emission lines. In the CGS4 data this galaxy appeared to have lines twice as strong and wide as those of the other four objects observed, although we did express concerns about possible noise contamination. The values measured from the much higher signal-to-noise ratio NIRSPEC spectrum, km s-1, Å (rest frame equivalent width), and Å, are smaller by about a factor of 2 than those reported in Pettini et al, bringing this galaxy in line with the rest of the sample.
3.2 Null Detections
Out of the 15 LBGs targeted by our survey so far, 13 have yielded detections of nebular emission lines. The two objects where no signal could be found in the reduced two-dimensional spectra are Q1422231 D78 and DSF 2237+116b C21 (see Table 1). The latter was observed in poor seeing conditions; furthermore it is the highest redshift object in the present sample, placing [O III] at 2.2 m where the thermal background at Paranal is more than five times higher than at 2.0 m. The redshift of the former is uncertain and may have been misidentified. Another possibility is that these are objects caught in a post-starburst phase, when the emission lines have faded but the UV continuum remains bright. From these limited statistics we conclude that the fraction of bright LBGs in a post-starburst phase is at most %.
3.3 Q0256000 C17
In this case we were surprised to find two emission line spectra along the slit, one at the position of the LBG and the other displaced by 3.15 arcsec to the NW (see Figure 14 of Cuby et al. 2000). The two spectra, reproduced in the middle two panels of Figure 2, are similar but not identical; in particular the second set of lines (Q0256000 C17b) is blueshifted by 42 km s-1 relative to the first. In our cosmology the spatial separation between the two emitting regions corresponds to a projected distance of kpc. Upon re-examination of our broad-band images, we can see a very faint object at the position of this second [O III] emitter with (below our magnitude limit for selecting -drop candidates), () , and () . With the assumption that the mean of the present sample applies to Q0256000 C17b too (see §4 below), we deduce a rest frame equivalent width Å. While relatively rare, H II galaxies with such a high equivalent width of [O III] are not unknown locally; for example, in the catalog by Terlevich et al. (1991) 31 out of 425 emission line galaxies have Å.
3.4 West MMD11
Among the objects observed is West MMD11, one of the few LBGs to have been detected at sub-mm wavelengths with SCUBA (Chapman et al. 2000). This object has unusually red optical-UV colors; with it stands out from the rest of the sample in Table 1 which has (). As can be seen from Figure 4, our NIRSPEC observations clearly show the rest frame optical continuum, only detected in one other object, SSA22a D3. However, it can also be readily appreciated from Figure 4 that the emission line spectrum of West MMD11 is in no way atypical; the strengths and widths of [O III] and H, as well as their ratio, are similar to those of the other galaxies in our sample (see also Tables 2 and 4, and Figures 5 and 8 below). As pointed out by Adelberger & Steidel (2000), the unusually red color of West MMD11 cannot be entirely attributed to dust extinction, a conclusion consistent with the findings reported here. Perhaps the optical continuum is indicative of an earlier strong burst of star formation, well separated in time from the one which produced the OB stars we now see in the UV continuum and H II region emission lines.
3.5 Other Objects in Table 1
When considering the near-IR properties of Lyman break galaxies
in §4–6 below, we have expanded the present sample of 15 objects
with published observations for an additional four.
Two, Q0000263 D6 and B2 0902+343 C6, are from our earlier
UKIRT work; although these data have to considered as tentative,
given the discussion at §3.1 above, we note that the
relevant measurements are typical of the rest of the sample.
Our conclusions would remain unaltered if we excluded these two
galaxies from the analysis.
The other two LBGs, West CC13 and MS 1512-cB58, have been
observed in the -band with NIRSPEC by
Teplitz et al. (2000a,b respectively)
using a similar instrumental setup as that described
at §2.1 above, although the integration times
were shorter than those of our own observations.
Other relevant details are given in Table 1.
4 Star Formation Rates and Dust Extinction
Up to now most estimates of the star formation activity in galaxies at have been obtained from consideration of their ultraviolet continuum luminosity. In the -band we have access to another star formation rate indicator in the H line. Apart from the obvious importance of measuring a physical quantity in two independent ways, there are at least two additional incentives to comparing UV and Balmer line luminosities. First, many of the surveys at lower redshifts have been based on H (e.g. Gallego et al. 1995; Salzer et al. 2000; Tresse & Maddox 1998; Glazebrook et al. 1999; Yan et al. 1999; Moorwood et al. 2000); clearly, it is desirable to use the same measure (or two closely related ones such as H and H) when considering the evolution with redshift of global properties such as the volume averaged star formation rate density. Second, almost by definition, all interstellar reddening curves rise from the optical to the ultraviolet. Thus, at least in principle, it should be possible to deduce the degree of extinction from the comparison between the values of star formation rate deduced from the UV continuum and from the Balmer lines.
Data relevant to this comparison are collected in Table 2. In our enlarged sample there are 14 LBGs where we either detect the H emission line or can place a useful upper limit to its flux. In columns (6)–(8) of Table 2 we list respectively the measured H fluxes, rest frame equivalent widths, and luminosities. The values of equivalent width were derived by referring the measured line fluxes to the continuum fluxes implied by the broad-band magnitudes333The emission lines themselves make a negligible contribution to according to the standard relation:
| (1) |
where is the flux in units of erg s-1 cm-2 Hz-1. In four cases where a -band magnitude is not available, we adopted the mean () for the sample (excluding West MMD11 as discussed at §3.4 above). The UV continuum luminosities at 1500 Å listed in column (5) were calculated from the magnitudes in column (3) also using eq.(1) and applying, where necessary, -corrections deduced from the continuum slope measured in our LRIS spectra. Since the effective wavelength of our filter, 6850 Å, corresponds to a rest frame wavelength of 1670 Å at the median , the required -corrections were normally less than 10%. Finally, columns (9) and (10) of Table 2 give the the star formation rates implied by the H and UV continuum luminosities listed in columns (8) and (5) respectively, adopting Kennicutt’s (1998) calibrations:
| (2) |
| (3) |
and assuming a ratio H/H = 2.75 (Osterbrock 1989). Both transformations are appropriate to continuous star formation with a Salpeter initial mass function (IMF) between 0.1 and 100 M⊙; we note that eq. (2) gives values of SFR 40% higher than the calibration we adopted in Pettini et al. (1998). More generally, both conversions from luminosity to SFR are subject to significant uncertainties, as discussed by Kennicutt (1998) and more recently re-emphasized by Charlot & Longhetti (2001). However, here we are concerned mainly with comparing the values of SFR deduced from these two indices; since they both trace massive stars the hope is that many of the systematic uncertainties may be reduced when considering the ratio SFRHβ/SFRUV.
Nevertheless, several qualifications are necessary before proceeding further. First, the conversion factor H/H = 2.75 does not take into account corrections to the H flux for reddening and stellar absorption. We suspect that both are likely to be of secondary importance, however. The values of () implied by the slopes of the UV continua of most Lyman break galaxies correspond to small Balmer decrements; for example in MS 1512-cB58, which with () is among the more reddened LBGs, dust extinction reduces the H/H ratio by only % relative to the recombination value (Teplitz et al. 2000b). The integrated H stellar absorption line is expected to have an equivalent width Å (Kobulnicky, Kennicutt, & Pizagno 1999) and is therefore likely to result in a small correction (comparable to the statistical error) for all the entries in Table 2, except for the two cases where we measure Å. A potentially more serious effect which may lead us to underestimate SFRHβ relative to SFRUV is light loss through the spectrograph slit, since the former is derived from a spectrophotometric measurement whereas the latter is from broad-band photometry. Our limited internal checks described at §2.3 above suggest that such an underestimate may be less than %, although future observations may lead to a revised figure.
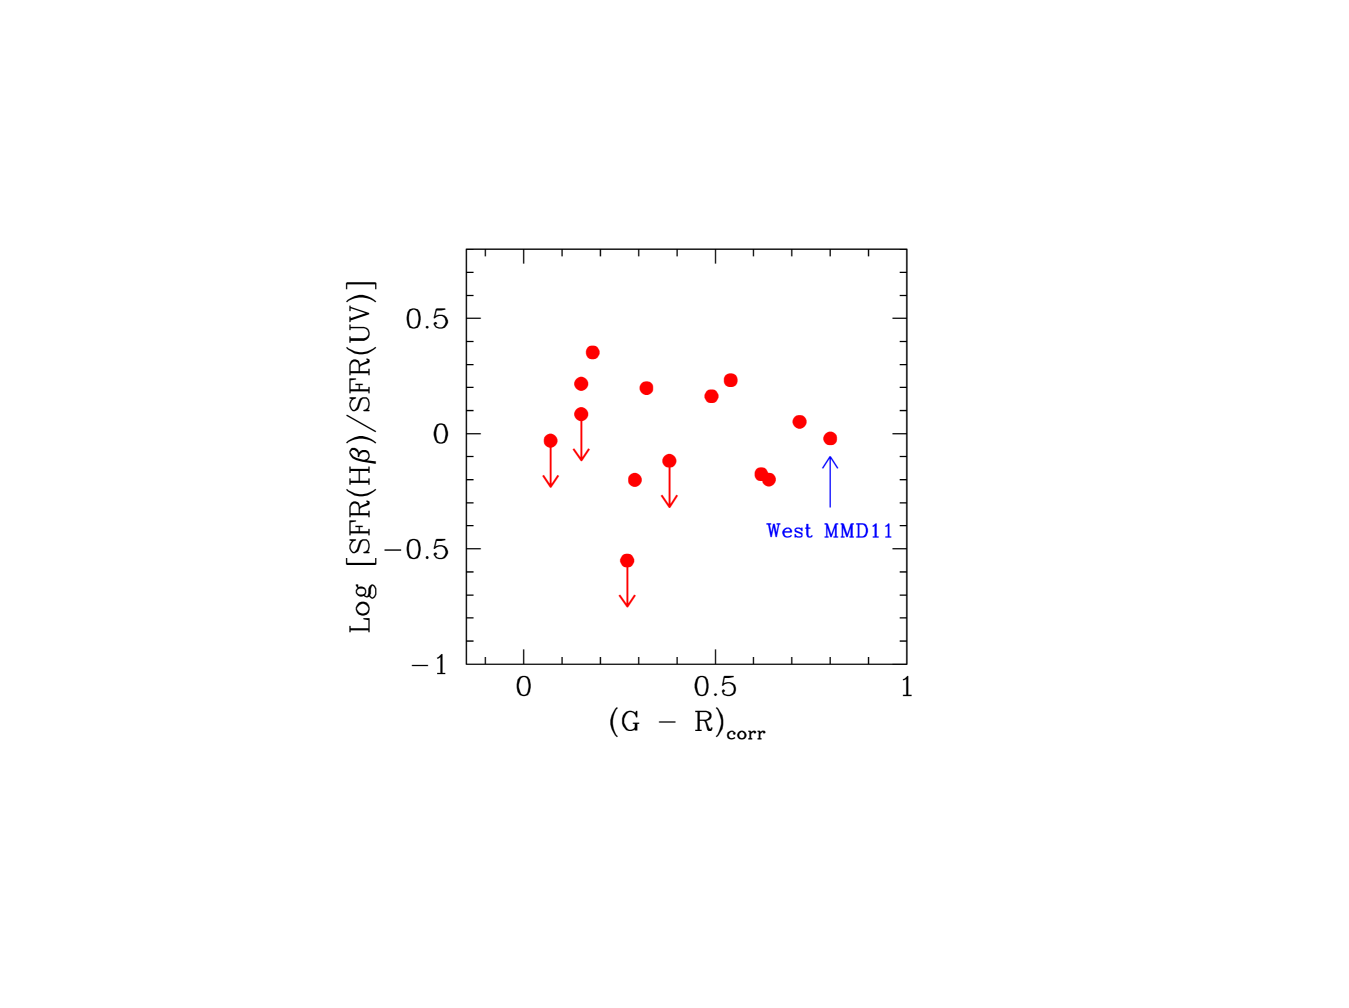
With these reservations in mind, we compare the two sets of measurements of SFR in Figure 5, where the ratio SFRHβ/SFRUV is plotted against the intrinsic far-UV spectral slope. The most reliable measure of the latter, free from the uncertainties inherent in narrow slit spectrophotometry, is the () color, corrected for the opacity of the Lyman forest according to the statistical prescription of Madau (1995). Values of ()corr are tabulated in column (4) of Table 2; () and correspond to a UV spectral index and respectively, when the spectrum is approximated by a power law of the form .
It can be readily realized from Figure 5 and Table 2 that the values of SFR deduced from H and from the far-UV continuum agree within a factor of in nearly every case. There is no tendency for SFRHβ to be systematically greater than SFRUV, nor any evidence for the ratio of these two quantities to be higher in galaxies with a redder UV continuum. Earlier suggestions of such a trend in samples of only a few objects (Pettini et al. 1998; Teplitz et al. 2000a) now appear to have been the artifact of small number statistics444The apparent trend in Figure 5 of Pettini et al. (1998) was due to a single object, DSF 2237116a C2, whose H flux we have now revised downward by a factor of (§3.1)..
In approximately half of the cases we find SFR SFRUV. Apart from the caveats expressed above, there are several plausible explanations for this apparently surprising result. Even without appealing to differences in the IMF, the Balmer lines are expected to vary on shorter timescales than the UV continuum if ‘continuous’ star formation is in reality an approximation to a series of individual starburst episodes (Glazebrook et al. 1999; Bunker, Moustakas, & Davis 2000). This is because the overwhelming contribution to the ionizing flux reprocessed in the Balmer lines is from the most massive stars, at the very tip of the IMF, while a wider range of stellar masses produces the continuum at 1500 Å. In this scenario, LBGs with SFR SFRUV are galaxies observed 5–10 Myr after a major star formation event. Other possibilities include higher reddening of the Balmer lines than the UV continuum, again related to the different evolutionary timescales of the stars involved (Calzetti 1997), and the leakage of some of the Lyman continuum photons from the galaxies (Steidel, Pettini & Adelberger 2001). In this respect Lyman break galaxies at are actually not dissimilar to UV selected galaxies at lower redshifts, where recent comprehensive studies have shown that H and the UV continuum are qualitatively consistent with each other, although generally at lower luminosities than those of the present high- sample (Sullivan et al. 2000; Bell & Kennicutt 2001). In any case, the simplest conclusion from the results in Figure 5 is that, for the Lyman break galaxies in the present sample (which is representative of the range of () colors of our full survey), the higher extinction at UV wavelengths predicted by all reddening curves is evidently masked by the uncertainties discussed above in relating UV continuum and H luminosities. The differential extinction between the continuum at 1500 Å and H must therefore be relatively small, as indeed expected on the basis of the reddening ‘recipe’ by Calzetti (1997).
In concluding this section, we point out that
our results contradict two commonly held
views. First, it is often stated that the UV continuum
is an unreliable measure of the SFR and that the Balmer lines are to be
preferred, partly because they suffer less extinction
and partly because they have been studied
in much larger samples of nearby galaxies.
However, adding up the entries in columns (9) and (10)
of Table 2 (and taking the upper limits as detections)
we find that, for the 14 Lyman break galaxies
considered here, the total values of
SFRHβ and SFRUV
are within 15% of each other.
Thus both SFR indicators, uncorrected for dust extinction ,
give essentially the same star formation rate density.
Secondly, it is felt by some that the relative strengths of the Balmer
lines give a more secure estimate of the colour excess
() than the slope of the far-UV continuum.
However, as we have seen, in most LBGs at
the Balmer decrement is too small to be measured with the required
precision from ground-based IR spectroscopy, whereas
the UV spectral index can be readily obtained
from broad-band optical photometry.
5 The Oxygen Abundance
Measurements of element abundances in high redshift galaxies hold powerful clues to their evolutionary status, to their links with today’s galaxy populations, and to the onset of star formation in the universe. Up to now progress on these issues has relied almost exclusively on studies of damped Lyman systems (e.g. Pettini et al. 1999; Ellison et al. 2001; Prochaska, Gawiser, & Wolfe 2001 and references therein) which, however, generally do not probe the most active star forming sites (e.g. Bunker et al. 1999; Kulkarni et al. 2000, 2001 and references therein). In contrast, we are still essentially ignorant of the degree of metal enrichment reached by Lyman break galaxies. Yet these objects could be important contributors to the census of metals at high redshifts which currently seems to show a marked deficit—so far we can account for only about 1/10 of the element production associated with the UV light density at (Pettini 1998; Pagel 2000).
To date there is only one LBG where element abundances have been determined with some degree of confidence, the gravitationally lensed galaxy MS 1512-cB58 at , where young stars, H II regions, and neutral interstellar gas all exhibit a metallicity of about 1/3 solar (Pettini et al. 2000; Teplitz et al. 2000b; Leitherer et al. 2001). Here we provide measurements for an additional four LBGs, albeit of lower accuracy than allowed by the gravitationally lensed nature of MS 1512-cB58.
Approximate estimates of the oxygen abundance in H II regions have traditionally been obtained from the strong line index which relates (O/H) to the relative intensities of [O II] , [O III] , and H (Pagel et al. 1979). Kobulnicky et al. (1999) have recently re-examined the accuracy of this method when applied to the integrated spectra of distant galaxies and in doing so addressed a number of potential problems including the effects of abundance gradients, inhomogeneous temperature and ionization, stellar absorption and other complications. They concluded that, given spectra of sufficient signal-to-noise ratio, typically measures the abundance of oxygen to within dex.
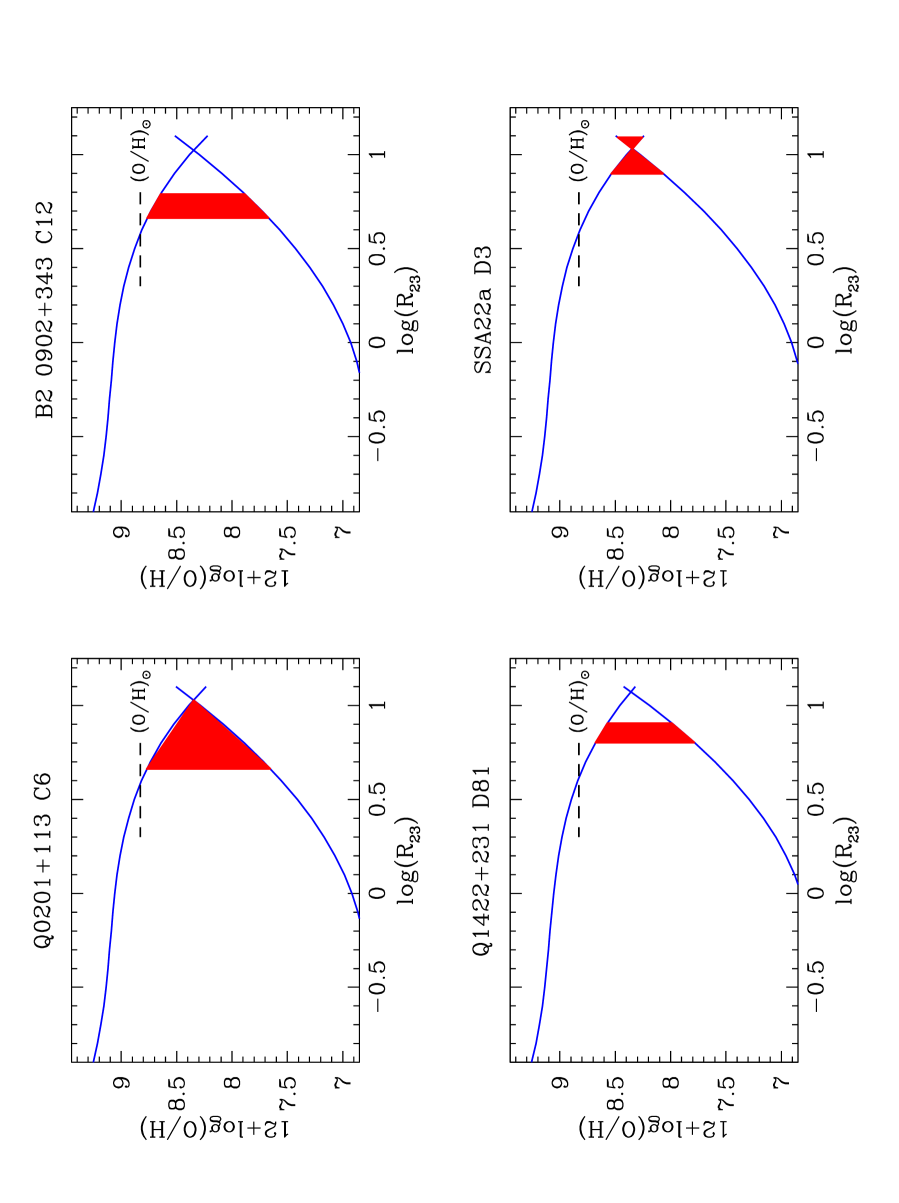
Measurements in the four galaxies in our sample for which we cover all four emission lines are collected in Table 3. Values of are listed in column (9); the range reflects the statistical errors in the individual values of . Again, we made no attempts to correct the observed fluxes for differential extinction because we expect this to be a small effect compared with other uncertainties. In deriving the oxygen abundances we made use of the most recent formulation by Kobulnicky et al. (1999) of the analytical expressions by McGaugh (1991); these formulae express (O/H) in terms of and the ionization index . The results are illustrated in Figure 6 which shows the well-known double-valued nature of the relation. In the last two columns of Table 3 we list separately the values of (O/H) for the lower and upper branches; in each column the range of values includes the statistical uncertainties in both and . We also include in the table the results by Teplitz et al. (2000b) for MS 1512-cB58.555We note in passing that, as pointed out most recently by Pilyugin (2000), the calibration by McGaugh (1991) overestimates the upper branch value of (O/H) by about 0.2 dex when compared with the empirical best fit to accurate abundances determined from temperature sensitive line ratios. However, the analytical expressions given in Kobulnicky et al. (1999) partly compensate for this effect.
It can be seen from these data that Lyman break galaxies generally tend to lie toward the right-hand side of the diagram with values log . In four out of five cases (the exception being Q0201113 C6) the statistical errors in the emission line ratios are tolerable, leading to an uncertainty in (O/H) of only about a factor of two. Much more serious is the ambiguity resulting from the double-valued nature of the relationship between (O/H) and . Only in one case, SSA22a D3, do we measure a value of which falls in an unequivocal region of the diagram and deduce (O/H) –8.55, (between 1/6 and 1/2 of solar). More generally, the two possible solutions differ by nearly one order of magnitude; oxygen could be as abundant as in the interstellar medium near the Sun, where (O/H) (O/H)⊙ (Meyer, Jura, & Cardelli 1998; Esteban et al. 1998) or as low as in low luminosities H II galaxies at solar.
This unsatisfactory state of affairs can in principle be resolved by observing the [N II] and H emission lines; the secondary nature of nitrogen leads to a strong dependence of the [N II]/H intensity ratio on (O/H) (Kobulnicky et al. 1999; Terlevich, Denicolo, & Terlevich 2001). It was on this basis that Teplitz et al. (2000b) concluded that MS 1512-cB58 lies on the upper branch of (O/H) vs. relation, and the resulting (O/H) (O/H)⊙ does indeed agree with the abundances of other elements measured in OB stars and H I gas.
The fact that for two objects (MS 1512-cB58 and SSA D3) it has been possible to determine with some degree of confidence that the oxygen abundance is relatively high is in our view insufficient ground to assume that this is generally the case in Lyman break galaxies (e.g. Teplitz et al. 2000a; Kobulnicky & Koo 2000). Although we see a great deal of uniformity in the ratio of [O III]/H among all the LBGs observed (Figures 1 and 2), the normally high values of R23 implied could still hide a substantial spread in (O/H), as demonstrated by Figure 6. The only reliable conclusions we can draw are that the Lyman break galaxies in our sample: (a) do not have super-solar abundances and (b) are significantly more metal-rich than damped Lyman systems at the same epoch, since the latter typically have metallicities at (Pettini et al. 1999; Prochaska et al. 2001). If either of these two statements were incorrect, then we would expect log which can already be excluded by the measured [O III]/H ratios without recourse to [O II] .
The inclusion of [N II] and H in the abundance analysis is generally not an option (at least from the ground) for galaxies at where the [N II] doublet and H lines are redshifted beyond the -band. Even at more favourable redshifts near for example, where all the transitions of interest fall within atmospheric transmission windows, the determination of nebular abundances in Lyman break galaxies remains a difficult task. First, there will be relatively few cases where the full complement of [O II], H [O III], H, and [N II] lines is well clear of OH sky emission. Second, recording all the lines in the three near-IR bands with sufficient resolution and S/N will require nearly one night of observations on an 8-10 m class telescope for a single LBG. Thus it appears that, even when multi-object IR spectrographs become available, assembling a moderately large sample of (O/H) measurements at high redshifts will involve a major observational effort. There is therefore a strong incentive to explore alternative abundance indicators in the rest-frame UV region which is more easily studied from the ground (e.g. Leitherer et al. 2001).
5.1 Metallicity-Luminosity Relation
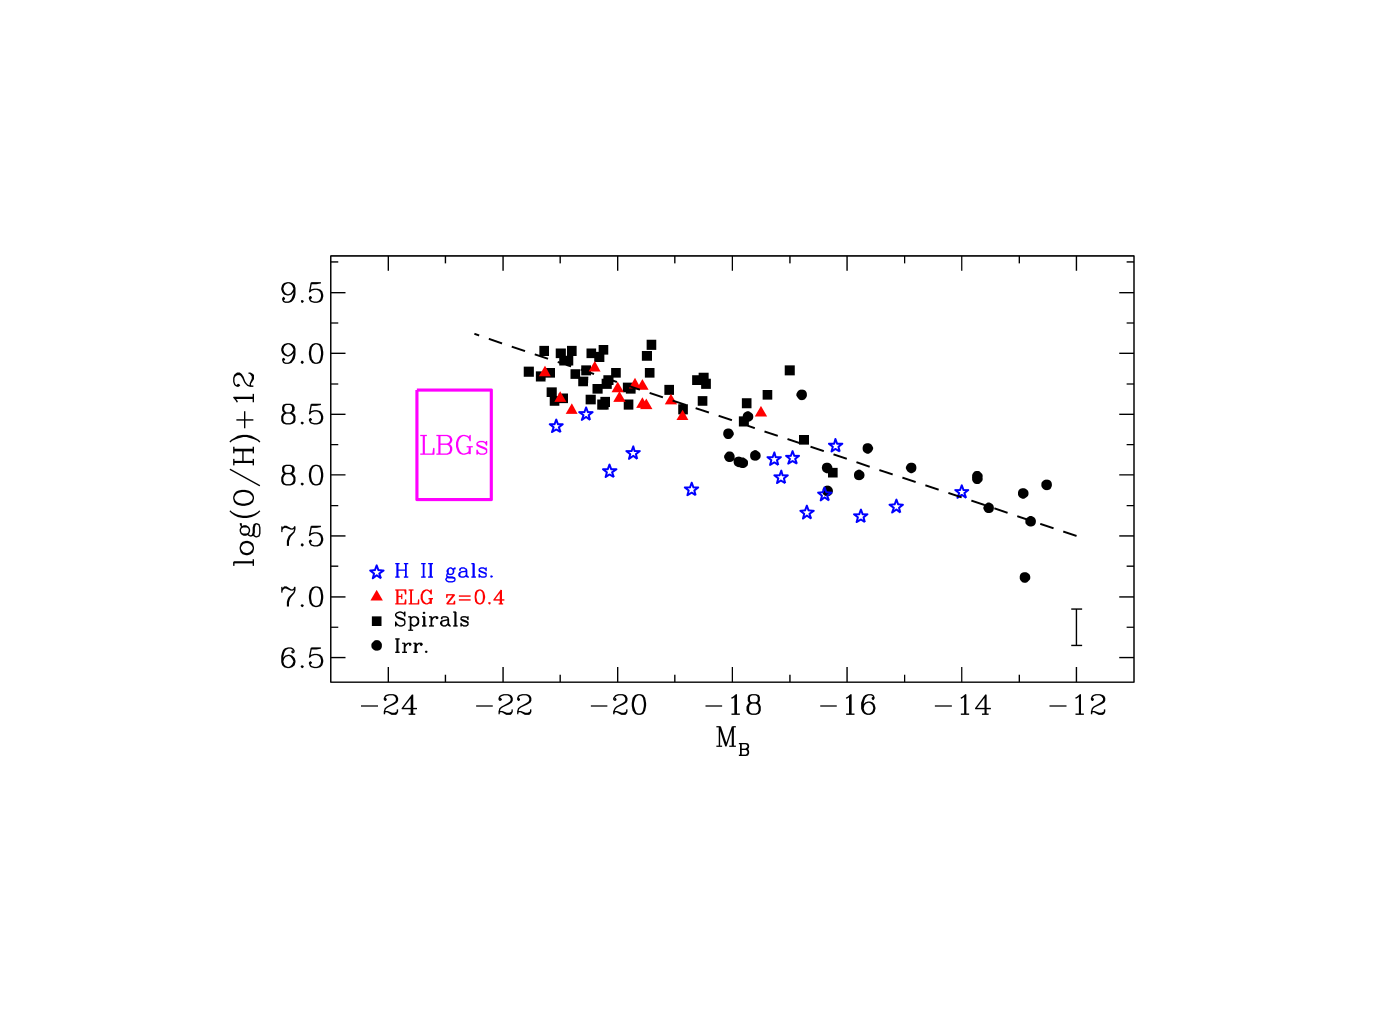
Present-day galaxies exhibit a clear trend between -band luminosity and the oxygen abundance of their H II regions (e.g. Skillman, Kennicutt, & Hodge 1989). This metallicity-luminosity relation extends across morphological types and over 9 magnitudes in luminosity, and appears to hold at least back to (Kobulnicky & Zaritsky 1998). Presumably it reflects the fundamental role which galaxy mass plays in determining the degree of chemical enrichment of the interstellar medium, through either the rate at which elements are produced by star formation, or the ease with which they can escape the gravitational potential of the galaxy (or both). It is clearly of interest to assess whether Lyman break galaxies conform to this relation. We address this question in Figure 7, where the low redshift points are from the compilation by Kobulnicky & Koo (2000) after adjustment to our cosmology (we refer the reader to that paper for references to the individual sets of measurements). The box showing the location of the Lyman break galaxies encompasses the range of values of (O/H) determined for the five LBGs above, and the range of rest-frame -band luminosities for the full sample (excluding West MMD11 which is atypical). Values of were deduced from the observed (or estimated) -band magnitudes and are listed in column 4 of Table 4 in §6.1 below.666Strictly speaking, at the median the observed -band corresponds to wavelengths between rest-frame and . However, the small -corrections to rest-frame (Shapley et al. in preparation) are unimportant for the purpose of the present discussion.
It is evident from Figure 7 that LBGs at
do not conform to today’s metallicity-luminosity
relation, as already noted by Kobulnicky & Koo (2000).
Even allowing for the
uncertainties in the determination of (O/H)
discussed above, LBGs fall below
the local line of best fit and have much lower
oxygen abundances than expected for their luminosities.
This is a secure statement; for our objects to fall
on the line, their metallicities would have to be
well above solar. In this regime
(log in Figure 6), as is
the case in present-day nuclear starbursts
(Ho, Filippenko, & Sargent 1997),
whereas in all our galaxies
.
The most obvious interpretation
of this result is that Lyman break galaxies
have mass-to-light ratios which are significantly lower
than those which apply to the normal galaxy
population at the present epoch (see also §6.1 below).
In this respect, they are more extreme examples
of today’s H II galaxies, which also tend to lie
below the line of best fit in Figure 7.
Another possibility is that the whole
metallicity-luminosity relation is displaced to
lower abundances at high redshifts,
when the universe was younger and the total interval
of time available for the accumulation
of the products of stellar nucleosynthesis was shorter.
It should be possible to determine the
magnitude of this second effect by measuring the
oxygen abundance in known samples of galaxies at ,
a project which is within the capabilities of current instrumentation.
6 Kinematics
6.1 Velocity Dispersions
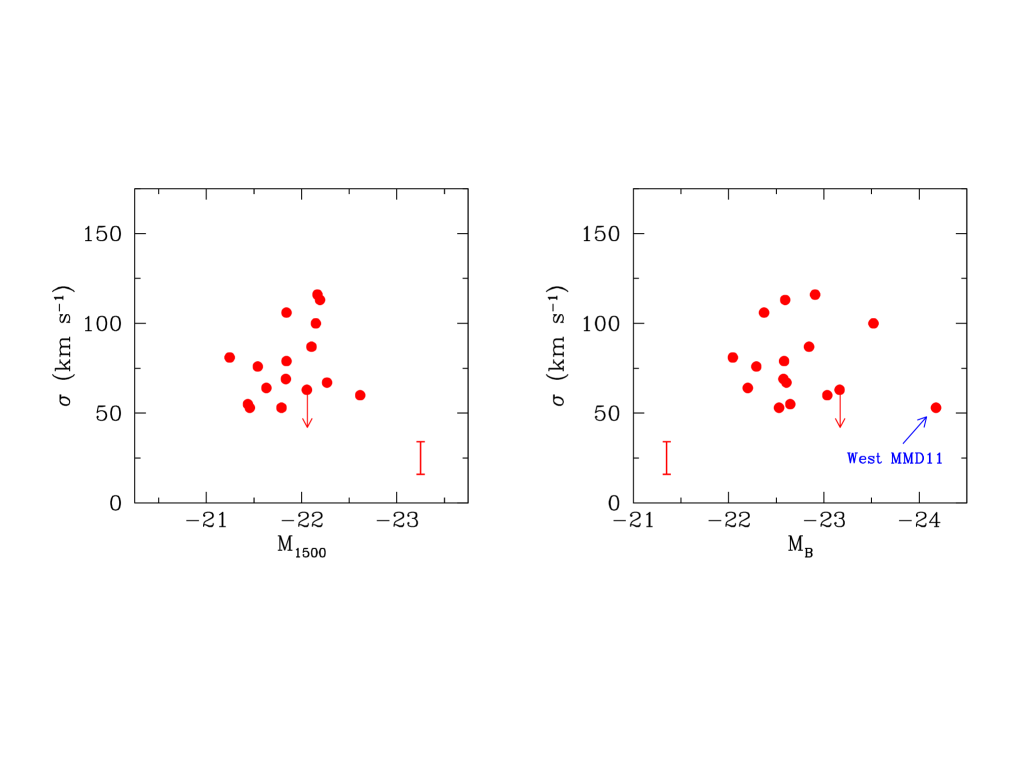
The one parameter which is most easily measured from our data is , the one dimensional velocity dispersion of the H II gas along the line of sight, since all that is required is the detection of one line (usually [O III] ). Accordingly, this is the physical quantity for which we have the most extensive set of values, 16 in total. They are listed in column (7) of Table 4 (after correction for the instrumental broadening) and plotted in Figure 8 vs. the far-UV and -band luminosities (deduced from the observed and magnitudes as explained in §4 and §5.1 respectively). It can be seen from the Table and Figure that the galaxies in our sample exhibit a relatively narrow range of values of , between and km s-1. The median value is km s-1.
In Pettini et al. (1998) we used the velocity dispersions of the nebular lines to estimate the masses of the LBGs observed; the enlarged data set available now essentially confirms the conclusion of that work that . In the idealized case of a sphere of uniform density,
| (4) |
or
| (5) |
where is the gravitational constant and is the half-light radius. HST images of Lyman break galaxies obtained with WFPC2 and NICMOS show that they typically have –0.4 arcsec, irrespectively of whether they are observed in the rest-frame UV or optical light (Giavalisco et al. 1996; Dickinson 2000; Calzetti & Giavalisco 2000). In our cosmology, arcsec corresponds to kpc and the median km s-1 therefore translates to .
A similar value would result for a disk-like geometry. Extensive simulations by Rix et al. (1997), including random orientation and other effects, have shown that , where is the maximum circular velocity of the ionized gas. Since presumably is reached at radii , the enclosed dynamical mass is not very different from the value of obtained from eq.(5) . It is likely, however, that these masses do not reflect the whole gravitational potential of the galaxies but rather refer mainly to the central, high surface brightness regions. Locally, it is found that in nuclear starbursts and blue compact galaxies the optical emission lines do not span the full extent of the rotation curve traced by the 21 cm line of H I (Lehnert & Heckman 1996; Pisano et al. 2001).
When combined with the median of our sample (uncorrected for extinction), the above mass estimate implies mass-to-light ratios in solar units. Not surprisingly, this value is much lower than those measured in the inner regions of galaxies today, which are in the range 2 – 10 (e.g. Binney & Tremaine 1987). Note that this increase in luminosity for a given mass by a factor of —or 3.7 magnitudes in —is similar to the horizontal offset of LBGs from today’s metallicity-luminosity relation shown in Figure 7. Thus, our galaxies seem to have mass-to-light ratios typical of young stellar populations. From the Starburst99 models of Leitherer et al. (1999), adjusted to a lower mass limit , we find that is intermediate between the values appropriate to continuous star formation lasting for () and () years. This result is in good agreement with the conclusion by Shapley et al. (in preparation) that the optical to near-IR spectral energy distributions of most LBGs in their sample are indeed indicative of ages between and years.
Nevertheless, it remains to be established whether in Lyman break galaxies at the line widths we measure do reflect mostly the overall velocity dispersion among different star-forming regions—the underlying assumption to using them as tracers of mass—as opposed to being dominated by outflows and other large-scale motions of a non-gravitational origin (see §6.3 below). It is evident from Figure 8 that there no correlation between velocity dispersion and either UV or optical luminosity. While it could be argued that any such trend would be difficult to discern given the small sample size and the narrow range of absolute magnitudes probed, we are struck by the results of Adelberger et al. (in preparation). Their much larger (several hundred) sample of Balmer break galaxies at not only exhibits values of between and km s-1, similar to those found here, but also shows no correlation between velocity dispersion and luminosity over a range of nearly five magnitudes.777This result is not necessarily in conflict with the work of Vogt et al. (1997) who found the Tully-Fisher relation to hold, with only mild evolution, out to . These authors specifically targeted galaxies with disk morphologies for their study, while the Balmer break galaxies selected by Adelberger et al. are a much more heterogeneous sample. Thus, until the physical origin of the broadening of the nebular lines in Lyman break galaxies is clarified. it would be unwise to draw far-reaching conclusions from the mass estimates derived above.
6.2 Spatially Resolved Line Profiles
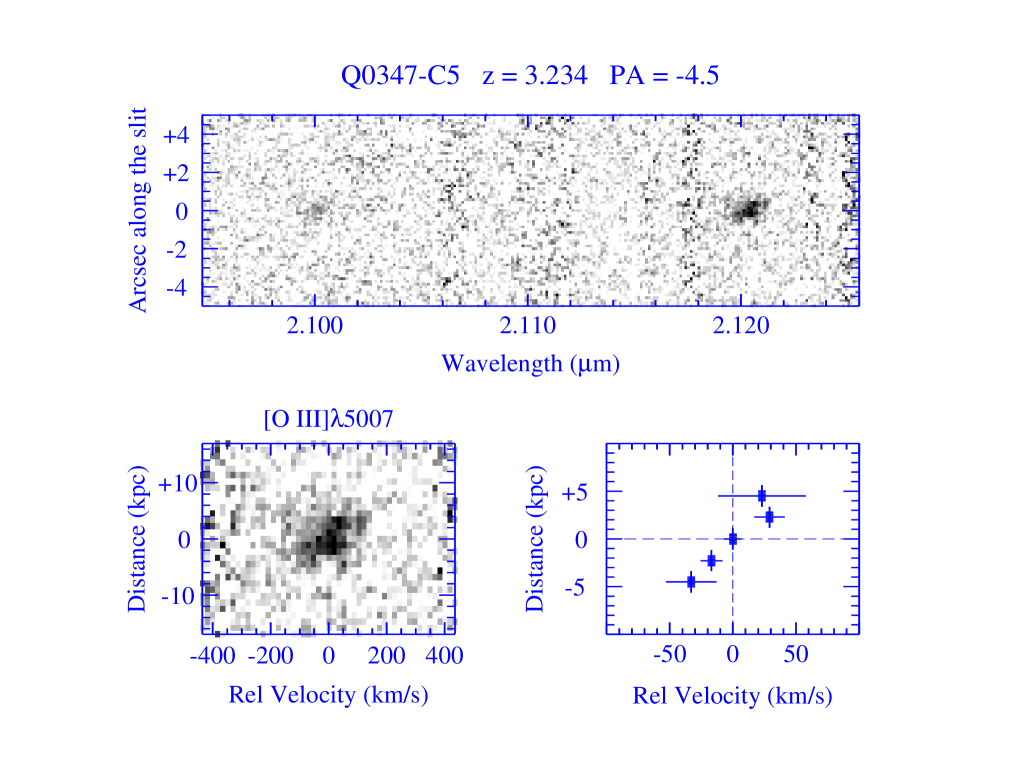
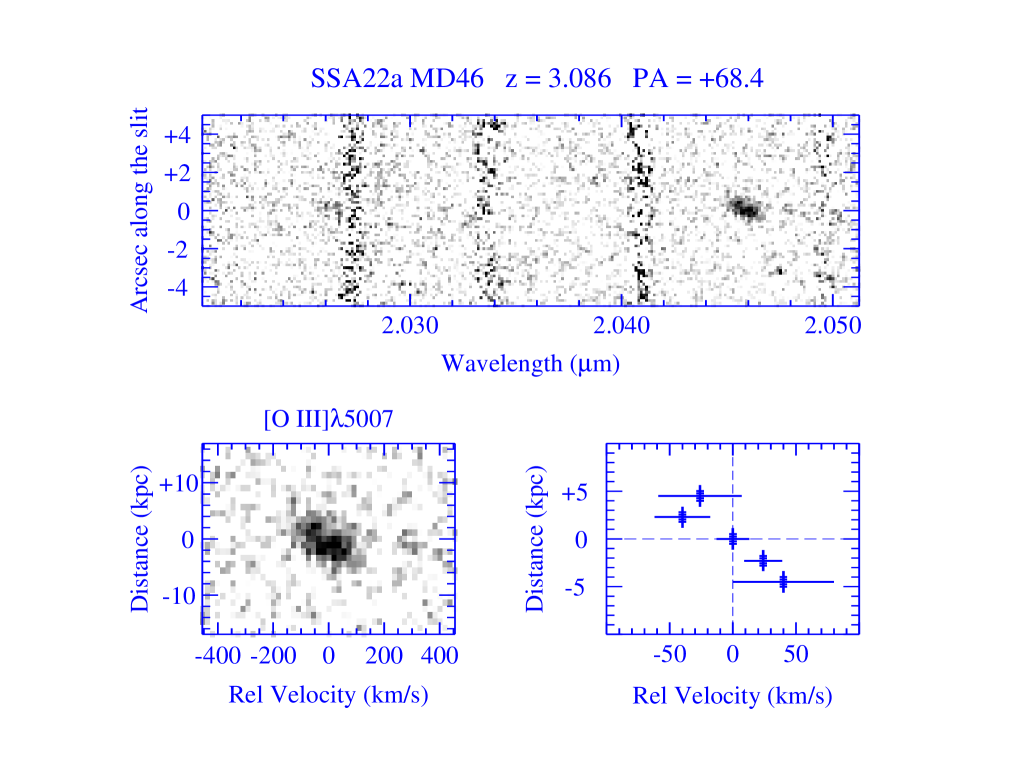
We can try and address this last question with ISAAC observations of two of our objects, Q0347383 C5 and SSA22a MD46, where we unexpectedly discovered spatially resolved emission along the spectrograph slit. As can be seen from Figures 9 and 10, the [O III] doublet lines are tilted in the 2-D images of these galaxies, hinting at a regular pattern of velocities as may be produced by a rotating disk. A third such case (out of a sample of six objects) has recently been reported by Moorwood et al. (2000) from H observations of a galaxy at . However, these authors found larger velocity spreads—and consequently deduced larger masses—than determined here, as we now discuss.
To investigate the kinematics of the ionized gas, we extracted the spectra in intervals of two spatial increments, each 0.146 arcsec on the sky. In this way we optimally sampled the seeing profile which was measured to have FWHM = 0.62 and 0.64 arcsec on the final stacked 2-D images obtained with integration times of 18 000 and 14,400 s for Q0347383 C5 and SSA22a MD46 respectively.888Recall that all the ISAAC observations included a bright star on the spectrograph slit; this stellar spectrum conveniently provides a measure of the seeing and an astrometric reference point. At the redshifts of these two galaxies, and 3.0855 respectively, we sample the spatial structure of the emission at projected intervals on the sky of kpc in our cosmology.
The bottom right-hand panels in Figures 9 and 10 show the runs of relative velocities along the slit, measured from the central wavelengths of [O III] by Gaussian fitting. The velocity ranges spanned by the line centres are small, only about and km s-1 in Q0347383 C5 and SSA22a MD46 respectively, over linear projected distances of kpc. Taken at face value, these measurements would imply much smaller masses than derived at §6.1 above, . However, in reality this value is a very conservative lower limit to the enclosed mass of ionized gas because in each case: (a) the line profiles are only just resolved spatially, and the whole ‘rotation curve’ on either side of the center is sampled with only two points999It is easy to see that, as each sample point is an average over regions with different velocities in a rising rotation curve, the net effect is an underestimate of since the the emission line intensity decreases from the center of the galaxy.; (b) we do not know the inclination angle of the galaxy; and (c) we do not know the orientation of the spectrograph slit relative to the major axis of the galaxy (if we are indeed dealing with disks).101010The slit orientation on the sky was dictated by the location of the offset star relative to the LBG—see §2.1 .
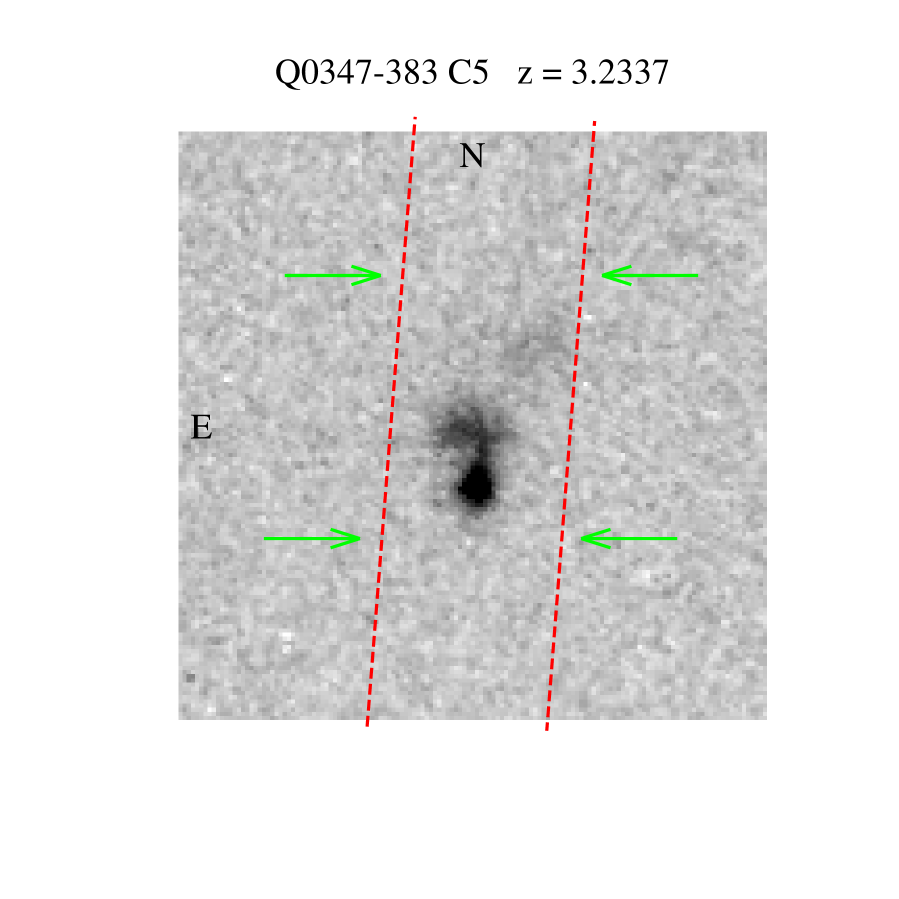
We can check on points (b) and (c) by examining existing high resolution images of these two LBGs. Q0347383 C5 was part of the WFPC2 sample of Giavalisco et al. (1996)111111The galaxy was labeled 0347383–N05 in that paper.; in Figure 11 we show the image obtained by combining ten dithered 1800 s exposures through the F702W filter (which is a very close match to our ) filter) after ‘drizzling’ onto a master output pixel grid (Fruchter & Hook 1998). Overlaid on the WFPC2 image is the location on the sky of the 1 arcsec wide ISAAC slit. Q0347383 C5 exhibits an irregular morphology, with a knot of intense UV emission and extensions of lower surface brightness to the north. The horizontal arrows in Figure 11 delimit the location of the [O III] emission which is clearly not coincident with the UV light121212In this case we can register precisely the ISAAC 2-D spectrum and the WFPC2 image because they both include the bright QSO Q0347383 which is located only 26.7 arcsec away from the LBG.. With hindsight this is not totally unexpected; some possible causes have been considered in §4. Similar differences in the spatial distributions of H II regions and stellar UV continuum have been observed in nearby starburst galaxies, albeit on smaller scales (e.g. Leitherer et al. 1996). Although the spectrograph slit was fortuitously aligned so as to encompass the extended structure revealed by the WFPC2 image, one can hardly interpret such structure as evidence for a rotating disk, or hazard a guess as to the inclination angle on the sky. Furthermore, some of the apparent rotation in Figure 9 may in reality be an instrumental effect caused by the clumpy structure of the galaxy, if knots of peak [O III] emission are centered at different locations across the slit.
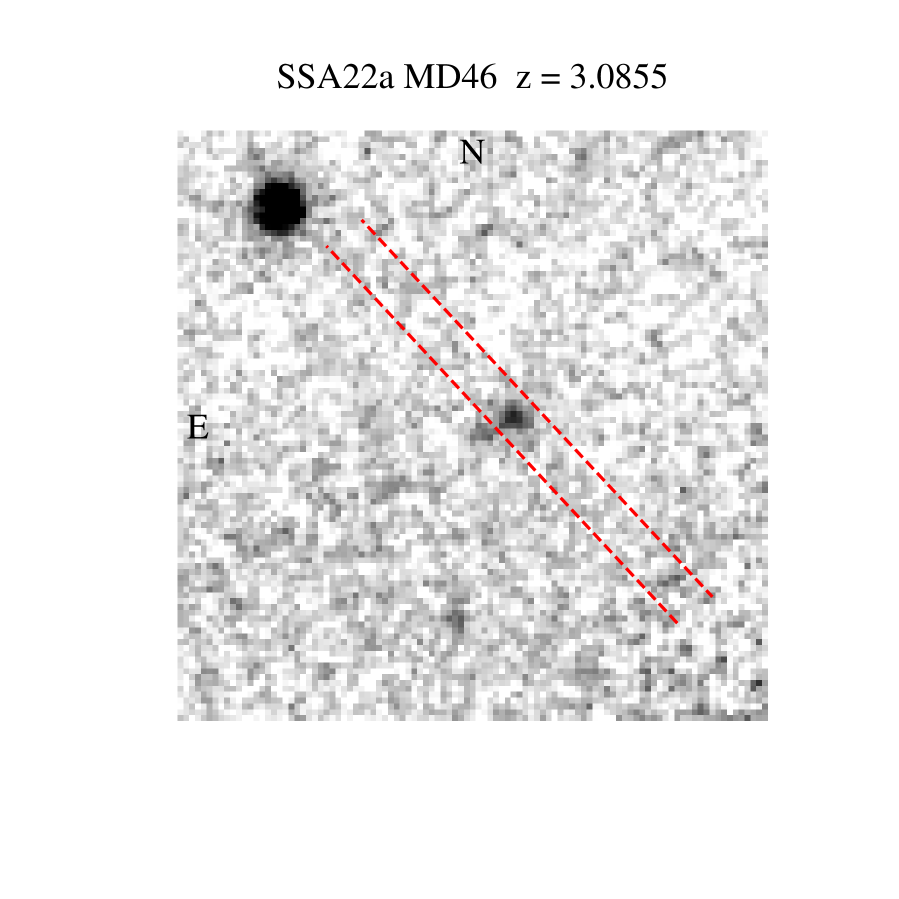
In Figure 12 we have overlaid the ISAAC slit on a -band image of SSA22a MD46 obtained with NIRC as part of the survey by Shapley et al. (in preparation). In this case our IR spectrum missed a second knot of continuum emission which evidently fell outside the spectrograph slit; it would be interesting to repeat the observation with the slit rotated by 90 degrees so as to probe the kinematics of the gas along the apparent elongation axis of this galaxy.
In summary, while in neither case do we find conclusive evidence
supporting the hypothesis that the extended [O III] emission
traces a rotation curve,
these initial results are nevertheless intriguing.
Looking ahead, it should be possible to investigate
more extensively the velocity and spatial structure
of Lyman break galaxies by combining high resolution
imaging with spatially resolved spectroscopy;
this task will be accomplished most effectively
with near-IR spectrographs
fed by adaptive optics systems.
6.3 Large-scale Motions
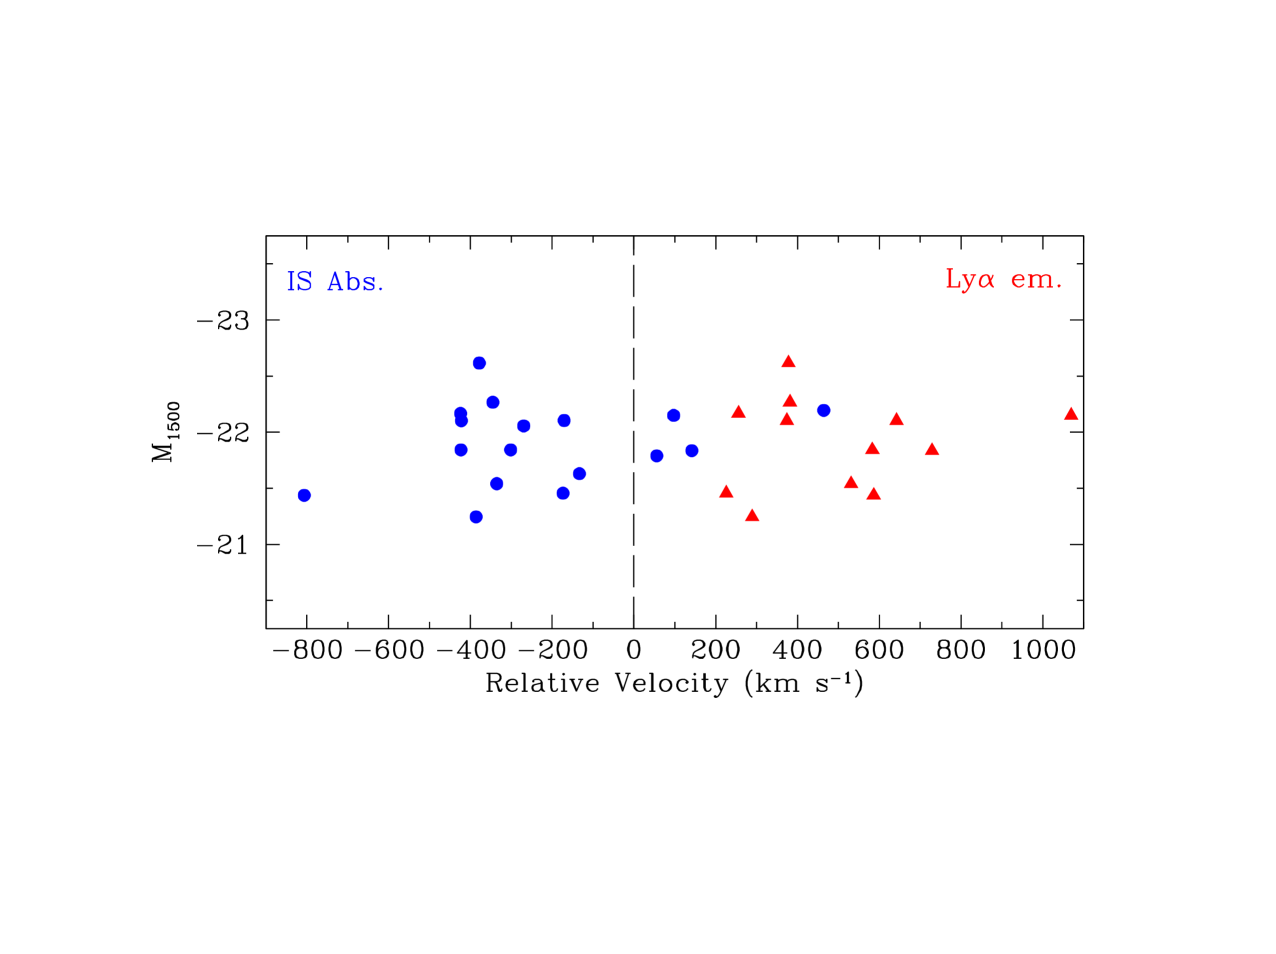
For 17 LBGs we can compare the redshift of the nebular emission lines, , listed in column (2) of Table 4, with the redshift of the interstellar absorption lines, ; for a subset of 13 objects we can also include in the comparison the redshift of the Lyman emission line, . Values of and can be found in columns (5) and (4) of Table 1 respectively. The former is the mean of all the UV interstellar absorption lines (generally three or more) between 1250 and 1700 Å which could be identified in our LRIS spectra; we refer the reader to Pettini et al. (2000) for a list of the strongest transitions. The latter was measured either by gaussian fitting or from the peak of the emission, depending on the shape of the Lyman emission line. If, as a working assumption, we adopt the values of as the systemic redshifts of the galaxies, we can convert and to the relative velocities listed respectively in columns (5) and (6) of Table 4 and plotted in Figure 13.
These data reveal a clear pattern in the kinematics of the interstellar medium of Lyman break galaxies when probed with these three different tracers. In three quarters of the objects observed the interstellar absorption lines are blueshifted relative to the H II region emission lines, while in all cases Lyman emission is redshifted. is typically between and km s-1, with a median value of km s-1; values of span a larger range, from to km s-1. A similar effect was already evident in the small sample of Pettini et al. (1998); the new data show it to be a characteristic shared by most Lyman break galaxies. There is no evidence for any dependence of these large velocity offsets on either the far-UV or optical luminosities of the galaxies within the magnitude interval in and probed by the present study.
The simplest interpretation—and undoubtedly an oversimplification of a more complex physical picture—is that we are seeing galactic scale outflows driven by the mechanical energy deposited by supernovae and stellar winds in these actively star forming galaxies. Presumably the gas seen in absorption in front of the stars is the approaching part of an expanding shell of swept-up material which has a very high optical depth to Lyman photons; thus the only Lyman emission detectable along our line of sight is from the back of the shell, behind the stars, receding at velocities where no foreground absorption takes place. This behavior of the Lyman line is commonly seen in local H II galaxies (Kunth et al. 1998) and has been modelled extensively by Tenorio-Tagle et al. (1999) among others. In MS 1512-cB58, where km s-1, Pettini et al. (2000) deduced a mass outflow rate yr-1, comparable to the star formation rate SFR yr-1 (Table 2). Since both the value of SFR and of in MS 1512-cB58 are typical of the present sample of LBGs, it would appear that luminous Lyman break galaxies are generally the sites of powerful superwinds involving a mass in baryons comparable to that being turned into stars.
In this and many other respects the properties of the superwinds we see at are very similar to those observed in nearby starburst galaxies and reviewed extensively by Heckman (e.g. Heckman 2000). In the local universe they are found in galaxies with high rates of star formation per unit area, yr-1 kpc-2; this threshold is exceeded by one order of magnitude by the LBGs considered here, which have typical SFR yr-1 and half-light radii kpc. Similar outflow rates and speeds are involved at high and low redshift; Heckman et al. (2000) calculate that the kinetic energy required is % of the total kinetic energy supplied by the starburst.
Galactic superwinds have several important
astrophysical consequences which have
already been considered
in the review by Heckman (2000); here we
limit ourselves to a few comments of particular
significance at high redshift.
First, the data in Figure 13, and the mass outflow rates
they imply, provide a vivid empirical demonstration
of the feedback process required to regulate
star formation in nearly all theoretical models
of galaxy formation (e.g. Efstathiou 2000; Cole et al. 2000).
Second, the results of §5 show Lyman break galaxies to be
the most metal-enriched structures at ,
apart from QSOs (Pettini 2000).
A significant fraction of these metals will probably
be lost from the galaxies altogether, since the measured values
of are comparable to
the escape velocities (Heckman 2000;
Ferrara, Pettini, & Shchekinov 2000). While it is still
unclear how far this metal-enriched gas will
travel (Ferrara et al. 2000; Aguirre et al. 2001),
there is at least the potential for
seeding large volumes around the galaxies
with the products of stellar nucleosynthesis.
Furthermore, if most of the metals carried away by galactic superwinds
remain in a hot phase, yet to be directly observed,
this may help solve the puzzle of the missing metals
at high redshift (Pettini 1998; Pagel 2000).
Third, in any flattened geometry, it is likely
that the expanding superbubbles
will ‘punch holes’ through the interstellar medium
in the direction of the vertical pressure gradient.
Such cavities would allow
Lyman continuum photons to leak into the IGM.
The common occurrence of superwinds in Lyman break galaxies
may then provide a plausible explanation for the high escape
fraction of ionizing photons suggested by the
recent results of Steidel et al. (2001).
Thus, the mechanical energy deposited
by the star formation episodes themselves
may well be the key physical process
ultimately responsible for reionizing of the universe
at high redshift.
7 Summary and Conclusions
We have presented the first results of a spectroscopic survey of Lyman break galaxies in the near infrared, aimed at detecting nebular emission lines of [O II], [O III] and H with the NIRSPEC and ISAAC instruments on the Keck and VLT telescopes respectively. Together with observations from the literature, we have constructed a sample of data for 19 LBGs, the largest considered so far. The galaxies are drawn from the bright end of the luminosity function, from to . Their near-IR spectra have been analysed to investigate the star formation rates, dust obscuration, oxygen abundances, and kinematics of the normal galaxy population at . The main results of this work are as follows.
(1) The LBGs observed form a very uniform sample in their near-IR properties. The spectra are dominated by the emission lines, and the continuum is detected in only two objects, one of which—West MMD11—has an unusually red optical-to-infrared color with () . In all cases [O III] is stronger than H and [O II]. The line widths span a relatively small range, with values of the one dimensional velocity dispersion between 50 and 115 km s-1.
(2) The star formation rates deduced from the luminosity of the H emission line agree within a factor of with the values implied by the continuum luminosity at 1500 Å before any corrections for dust extinction are applied . There is no trend in the present sample for the former to be larger than the latter, as may have been expected from the shape of all reddening curves which rise from the optical to the UV. Evidently, any such differential extinction must be small compared with the uncertainties in calibrating these two different measures of the SFR. This conclusion is in agreement with the results of similar recent studies of UV-selected star-forming galaxies at and contradicts the commonly held view that the Balmer lines are more reliable star formation indicators than the UV continuum—from our sample one would obtain essentially the same star formation rate density using either method.
(3) In five cases (four new ones and one previously published) we attempted to deduce values of the abundance of oxygen by applying the familiar method which has been extensively used in local H II regions. We found that generally there remains a significant uncertainty, by up to 1 dex, in the value of (O/H) because of the double-valued nature of the calibrator. Thus, in the galaxies observed oxygen could be as abundant as in the interstellar medium near the Sun, or as low as solar. While this degeneracy can in principle be resolved by measuring the [N II]/H ratio (and in the one case where this has proved possible values of (O/H) near the upper end of the range are indicated), this option is not normally available for galaxies at because the relevant lines are redshifted beyond the -band.
Even so, it is still possible to draw some interesting conclusions. First, LBGs are definitely more metal-rich than damped Lyman systems at the same epoch, which typically have metallicities . This conclusion is consistent with the view that DLAs are drawn preferentially from the faint end of the galaxy luminosity function and are not the most actively star forming galaxies, as indicated by essentially all attempts up to now to detect them via direct imaging. Second, LBGs do not conform to today’s metallicity-luminosity relation and are overluminous for their oxygen abundance. This is probably an indication that they have relatively low mass-to-light ratios, as also suggested by their kinematical masses; a further possibility is that the whole (O/H) vs. correlation shifts to lower metallicities at high , when galaxies were younger.
(4) If the emission line widths reflect the relative motions of H II regions within the gravitational potential of the galaxies, the implied masses are of the order of within half-light radii of kpc. This is likely to be a lower limit to the total masses of the galaxies as would be obtained, for example, if we could trace their rotation curves. A more serious uncertainty, however, is the real origin of the velocity dispersions we measure. We do not see any correlation between and galaxy luminosity in either our limited sample nor in an on-going study by some of us of a much larger sample of galaxies at which span five magnitudes in luminosity and yet show very similar line widths to those found here. In two cases we have found hints of ordered motions in spatially resolved profiles of the [O III] lines, but attempts to use high resolution images to clarify whether they are indicative of rotating disks proved to be inconclusive.
(5) In all the galaxies observed we find evidence for bulk motions of several hundred km s-1 from the velocities of the interstellar absorption lines—which are systematically blueshifted—and Lyman emission—which is always redshifted—relative to the nebular emission lines. We interpret this effect as indicative of galaxy-wide outflows which appear to be a common characteristic of galaxies with large rates of star formation per unit area at high, as well as low, redshifts. Such ‘superwinds’ involve comparable amounts of matter as is being turned into stars (the mass outflow rate is of the same order as the star formation rate) and about 10% of the total kinetic energy delivered by the starburst. Furthermore, they have a number of important astrophysical consequences. They provide self-regulation to the star formation process; can distribute the products of stellar nucleosynthesis over large volumes (the outflow speeds often exceed the escape velocities); may account for some of the ‘missing’ metals at high redshift; and may also allow Lyman continuum photons to leak from the galaxies into the intergalactic medium, easing the problem of how the universe came to be reionized. On the other hand, the existence of such large velocity fields within Lyman break galaxies makes it difficult to measure precisely their systemic redshifts (as may be required, for example, for detailed clustering studies) unless more than one marker is available.
(6) Finally, we point out some instrumental developments
which in our view will greatly aid further progress in this field.
In particular,
we consider that future spectrographs
making use of adaptive optics and incorporating
multi-object and integral field facilities
will prove to be particularly
beneficial for the study of high
redshift galaxies at near-IR wavelengths.
We are indebted to the staff of the Paranal and Keck observatories for their expert assistance with the observations. We are especially grateful to Chip Kobulnicky for generously providing the low redshift data shown in Figure 7, for communicating results in advance of publication, and for valuable comments which improved the paper. We acknowledge helpful conversations with Stephane Charlot, Bernard Pagel, and Roberto Terlevich. C.C.S. and K.L.A. have been supported by grants AST 95-96229 and AST 00-70773 from the US National Science Foundation and by the David and Lucile Packard Foundation.
References
- (1) Adelberger, K.L., & Steidel, C.C. 2000, ApJ, 544, 218
- (2) Aguirre, A., Hernquist, L., Weinberg, D., Katz, N., & Gardner, J. 2001, ApJ, submitted (astro-ph/0006345)
- (3) Bell, E.F. & Kennicutt Jr., R.C. 2001, ApJ, in press (astro-ph/0010340)
- (4) Binney, J., & Tremaine, S. 1987, Galactic Dynamics, (Princeton:University Press)
- (5) Bunker, A.J., Moustakas, L.A., & Davis, M. 2000, ApJ, 531, 95
- (6) Bunker, A.J., Warren, S.J., Clements, D.L., Williger, G.M., & Hewett, P.C. 1999, MNRAS, 309, 875
- (7) Calzetti, D. 1997, in The Ultraviolet Universe at at Low and High Redshift: Probing the Progress of Galaxy Evolution, ed. W.H. Waller, M.N. Fanelli, J.E. Hollis, & A.C. Danks AIP Conference Proceedings 408, (New York:Woodbury), 403
- (8) Calzetti, D., & Giavalisco, M. 2000, Ap & Sp Sci, in press (astro-ph/0012068)
- (9) Chapman, S.C., Scott, D., Steidel, C.C., Borys, C., Halpern, M., Morris, S.L., Adelberger, K.L., Dickinson, M., Giavalisco, M., & Pettini, M. 2000, MNRAS, 319, 318
- (10) Charlot, S. & Longhetti, M. 2001, MNRAS, in press (astro-ph/0101097)
- (11) Cole, S., Lacey, C.G., Baugh, C.M., & Frenk, C.S. 2000, MNRAS, 319, 168
- (12) Colina, L., Bohlin, R., & Castelli, F. 1996, Absolute Flux Calibration Spectrum of Vega, STScI Instrument Science Report OSG-CAL-96-01 (Baltimore: STScI)
- (13) Cuby, J.G., Barucci, A., de Bergh, C., Emsellem, E., Moorwood, A.F.M., Petr, M., Pettini, M., & Tresse, L. 2000, Proc. SPIE, 4005, 212
- (14) Dickinson, M. 2000, Philos. Trans. R. Soc. Lond. A, 358, 2001
- (15) Efstathiou, G. 2000, MNRAS, 317, 697
- (16) Ellingson, E., Yee, H.K.C., Bechtold, J., & Elston, R. 1996, ApJ, 466, L71
- (17) Ellison, S.L., Pettini, M., Steidel, C.C. & Shapley, A.E. 2001, ApJ, 549, in press.
- (18) Esteban, C., Peimbert, M., Torres-Peimbert, S., & Escalante, V. 1998, MNRAS, 295, 401
- (19) Ferrara, A., Pettini, M., & Shchekinov, Y. 2000, MNRAS, 319, 539
- (20) Fruchter, A.S., & Hook, R.N. 1998, PASP, submitted (astro-ph/9808087)
- (21) Gallego, J., Zamorano, J., Aragón-Salamanca, A., & Rego, M. 1995, ApJ, 455, L1
- (22) Giavalisco, M., Steidel, C.C., & Macchetto, D. 1996, ApJ, 470, 189
- (23) Glazebrook, K., Blake, C., Economou, F., Lilly, S., & Colless, M. 1999, MNRAS, 306, 843
- (24) Grevesse, N., & Sauval, A.J. 1998, Space Sci Rev, 85, 161
- (25) Heckman, T.M. 2000, in ASP Conf. Ser., Gas and Galaxy Evolution, ed. J.E. Hibbard, M.P. Rupen, & J.H. van Gorkom, (San Francisco:ASP), in press (astro-ph/0009075)
- (26) Heckman, T.M., Lehnert, M., Strickland, D., & Armus, L. 2000, ApJS, 129, 493
- (27) Ho, L.C., Filippenko, A.V., & Sargent, W.L.W. 1997, ApJ, 487, 579
- (28) Kennicutt Jr., R.C. 1998, ARA&A, 36, 189
- (29) Kobulnicky, H.A., Kennicutt Jr., R.C., & Pizagno, J.L. 1999, ApJ, 514, 544
- (30) Kobulnicky, H.A., & Koo, D.C. 2000, ApJ, 545, 712
- (31) Kobulnicky, H.A., & Zaritsky, D. 1998, ApJ, 511,188
- (32) Kulkarni, V.P., Hill, J.M., Schneider, G., Weymann, R.J., Storrie-Lombardi, L.J., Rieke, M.J., Thompson, R.I., & Jannuzi, B.T. 2000, ApJ, 536, 36
- (33) Kulkarni, V.P., Hill, J.M., Schneider, G., Weymann, R.J., Storrie-Lombardi, L.J., Rieke, M.J., Thompson, R.I., & Jannuzi, B.T. 2001, ApJ, in press (astro-ph/0012140)
- (34) Kunth, D., Mas-Hesse, J.M., Terlevich, E., Terlevich, R., Lequeux, J., & Fall, S.M. 1998, A&A, 334, 11
- (35) Lehnert, M.D., & Heckman, T.M. 1996, ApJ, 462, 651
- (36) Leitherer, C. 2000, in A Decade of HST Observations, ed. M. Livio, K. S. Noll, & M. Stiavelli (Cambridge: CUP), in press
- (37) Leitherer, C., Leão, J.R., Heckman, T.M., Lennon, D.J., Pettini, M., & Robert, C. 2001, ApJ, 550, in press
- (38) Leitherer, C., Schaerer, D., Goldader, J.D., González Delgado, R.M., Robert, C., Kune, D.F., de Mello, D.F., Devost, D., & Heckman, T.M. 1999, ApJS, 123, 3
- (39) Leitherer, C., Vacca, W.D., Conti, P.S., Filippenko, A.V., Robert, C., & Sargent, W.L.W. 1996, ApJ, 465, 717
- (40) Lowenthal, J., et al. 1997, ApJ, 481, 673
- (41) Madau, P. 1995, ApJ, 441, 18
- (42) McGaugh, S. 1991, ApJ, 380, 140
- (43) McLean, I.S., et al. 1998, Proc. SPIE, 3354, 566
- (44) Meyer, D.M., Jura, M., & Cardelli, J.A. 1998, ApJ, 493, 222
- (45) Moorwood, A.F.M., et al. 1999, ESO Messenger, 91, 9
- (46) Moorwood, A.F.M., van der Werf, P.P., Cuby, J.G., & Oliva, E. 2000, A&A, 362, 9
- (47) Osterbrock, D.E. 1989, Astrophysics of Gaseous Nebulae and Active Galactic Nuclei (Mill Valley:University Science Books)
- (48) Pagel, B.E.J. 2000, in Galaxies in the Young Universe, ed. H. Hippelein (Berlin:Springer-Verlag), in press (astro-ph/9911204)
- (49) Pagel, B.E.J., Edmunds, M.G., Blackwell, D.E., Chun, M.S., & Smith, G. 1979, MNRAS, 189, 95
- (50) Pettini, M. 1999, in Chemical Evolution from Zero to High Redshift, ed. J.R. Walsh, & M.R. Rosa (Berlin:Springer-Verlag), 233
- (51) Pettini, M. 2000, Philos. Trans. R. Soc. Lond. A, 358, 2035
- (52) Pettini, M., Ellison, S.L., Steidel, C.C. & Bowen, D.V. 1999, ApJ, 510, 576
- (53) Pettini, M., Kellogg, M., Steidel, C.C., Dickinson, M., Adelberger, K.L., & Giavalisco, M. 1998, ApJ, 508, 539
- (54) Pettini, M., Steidel, C.C., Adelberger, K.L., Dickinson, M., & Giavalisco, M. 2000, ApJ, 528, 96
- (55) Pilyugin, L.S. 2000, A&A, 362, 325
- (56) Pisano, D.J., Kobulnicky, H.A., Guzmán, R., Gallego, J., & Bershady, M.A. 2001, ApJ, submitted.
- (57) Prochaska, J.X., Gawiser, E., & Wolfe, A.M. 2001, ApJ, in press
- (58) Rix, H.W., Guhathahurta, P., Colless, M., & Ing, K. 1997, MNRAS, 285, 779
- (59) Rousselot, P., Lidman, C., Cuby, J.G., Moorels, G., & Monnet, G. 2000, A&A, 354, 1134
- (60) Salzer, J.J., Gronwall, C, Lipovetsky, V.A., Kniazev, A., Moody, J.W., Boroson, T.A., Thuan, T.X., Izotov, Y.I., Herrero, J.L., & Frattare, L.M 2000, AJ, 120, 80
- (61) Seitz, S., Saglia, R.P., Bender, R., Hopp, U., Belloni, P., & Ziegler, B. 1998, MNRAS, 298, 945
- (62) Skillman, E.D., Kennicutt Jr., R.C., & Hodge, P. 1989, ApJ, 347, 875
- (63) Steidel, C.C. 2000, Proc. SPIE, 4005, 222
- (64) Steidel, C.C., Adelberger, K.L., Giavalisco, M., Dickinson, M., & Pettini, M. 1999, ApJ, 519, 1
- (65) Steidel, C.C., Giavalisco, M., Pettini, M., Dickinson, M., & Adelberger, K.L. 1996, ApJ, 462, L17
- (66) Steidel, C.C., Pettini, M., & Adelberger, K.L. 2000, ApJ, 546 in press
- (67) Sullivan, M., Treyer, M.A., Ellis, R.S., Bridges, T.J., Milliard, B., & Donas, J. 2000, MNRAS, 312, 442
- (68) Tenorio-Tagle, G., Silich, S.A., Kunth, D., Terlevich, E., & Terlevich, R. 1999, MNRAS, 309, 332
- (69) Teplitz, H.I., et al. 2000a, ApJ, 542, 18
- (70) Teplitz, H.I., et al. 2000b, ApJ, 533, L65
- (71) Terlevich, R.J., Denicolo, G., & Terlevich, E. 2001, in
- (72) Terlevich, R., Melnick, J., Masegosa, J., Moles, M., & Copetti, M.V.F. 1991, A&AS, 91, 285
- (73) Tresse, L., & Maddox, S.J. 1998, ApJ, 495, 691
- (74) van der Bliek, N.S., Manfroid, J., & Bouchet, P. 1996, A&AS, 119, 547
- (75) Vogt, N.P., Phillips, A.C., Faber, S.M., Gallego, J., Gronwall, C., Guzmán, R., Illingworth, G.D., Koo, D.C., & Lowenthal, J.D. 1997, ApJ, 479, L121
- (76) Yan, L., McCarthy, P.J., Freudling, W., Teplitz, H.I., Malmumuth, E.M., Weymann, R.J., & Malkan, M.A. 1999, ApJ, 519, L47
![[Uncaptioned image]](/html/astro-ph/0102456/assets/x1.png)
![[Uncaptioned image]](/html/astro-ph/0102456/assets/x2.png)
![[Uncaptioned image]](/html/astro-ph/0102456/assets/x3.png)
![[Uncaptioned image]](/html/astro-ph/0102456/assets/x4.png)