DETECTION OF C3 IN DIFFUSE INTERSTELLAR CLOUDS
Abstract
The smallest polyatomic carbon chain, C3, has been identified in interstellar clouds (A1 mag) towards Ophiuchi, 20 Aquilae, and Persei by detection of the origin band in its electronic transition, near 4052Å. Individual rotational lines were resolved up to =30 enabling the rotational level column densities and temperature distributions to be determined. The inferred limits for the total column densities (1 to 2 cm-2) offer a strong incentive to laboratory and astrophysical searches for the longer carbon chains. Concurrent searches for C, C and C were negative but provide sensitive estimates for their maximum column densities.
1 Introduction
Carbon chains play a central role in the chemistry and spectroscopy of interstellar space. The detection of cyanopolyacetylenes in dense interstellar clouds (Kroto, 1981) led to the suggestion by Douglas (1977) that carbon chain species be considered as candidates for the diffuse interstellar bands (DIBs), which are found in the 4000-8500Å spectral region of stars reddened by interstellar dust (Herbig, 1995). Since then, many other molecules with a carbon chain backbone have been identified at radio frequencies in dense clouds (Kawaguchi et al., 1995). Meanwhile, advances in laboratory measurements have provided an understanding of the types and sizes of carbon chains which have strong electronic transitions in the DIB range (Maier, 1998). It is thus somewhat surprising that as yet among the bare carbon species only diatomic C2 has been identified in interstellar clouds where DIB are detected.
The 4052Å electronic band system of C3 was first detected in comets (Swings, 1942) and then in circumstellar shells by infrared spectroscopy (Hinkle et al., 1988). Most recently C3 was identified in a dense cloud using sub-mm measurements of its low frequency bending mode and Ntot(C3) cm-2 was estimated (Cernicharo et al., 2000). Snow et al. (1988) established an upper limit of 51010 cm-2 for the column density of C3 in the direction of Oph, some two orders of magnitude lower than that set by Clegg & Lambert (1982). Haffner & Meyer (1995) made a tentative detection of C3 towards an eighth magnitude star in the same part of the sky, HD 147889, at a column density of 41012 cm-2. Unfortunately, the star turned out to be a (previously unknown) double-lined spectroscopic binary which limited their sensitivity.
This letter presents the detection of C3 towards three stars and infers the column densities in the diffuse clouds. Although C, C and C were not detected, upper limits for their column densities are estimated. Diatomic species, such as CH, CN, C2, and CH+, have been detected towards two of the stars chosen and their column densities are considered standards with which to compare models for the physical and chemical processes in diffuse regions (van Dishoeck & Black, 1986). The four bare carbon chains, C3, C, C and C, were selected for the present search because gas phase electronic transitions for these species have been identified in the laboratory in the 4000-5500Å region and their oscillator strengths are known (see table 3).
2 The Observations
Observations of the reddened stars Oph (HD 149757), Per (HD 24398) and 20 Aql (HD 179406) were made with the Gecko echellette spectrograph on 2000 July 16 and 19, fiber fed from the Cassegrain focus of the Canada-France-Hawaii 3.6-m telescope (CFHT) (Baudrand & Vitry, 2000). All three stars have a visual extinction, Av, near 1 and were chosen because they are bright with sharp interstellar K I lines indicating either single clouds or little Doppler distortion (in the case of Oph, Cra97 resolved the C2 at 8756 Å into two close velocity components separated by 1.1 km s-1).
The detector was a rear illuminated EEV1 CCD (13.5 m2 pixels) and the spectral regions were centered at 4047 Å in the 14th order, and at 5060 Å and 5400 Å in the 11th and 10th orders, respectively. The ultraviolet Gecko prism was used to isolate the 14th order, the blue grism for the 11th order, while the stock CFHT filter #1515 was used for the 10th order observations. Individual spectra had exposure times ranging from 5 to 20 minutes and were obtained with continuous fiber agitation to overcome modal noise. The resulting combined spectra for the individual stars at each wavelength had unusually high signal-to-noise ratios (S/N800-4000) for CCD observations. The Th/Ar comparison arc spectra, taken before and after each spectrograph wavelength reconfiguration, had a typical FWHM of 2.8 pixels, which corresponds to resolutions of = 121000, 113000 and 101000 at 4047, 5060 and 5400 Å, respectively.
Processing of the spectra was conventional. Groups of biases were taken several times throughout each night and at each grating setting a series of flat-field spectra of a quartz-iodide lamp were recorded. The biases and appropriate flats were averaged and used to remove the zero-level offset and pixel-to-pixel sensitivity variations of the CCD. One-dimensional spectra were extracted using standard IRAF routines. Spectra of Vega and other unreddened stars were used to search for contaminating telluric water vapor lines and stellar photospheric features. Heliocentric corrections were applied to each spectrum.
The observations are summarised in Table 1 which lists exposure times and S/N per pixel for each spectral region. The final column gives the radial velocities measured from the interstellar K I 4044.1 and 4047.2 Å lines. These velocities have been applied to each spectrum to put the interstellar features on a laboratory scale.
3 The Results
The origin band of C3 is quite clearly detected towards all three stars. Figure 1 compares the observed spectra with a simulated C3 absorption spectrum based on the spectrograph resolution and assuming a Boltzmann distribution in the ground state rotational levels with a temperature of 80 K. The continuum noise level in the observations is 0.1 %. Low order polynomials have been applied to the stellar data to give a level continuum (base line) and, in the case of Per, a weak, broad stellar feature at 4053.2Å has been removed. Residual broad features in the final spectra are only a few tenths of a percent deep, much less than in the original, and they in no way mask the sharp C3 lines. In the simulation the rotational line intensities were calculated using the Hönl-London factors, while the line positions were taken from the laboratory measurements (this avoids the problem of a perturbation affecting the low ground state levels which is not accounted for by the fitted spectroscopic constants). The individual rotational P, Q and R lines are clearly resolved in the spectra of all three stars. Table 2 lists the observed positions and equivalent widths of each rotational line assigned in the spectra of the three stars. The table also gives the corresponding positions measured for these transitions in the laboratory (Gausset et al. 1965). The positions of some 30 lines in the spectrum of Oph agree with the laboratory data to within 0.1 cm-1 providing an unambiguous identification of C3 in these diffuse clouds.
Figures 2, 3, and 4 show the results of equivalent searches for origin band of C at 5078.1Å ( Oph only), the origin band of C at 5415.9Å and the origin band of C at 4040.4Å, together with simulated spectra for these transitions at 80 K based upon the published spectroscopic constants (Maier & Rösslein (1988), Herzberg & Lagerqvist (1968), Tulej et al. (2000)). In the cases of C and C the linewidth was assumed to be determined by the spectrograph resolution. For C the excited state has been identified as a short-lived Feshbach resonance and the measured natural linewidth of 1 cm-1 is employed in the simulation. Weak telluric lines were been removed from the C and C observations using standard procedures.
Unlike the 4050Å region for C3, each of these spectral regions is contaminated by weak stellar features. Nonetheless, for the C and C ions, there are no sharp features corresponding to the rotational lines in the simulations. On the other hand, for C there are features in the spectrum of Per and (much less convincing) in the magnified plot for Oph which appear to coincide in position and shape with the simulated band heads. It is unlikely that these are due to C because the stellar lines in Per have exactly the same shape as the coincident features. For Oph the whole C spectrum sits within a weak stellar feature (the lines are broadened by rapid rotation 400 km s-1). The photospheric lines in Oph show nonradial pulsation ‘ripples’ which will be ’washed out’ to some extent by the long exposure time employed. The spectrum of 20 Aql, which normally has the strongest interstellar lines of the three, is free of stellar features but has no features coincident with the C simulation. It is concluded that, while interstellar C might be absent for 20 Aql and present for the other two stars, it is more likely that in the latter cases the features are instead stellar.
Table 3 gives the measured equivalent widths for the most intense C3 line (Q(8)) for each star together with an 1 error estimate. For C, C and C, 3 detection limits are given. The 1 level errors and detection limits are derived from:
where the 1 limiting equivalent width, , and the FWHM of the feature, , are both measured in Å, the spectrograph dispersion, , in Å pixel-1, and S/N is the signal to noise per pixel. From the simulations, = 0.045, 1.0, 0.13 and 0.045Å for C3, C, C and C, respectively.
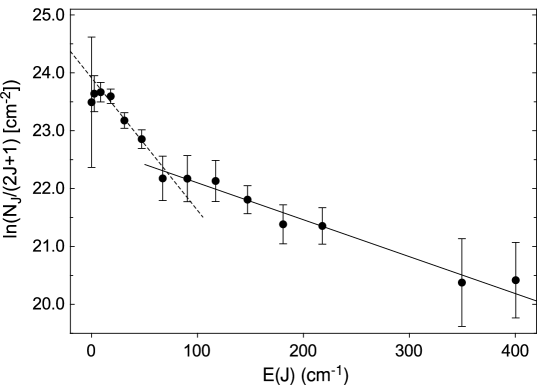
In the case of C3, equivalent widths, , were determined for each rotational line (varying between 0.3-2.7Å) and, in combination with the transition oscillator strength, f0-0, and Hönl-London factors, the column densities, (C3), of each rotational level () in the ground electronic state were calculated (Larsson, 1983). In cases where several rotational lines originating from the same level were assigned (e.g. P(8), Q(8), R(8)) the mean of the determined column densities was taken. Figure 5 shows a Boltzmann plot of ln() vs. the rotational energy (Gausset et al., 1965) where the slope is inversely proportional to the rotational temperature. Among the lowest rotational levels (14) the populations are reasonably approximated by a distribution at 50-70 K, whereas the higher rotational levels correspond to a temperature of 200-300 K. The simulation in Figure 1 uses 80 K as this represents an average temperature for the entire rotational population and allows both the high and low lines to be identified. The high temperature component of the distribution is apparent in the astronomical spectra where the R band head and the higher Q lines are more intense than in the simulation (Figure 1).
Lutz & Crutcher (1983) also found a bimodal population distribution for C2 in diffuse clouds, with similar characteristic temperatures for the low and high values. The lower temperature is interpreted as the kinetic energy of the cloud and for both C2 and C3 the values obtained are comparable to those used in models of diffuse clouds (van Dishoeck & Black, 1986). The higher temperature component is attributed to repopulation of the levels in the ground electronic state by radiative pumping from excited states. In the case of C3 it is expected that both the state and the higher lying state will contribute to the radiative pumping.
The sensitivity of these measurements is such that (C3) in the range 0.2-2 cm-2 is determined for rotational levels up to =30. The values were summed to give the estimated lower limits in the range 1-2 cm-2 for the total column density, (C3), in Table 3.
3.1 Discussion
A previous search for C3 in the direction of Oph did not identify the molecule (Snow et al., 1988). It is unclear why this was the case as, in the light of the present observations, the signal-to-noise quoted for these measurements was adequate and the upper limit given was some thirty times lower than the column density reported here. The present measurements for the column densities of C3 are of the same order of magnitude as the tentative estimate for a translucent cloud (Haffner & Meyer, 1995) and can be compared to those of other polyatomic molecules observed in diffuse interstellar clouds. Column densities (also towards Oph) in the 1012-13 cm-2 range have been inferred for HCO+, C2H and C3H2 from observations in the mm region by Lucas & Liszt (2000), while H has been identified in diffuse regions and Ntot(H) estimated cm-2 by McCall et al. (1998). Column densities of C2 towards Oph and Per have been determined in the 2-3 cm-2 range by Federman & Huntress (1989). A current model of the diffuse clouds by Ruffle & Herbst (2000) predicts Ntot(C2)/Ntot(C3) 20 (on a 105 year time scale), implying Ntot(C3) cm-2, in agreement with the values deduced from the Table 3. The main production route to C3 is presumed to be the dissociative recombination process: C3H+ + C3 + H, where C3H+ is produced from smaller species by C+ ion insertion. Under conditions where ultra-violet radiation penetrates, photodissociation of C3 takes place at a threshold of 1653Å. As the strong electronic transition of C3 is predicted to occur around 1700Å (Forney et al., 1996), the dissociation process, C3 C2 + C, may be an important destruction pathway in diffuse clouds.
Although only upper limits for the column densities of C, C and C could be presently established, these species are of interest as small ionic carbon fragments play a crucial role in the ion molecule schemes for diffuse cloud chemistry (Dalgano & Black, 1976). The C ion is the only bare carbon cation for which the gas phase electronic spectrum is known (Maier & Rösslein, 1988). In diffuse clouds it is supposed to be the product of the fundamental step: C+ + CH C + H. Its main destruction mechanism is hydrogenation: C + H2 C2H+ + H, which dominates over recombination with electrons in diffuse regions. The diffuse cloud model (Ruffle & Herbst, 2000) predicts a C abundance a factor of 10-3 lower than C2, implying a column density cm-2, in accord with the upper limit in Table 3.
Published models for diffuse regions do not include the smallest pure carbon anions, C and C in their reaction libraries. Unlike C, C does not react with H2 so its main destruction mechanism is expected to be photodetachment. The similar rotational line widths and oscillator strengths of the C and C transitions lead to similar upper limits for their total column densities. The width of the unresolved bands for C and the presence of weak stellar features in this spectral region means that a higher column density of this ion could have escaped detection.
The detection of C3 provides a powerful incentive for the laboratory study of the electronic transitions of longer carbon chains in the gas phase with the aim of comparison with DIB data. The question as to what types and sizes of carbon chains will have strong transitions in the 4000-9000Å range has already been answered: for example, transitions of the odd-number bare chains, C2n+1, =8-30 (Maier, 1998). The existence of linear carbon chains up to C21 has been confirmed by the observation of their electronic spectra in neon matrices (Wyss et al., 1999). As the oscillator strength scales almost linearly with the length of the molecule, one can expect f10-20 for these carbon chains. With such an oscillator strength, a species with a column density cm-2 would be enough to give rise to a strong DIB, with an equivalent width of 1Å. In view of the column density 1012 cm-2 for C3 determined in this work for three diffuse clouds, this appears to be a reasonable expectation.
References
- Baudrand & Vitry (2000) Baudrand J. & Vitry, R., 2000, Proc. SPIE, in press
- Becker et al. (1979) Becker, K. H., Tatarczyk, T. & Radic-Peric, 1979, J. Chem. Phys.Lett., 60, 502.
- Cernicharo et al. (2000) Cernicharo, J., Goicoechea, J. R. & Caux, E., 2000, ApJ, 534, L199.
- Clegg & Lambert (1982) Clegg, R. E. 5. & Lambert, D. L., 1982, MNRAS, 201, 723.
- Dalgano & Black (1976) Dalgano, A. & Black, J. H., 1976, Rep. Prog. Phys. 39, 573.
- Douglas (1977) Douglas, A. E., 1977, Nature, 269, 130.
- Federman & Huntress (1989) Federman, S. R. & Huntress, W. T.,1989, ApJ, 338, 140.
- Forney et al. (1996) Forney, D., Freivogel, P., Grutter, M. & Maier, J. P., 1996, J. Chem. Phys., 104, 4954.
- Gausset et al. (1965) Gausset, L., Herzberg, G., Lagerqvist, A. & Rosen, B., 1965, ApJ, 142, 45.
- Haffner & Meyer (1995) Haffner, L. M. & Meyer, D. M., 1995, ApJ, 453, 450.
- Herbig (1995) Herbig, G.H., 1995, ARA&A, 33, 19
- Herzberg & Lagerqvist (1968) Herzberg, G. & Lagerqvist, A., 1968, Can. J. Phys. 46, 2363.
- Hinkle et al. (1988) Hinkle, K. W., Keady, J. J. & Bernath, P. F., 1988, Science 242, 1319.
- Kawaguchi et al. (1995) Kawaguchi, K., Kasai, Y., Ishikawa, S. & Kaifu, N., 1995, Publ Astron. Soc. Japan 47,853.
- Kroto (1981) Kroto, H. W., 1981, Int. Rev. Phys. Chem. 1, 309.
- Larsson (1983) Larsson, M., 1983, A&AS, 128, 291.
- Leutwyler et al. (1982) Leutwyler, S., Maier, J. P. & Misev, L., 1982, Chem. Phys. Lett 91, 206.
- Lucas & Liszt (2000) Lucas, R. & Liszt, H. S., 2000, A&A, 358, 1069.
- Lutz & Crutcher (1983) Lutz, B. L. & Crutcher, R. M., 1983, ApJ, 271, L101.
- Maier (1998) Maier, J. P., 1998, J. Chem. Phys., 102, 3462.
- Maier & Rösslein (1988) Maier, J. P. & Rösslein, M., 1988, J. Chem. Phys., 88, 4614.
- McCall et al. (1998) McCall, B. J., Geballe, T. R., Hinkle, K. H. & Oka, T., 1998, Science 279, 1910.
- Ruffle & Herbst (2000) Ruffle, D. P. & Herbst, E., 2000, private communication: values from model given by Terzieva, R. & Herbst, E., 1998, ApJ, 501, 207.
- Snow et al. (1988) Snow, T. P., Seab, C. G. & Joseph, C. L., 1988, ApJ, 335, 185.
- Swings (1942) Swings, P., 1942, Rev. Mod. Phys. 12, 190.
- Tulej et al. (2000) Tulej, M., Fulara, J., Sobolewski, A., Jungen, M. & Maier, J. P., 2000, J. Chem. Phys., 112, 3747.
- van Dishoeck & Black (1986) van Dishoeck, E. F. & Black, J. H., 1986, ApJS, 62, 109.
- Wyss et al. (1999) Wyss, M., Grutter, M. & Maier, J. P., 1999, Chem. Phys. Lett. 304, 35.
| star | Sp/L | V | 4045 Å | 5060 Å | 5400 Å | K I RV | ||||
|---|---|---|---|---|---|---|---|---|---|---|
| TaaExposure times in seconds. | S/Nbbper pixel. | T | S/N | T | S/N | (km s-1) | ||||
| Per | B1 Ib | 2.85 | 0.28 | 4800 | 1200 | 2700 | 1900 | +13.91 0.24 | ||
| Oph | O9.5 V | 2.56 | 0.30 | 5400 | 2400 | 5400 | 4000 | 3000 | 2200 | 14.53 0.18 |
| 20 Aql | B3 V | 5.36 | 0.27 | 10800 | 800 | 8400 | 900 | 12.53 0.08 | ||
| Å | assignment | Oph | Per | 20 Aql | |||
|---|---|---|---|---|---|---|---|
| Å | Wλ 10-4 Å | Å | Wλ 10-4 Å | Å | Wλ 10-4 Å | ||
| 4049.784 | R(22) | 4049.770b | 1.016 | 4049.795b | 1.708 | ||
| 49.770 | R(24) | 49.770b | 1.016 | 49.795b | 1.708 | ||
| 49.810 | R(20) | 4049.782b | 1.658 | 49.807b | 1.162 | ||
| 49.784 | R(26) | 49.782b | 1.658 | 49.807b | 1.162 | ||
| 49.861 | R(18) | 49.865 | 0.309 | 49.877 | 0.511 | 49.865 | 0.821 |
| 49.963 | R(16) | 49.959 | 0.726 | 49.961 | 0.773 | ||
| 50.081 | R(14) | 50.079 | 0.792 | 50.091 | 0.759 | ||
| 50.206 | R(12) | 50.198 | 0.920 | 50.198 | 0.680 | 50.211 | 1.165 |
| 50.337 | R(10) | 50.329 | 1.034 | 50.342 | 0.679 | 50.339 | 1.450 |
| 50.495 | R(8) | 50.483 | 1.525 | 50.497 | 0.383 | 50.489 | 2.204 |
| 50.670 | R(6) | 50.669 | 1.562 | 50.662 | 0.943 | 50.667 | 2.330 |
| 50.865 | R(4) | 50.863 | 1.018 | 50.864 | 1.068 | 50.853 | 2.225 |
| 51.069 | R(2) | 51.073 | 0.896 | 51.074 | 1.657 | ||
| 51.309 | R(0) | 51.267c | 0.371 | 51.386c | 0.730 | ||
| 51.461 | Q(2) | 51.457 | 1.045 | 51.457 | 0.923 | 51.455 | 1.180 |
| 51.521 | Q(4) | 51.515 | 2.187 | 51.518 | 0.752 | 51.506 | 1.876 |
| 51.590 | Q(6) | 51.586 | 2.719 | 51.588 | 2.183 | 51.583 | 1.965 |
| 51.682 | Q(8) | 51.679 | 2.336 | 51.680 | 2.016 | 51.669 | 2.229 |
| 51.793 | Q(10) | 51.788 | 2.138 | 51.795 | 2.294 | 51.787 | 2.508 |
| 51.929 | Q(12) | 51.930 | 1.060 | 51.922 | 2.020 | 51.929 | 2.186 |
| 52.062 | P(4) | 52.074b | 1.266 | 52.085b | 1.043 | 52.065b | 3.130 |
| 52.089 | Q(14) | 52.074b | 1.266 | 52.085b | 1.043 | 52.065b | 3.130 |
| 52.271 | Q(16) | 52.262 | 1.217 | 52.271 | 1.821 | ||
| 52.424 | P(6) | 52.456 | 2.499 | ||||
| 52.473 | Q(18) | 52.466 | 1.233 | ||||
| 52.698 | Q(20) | 52.701 | 0.923 | ||||
| 52.792 | P(8) | 52.784 | 0.605 | 52.772 | 1.592 | ||
| 52.900 | Q(22) | 52.929 | 0.985 | 52.939 | 1.122 | ||
| 53.180 | P(10) | 53.197b | 1.883 | ||||
| 53.207 | Q(24) | 53.197b | 1.883 | ||||
| 53.590 | P(12) | 53.593 | 0.678 | 53.588 | 1.237 | ||
| 53.795 | Q(28) | 53.786 | 0.469 | 53.781 | 1.098 | ||
| 54.112 | Q(30) | 54.113 | 0.523 | ||||
| 54.459 | P(16) | 54.445 | 0.870 | ||||
| 54.908 | P(18) | 54.904 | 1.122 | ||||
| species | transition | f0-0 | star | aaGausset et al. (1965) | aaFor C3 the values refer to the J=8 level and to the most intense Q(8) line. For C and C are 3 detection limits, based on simulated spectra at the spectrograph resolving power, and the values are determined from the most intense R lines at 80 K. For C individual rotational lines are not resolved and is the 3 detection limit for the blended R branch. | ||
|---|---|---|---|---|---|---|---|
| (Å) | 10-4Å | 1010 cm-2 | 1012 cm-2 | ||||
| C3 | 4051.5bbThese features are assigned to two blended lines of similar intensity in the simulation and are not used to determine rotational level column densities. | 0.016cc R(0) is a very weak line with a correspondingly larger positional error compared to stronger neighboring lines. | Oph | 2.30.1 | 20 | 1.6 | |
| 20 Aql | 2.20.3 | 19 | 2.0 | ||||
| Per | 2.00.2 | 17 | 1.0 | ||||
| C | 4040.4ddTulej et al. (2000) | 0.04eeEstimated value (Tulej et al., 2000) | Oph | 6.0 | 0.3 | ||
| 20 Aql | 20 | 1.2 | |||||
| Per | 12 | 0.7 | |||||
| C | 5066.9ffMaier & Rösslein (1988) | 0.025ffMaier & Rösslein (1988) | Oph | 0.35 | 1.1 | 0.04 | |
| C | 5408.6ggHerzberg & Lagerqvist (1968) | 0.044hhLeutwyler et al. (1982) | Oph | 0.30 | 0.5 | 0.02 | |
| 20 Aql | 0.55 | 0.9 | 0.03 | ||||
| Per | 0.35 | 0.6 | 0.02 |