22institutetext: Osservatorio Astronomico di Bologna, Via Ranzani 1, I–40127 Bologna, Italy
33institutetext: Osservatorio Astronomico di Roma, Via Frascati 33, I–00044 Monteporzio, Italy
44institutetext: BeppoSAX Science Data Center, Via Corcolle 19, I–00131 Roma, Italy
55institutetext: Dipartimento di Fisica, Università degli Studi “Roma Tre”, Via della Vasca Navale 84, I–00146 Roma, Italy
The BeppoSAX High Energy Large Area Survey.
We present a comprehensive study of the soft X–ray properties of the BeppoSAX High-Energy Large Area Survey (HELLAS) sources. A large fraction (about 2/3) of the hard X–ray selected sources is detected by ROSAT. The soft X–ray colors for many of these objects, along with the 0.5–2 keV flux upper limits for those undetected in the ROSAT band, do imply the presence of absorption. The comparison with the ROSAT Deep Survey sources indicates that a larger fraction of absorbed objects among the HELLAS sources is present, in agreement with their hard X–ray selection and the predictions of the X–ray background synthesis models. Another striking result is the presence of a soft (additional) X–ray component in a significant fraction of absorbed objects.
Key Words.:
Surveys – Galaxies: active – Galaxies: nuclei – Galaxies: starburst X–rays: galaxies1 Introduction
While a relevant fraction (about 70–80 %) of the soft X–ray background (hereafter XRB) has been resolved into discrete sources by the ROSAT satellite (Hasinger et al. 1993, 1998), most of which being broad-line active galactic nuclei (AGNs) (Shanks et al. 1991; Boyle et al. 1994; Schmidt et al. 1998; Lehmann et al. 2000), in the hard band, where the bulk of the energy density resides, the nature of the sources of the XRB is far less obvious. Before the advent of the imaging instruments onboard ASCA and BeppoSAX, surveys in the hard energy range have been performed with limited-spatial resolution instruments, thus allowing the identification of the X–ray brightest sources, which account for a small fraction (about 3–5 %, Piccinotti et al. 1982) of the hard XRB. The AGNs observed at high energies by HEAO1, EXOSAT and Ginga have spectra much steeper (with a photon index 1.7–1.9) than the slope of the XRB in the same energy range (1.4–1.5, Gendreau et al. 1995; Vecchi et al. 1999). This fact, called “spectral paradox”, has been theoretically solved by assuming that the XRB is due to a mixture of absorbed and unabsorbed objects (Setti & Woltjer 1989). Following this indication, the contribution of different classes of sources to the XRB has been evaluated through population-synthesis models (e.g. Madau et al. 1994; Comastri et al. 1995).
Recently, the ASCA 2–10 keV surveys (Della Ceca et al. 1999; Ueda et al. 1999) and the BeppoSAX High Energy LLarge Area Survey (HELLAS) (Fiore et al. 1999, 2000a), carried out in the 5–10 keV energy range down to a flux limit of about 510-14 , have proven to be very efficient in revealing the nature of the sources which resolve about 20–30 % of the hard XRB, obscured AGNs being the main contributors. Chandra observations have confirmed and extended down to lower fluxes these results (Mushotzky et al. 2000; Fiore et al. 2000b; Brandt et al. 2000; Giacconi et al. 2001; Barger et al. 2001).
In order to better understand the nature and the properties of the sources responsible for the hard XRB and to verify whether additional soft X–ray components may be present, we have systematically searched in the ROSAT archive for complementary X–ray data to the present hard X–ray selected sample. Generally, soft X–ray components in addition to the standard AGNs spectral models are either excluded from the XRB synthesis models (e.g. Comastri et al. 1995) or, if included, they do account for a small, energetically not relevant fraction of the XRB (Gilli et al. 1999). Indeed, there is increasing evidence that the broad-band spectral properties of the sources responsible for the hard XRB are characterized by more complex spectra than is expected from a simple absorbed power-law model (Della Ceca et al. 1999; Giommi et al. 2000), as confirmed by the presence of multi-components spectra in obscured nearby AGNs (Awaki et al. 2000). The possibility of the existence of such additional components must be taken into account when comparing surveys performed in different energy ranges and, most important, at limiting fluxes differing by one (or more) order of magnitude.
2 The sample
2.1 The HELLAS hard X–ray-selected sample
142 high Galactic latitude (b20∘) MECS fields covering about 80 square degrees of sky have been analyzed. A detailed description of BeppoSAX instrumental capabilities, source detection algorithms and photon statistics is described by Fiore et al. (2001, paper II). For the purposes of the present paper, we have considered the full list of 147 BeppoSAX sources detected down to a flux limit of about 5 10-14 .
2.2 The HELLAS sources in ROSAT archival data
The BeppoSAX catalogue was cross-correlated with archival ROSAT data (PSPC, HRI and RASS). 108 out of the 147 sources are in ROSAT fields; for only 1 source RASS data have been used, due to the lack of pointed ROSAT observations. 4 sources lying beneath the PSPC detector window support structure will not be considered in the following discussions, therefore the useful number of HELLAS sources in ROSAT fields is 104. In those cases where multiple observations of the same HELLAS source are present, we chose the one with the longest exposure time and/or the lowest off-axis angle (and checked the results by analyzing at least another image of the same field).
3 ROSAT fields
3.1 ROSAT source detection
The ROSAT data have been analyzed with the MIDAS/EXSAS package (Zimmermann et al. 1998). The sources have been detected by running the local detection algorithm LDETECT, the bicubic spline fit to the background map and the map detection algorithm MDETECT. The detection threshold of these algorithms was set at a likelihood of L=ln(Pe)=10, corresponding to a probability of the order of 4.510-5 that the observed number of photons in the source cell is produced by a pure background fluctuation (about 4 detection, Cruddace et al. 1988). The measured counts were then corrected for PSPC vignetting and the source parameters were determined by the maximum likelihood method (MAXLIK). The sources which partially fell under the PSPC window support structure and which were missed by the detection routine have also been analyzed, and the vignetting-corrected count rates have been obtained in the different energy bands. Even though the above described routines have been extensively applied in the past, we have further checked the reliability of all the detections by running the slide-cell detection algorithm in XIMAGE (Giommi et al. 1991) in a similar way to that described in Fiore et al. (2000a) for all the sources of the present sample, obtaining similar results within the errors. Most of the sources are also present in the WGA catalogue (a point source catalogue generated from all ROSAT PSPC observations, see White et al. 1994). The agreement between the present results and those from the WGA makes us further confident about the findings which will be described in the following sections.
Images were constructed in 4 energy bands: PI channels 11–41 (corresponding to 0.1–0.4 keV, band a), 52–201 (0.5–2 keV, b), 52–90 (0.5–0.9 keV, c) and 91-201 (0.9–2 keV, d), which correspond to S, H, H1 and H2 in Hasinger et al. (1998). The hardness ratios have been defined as follows: HR1=(ba)/(ba) and HR2=(dc)/(dc).
The soft X–ray fluxes have been computed in the 0.5–2 keV energy range directly from the best-fit spectrum (when the statistics were high enough to allow a spectral modeling of the ROSAT counts) or by converting the count rates into fluxes under the assumption of a power-law slope with photon index 2.3 and Galactic absorption only.
| Source ID | RA | DEC | Class. | Count Rate | F | HR1 | HR2 | ROR # | Off-axis | Exposure | |
|---|---|---|---|---|---|---|---|---|---|---|---|
| (J2000) | (J2000) | (10-2 c/s) | (10-13 cgs) | (arcmin) | (ks) | ||||||
| # 20 | 01 40 14.7 | 67 48 55.2 | 0.20 | 0.22 | 0.159 | 0.252 | 300043p | 6.2 | 14.8 | ||
| # 45 | 03 15 47.5 | 55 29 5.2 | 1 | 1.24 | 1.6 | 0.170 | 0.158 | 701036p | 15.6 | 45.8 | 2.88 |
| # 46 | 03 17 32.7 | 55 20 24.9 | 1 | 1.22 | 1.2 | 0.720 | 0.367 | 701036p | 20.7 | 45.8 | 2.88 |
| # 53 | 04 37 11.9 | 47 31 43.2 | 1 | 2.36 | 3.4 | 0.513 | 0.216 | 701184p | 19.7 | 6.1 | 1.74 |
| # 54 | 04 38 46.2 | 47 27 56.9 | 1 | 1.09 | 0.88 | 0.390 | 0.373 | 701184p | 22.2 | 6.1 | 1.78 |
| # 57 | 05 20 49.0 | 45 41 31.2 | 5.24 | 6.0 | 0.018 | 0.119 | 700057p | 12.6 | 4.4 | 4.09 | |
| # 65 | 06 46 38.0 | 44 15 34.8 | 1 | 4.92 | 5.9 | 0.654 | 0.008 | 300226p | 15.9 | 5.5 | 6.19 |
| # 66 | 23 19 31.2 | 42 42 11.1 | 1.8 | 2.16 | 3.0 | 0.164 | 0.107 | 700333p | 22.8 | 7.2 | 1.96 |
| # 72 | 03 33 12.4 | 36 19 46.7 | BL Lac | 6.07 | 7.6 | 0.083 | 0.066 | 700921p-1 | 12.3 | 7.7 | 1.47 |
| # 73 | 03 36 55.9 | 36 15 55.9 | RLQ | 2.71 | 1.7 | 0.021 | 0.110 | 700921p-1 | 41.0 | 7.7 | 1.40 |
| # 75 | 03 34 6.9 | 36 03 55.3 | 1 | 0.19 | 0.20 | 0.874 | 0.211 | 700921p-1 | 7.7 | 7.7 | 1.37 |
| # 84 | 13 36 39.2 | 33 57 52.4 | RadGal | 4.84 | 7.0 | 0.845 | 0.045 | 600268p-1 | 0 | 18.4 | 4.10 |
| # 85 | 22 02 59.9 | 32 04 37.4 | 1 | 0.20 | 0.18 | 0.439 | 0.371 | 800419p-1 | 13.3 | 13.5 | 1.62 |
| # 92 | 13 48 45.1 | 30 29 40.3 | 1 | 5.57 | 6.6 | 0.246 | 0.088 | 700907p | 13.3 | 8.2 | 4.39 |
| # 103_1 | 00 45 44.4 | 25 15 29.9 | 1.9 | 1.10 | 2.6 | 0.369 | 0.198 | 600087p-0 | 25.3 | 11.6 | 1.42 |
| # 107 | 00 48 8.4 | 25 04 56.0 | 0.32 | 0.38 | 0.583 | 0.280 | 600087p-0 | 14.5 | 11.6 | 1.52 | |
| # 124 | 00 27 9.5 | 19 26 16.0 | 1 | 6.18 | 3.1 | 0.320 | 0.120 | 0.3 | 1.85 | ||
| # 137 | 09 46 37.4 | 14 07 46.0 | 1 | 0.44 | 0.44 | 0.369 | 0.082 | 701458p | 17.8 | 18.6 | 4.10 |
| # 147 | 20 42 52.9 | 10 38 33.0 | 1 | 3.69 | 3.7 | 0.385 | 0.431 | 701362p | 20.7 | 3.3 | 4.10 |
| # 149 | 20 44 34.7 | 10 27 54.4 | 1 | 0.44 | 0.54 | 0.394 | 0.182 | 701362p | 16.5 | 3.3 | 4.20 |
| # 150 | 13 05 32.9 | 10 33 15.9 | RLQ | 19.8 | 23.0 | 0.220 | 0.122 | 701195p | 0 | 3.2 | 3.33 |
| # 151 | 13 04 33.0 | 10 24 37.6 | 1 | 0.61 | 0.62 | 0.152 | 0.158 | 701195p | 19.6 | 3.2 | 3.35 |
| # 157 | 12 56 12.8 | 05 56 28.2 | 1 | 0.94 | 1.1 | 0.279 | 0.132 | 700305p-0 | 9.1 | 4.9 | 2.25 |
| # 167 | 12 40 27.3 | 05 13 57.5 | 1 | 1.41 | 1.3 | 0.440 | 0.111 | 701012p | 13.8 | 1.3 | 2.28 |
| # 172 | 02 42 1.2 | 00 00 26.6 | 1 | 0.64 | 0.88 | 0.133 | 0.261 | 150021p-2 | 9.9 | 5.5 | 3.45 |
| # 174 | 02 42 11.0 | 00 02 2.2 | 0.37 | 0.26 | 0.760 | 0.273 | 150021p-2 | 7.9 | 5.5 | 3.46 | |
| # 176 | 13 42 56.5 | 00 00 57.0 | 0.95 | 1.2 | 0.074 | 0.135 | 701000p-1 | 17.3 | 27.8 | 1.91 | |
| # 185 | 05 15 15.7 | 01 09 19.5 | 1.24 | 1.3 | 0.951 | 0.415 | 300352p | 7.7 | 3.1 | 10.9 | |
| # 190 | 16 52 38.4 | 02 22 3.9 | 1 | 0.44 | 0.34 | 0.765 | 0.385 | 701035p-1 | 5.7 | 3.2 | 5.75 |
| # 201 | 16 49 59.2 | 04 53 37.6 | Cl. | 0.75 | 0.69 | 0.765 | 0.385 | 701611p | 18.2 | 8.1 | 6.35 |
| # 209 | 23 27 29.2 | 08 49 28.0 | 1 | 0.52 | 0.41 | 0.579 | 0.313 | 600234p | 7.7 | 3.9 | 5.21 |
| # 212 | 23 02 33.0 | 08 57 1.2 | ELG | 0.23 | 0.18 | 0.649 | 0.817 | 700423p | 11.3 | 18.6 | 4.91 |
| # 229 | 23 31 54.7 | 19 38 29.0 | 1 | 0.64 | 1.5 | 201697h | 15.6 | 6.3 | 4.29 | ||
| # 230_1 | 15 28 48.1 | 19 38 52.7 | 1 | 0.94 | 0.60 | 0.453 | 0.262 | 180175p | 5.8 | 0.8 | 4.60 |
| Table 1 (continued). | |||||||||||
|---|---|---|---|---|---|---|---|---|---|---|---|
| Source ID | RA | DEC | Class. | Count Rate | F | HR1 | HR2 | ROR # | Off-axis | Exposure | |
| (J2000) | (J2000) | (10-2 c/s) | (10-13 cgs) | (arcmin) | (ks) | ||||||
| # 230_2 | 15 28 45.1 | 19 44 34.0 | 3.69 | 4.3 | 0.935 | 0.505 | 180175p | 6.6 | 0.8 | 4.62 | |
| # 237 | 22 26 31.6 | 21 11 33.3 | 1 | 2.95 | 3.3 | 0.429 | 0.033 | 700856p | 14.0 | 6.4 | 4.44 |
| # 239 | 14 17 16.9 | 24 59 17.3 | 1 | 0.49 | 0.95 | 0.002 | 0.107 | 700536p | 13.3 | 10.9 | 1.70 |
| # 241 | 14 18 30.4 | 25 10 52.3 | Cl. | 3.51 | 6.3 | 0.438 | 0.337 | 600200p | 7.3 | 6.6 | 1.70 |
| # 243 | 08 37 37.3 | 25 47 50.8 | 1 | 4.24 | 5.1 | 0.908 | 0.271 | 600200p | 10.9 | 6.6 | 3.64 |
| # 246 | 08 38 58.3 | 26 08 18.6 | ELG | 3.33 | 4.5 | 0.937 | 0.781 | 600200p | 24.6 | 6.6 | 3.61 |
| # 250 | 23 55 54.0 | 28 35 53.6 | RLQ | 1.86 | 2.2 | 0.617 | 0.244 | 200002p | 11.5 | 18.0 | 4.98 |
| # 252 | 12 04 3.8 | 28 07 8.7 | Cl. | 5.51 | 7.9 | 0.467 | 0.287 | 700232p | 15.8 | 26.0 | 1.68 |
| # 254 | 22 42 47.2 | 29 34 18.5 | 0.41 | 0.42 | 0.160 | 0.396 | 701597p | 9.7 | 4.3 | 6.35 | |
| # 256 | 22 41 23.5 | 29 42 45.0 | 6.23 | 7.3 | 0.642 | 0.297 | 701597p | 16.3 | 4.3 | 6.45 | |
| # 264 | 12 18 54.8 | 29 59 44.1 | 1.9 | 0.16 | 0.23 | 0.158 | 0.363 | 700221p | 15.8 | 21.6 | 1.70 |
| # 265 | 12 17 52.3 | 30 07 4.3 | BL Lac | 13.9 | 16.0 | 0.375 | 0.023 | 700221p | 0 | 21.6 | 1.69 |
| # 278 | 10 34 57.0 | 39 39 43.1 | 0.52 | 0.27 | 0.149 | 0.338 | 700551p | 3.4 | 4.6 | 0.95 | |
| # 279 | 16 54 42.0 | 40 01 18.6 | 2.00 | 0.98 | 0.443 | 0.282 | 700130p | 18.3 | 7.6 | 1.81 | |
| # 282 | 11 18 47.7 | 40 26 46.9 | 1 | 0.56 | 0.84 | 0.105 | 0.107 | 700801p | 3.3 | 6.5 | 1.92 |
| # 283 | 11 18 14.0 | 40 28 34.3 | 1 red | 0.61 | 0.72 | 0.158 | 0.065 | 700801p | 4.3 | 6.5 | 1.91 |
| # 288 | 12 19 23.2 | 47 09 42.6 | 1.29 | 1.5 | 0.801 | 0.228 | 600546p | 9.9 | 25.7 | 1.15 | |
| # 290 | 12 19 52.1 | 47 21 0.0 | 1 | 0.34 | 0.72 | 0.142 | 0.177 | 600546p | 9.5 | 25.7 | 1.16 |
| # 292 | 12 17 43.3 | 47 29 15.8 | 2.99 | 4.0 | 0.524 | 0.173 | 600546p | 16.5 | 25.7 | 1.21 | |
| # 296 | 18 15 13.5 | 49 44 15.0 | 0.10 | 0.09 | 0.825 | 0.081 | 300067p-1 | 11.6 | 18.0 | 4.34 | |
| # 300 | 10 32 15.6 | 50 51 12.0 | 1 | 0.22 | 0.14 | 0.353 | 0.551 | 701544p | 9.2 | 10.8 | 1.18 |
| # 307 | 16 26 59.7 | 55 28 16.2 | Cl. | 6.49 | 3.9 | 0.476 | 0.330 | 701372p | 9.6 | 2.3 | 1.85 |
| # 319 | 10 54 20.2 | 57 25 43.1 | 1.8 | 1.17 | 1.4 | 0.849 | 0.398 | 900029p-2 | 18.6 | 65.6 | 0.57 |
| # 321 | 10 32 38.3 | 57 31 3.4 | 0.17 | 0.54 | 0.659 | 0.116 | 900029p-2 | 9.9 | 65.6 | 0.56 | |
| # 364 | 14 38 22.0 | 64 31 17.9 | 0.21 | 0.26 | 0.516 | 0.409 | 200069p | 14.5 | 7.4 | 1.68 | |
| # 375_2 | 17 43 0.0 | 68 00 46.3 | 2.75 | 1.1 | 0.432 | 0.229 | 999995p | 41.5 | 6.4 | 4.38 | |
| # 385 | 07 21 36.9 | 71 13 25.5 | 1 | 0.60 | 0.69 | 0.267 | 0.169 | 700210p | 7.1 | 20.7 | 3.84 |
| # 387 | 11 01 48.8 | 72 25 44.1 | RLQ | 2.74 | 3.4 | 0.628 | 0.392 | 700872p | 24.3 | 13.1 | 3.16 |
| # 389 | 11 06 16.6 | 72 44 10.5 | 1 | 0.65 | 0.73 | 0.038 | 0.012 | 700872p | 10.3 | 13.1 | 3.17 |
| # 390 | 11 02 37.2 | 72 46 38.1 | 1 | 15.5 | 19.0 | 0.346 | 0.179 | 700872p | 22.4 | 13.1 | 3.36 |
| # 392 | 07 41 44.6 | 74 14 41.6 | Cl. | 17.0 | 27.0 | 0.669 | 0.241 | 800230p | 0 | 8.8 | 3.49 |
| # 393 | 07 42 2.4 | 74 26 21.9 | 1.55 | 1.8 | 0.373 | 0.172 | 800230p | 11.4 | 8.8 | 3.52 | |
| # 394 | 07 43 12.0 | 74 29 34.0 | 1 | 9.53 | 11.0 | 0.235 | 0.056 | 800230p | 15.6 | 8.8 | 3.53 |
| # 400 | 12 22 6.9 | 75 26 17.4 | Cl. | 1.01 | 1.1 | 0.671 | 0.404 | 700434p-1 | 7.8 | 7.4 | 2.97 |
HRI data; RASS; Galactic from Dickey & Lockman (1990) in units of 1020 cm-2; Class: 1: broad-line AGN; 1 red: broad-line QSO with a red continuum; 1.8-2: narrow-line AGN; ELG: emission-line galaxy; BL Lac: BL Lac object; RLQ: radio-loud quasar; RadGal: radio-galaxy; Cl.: cluster; : star.
3.2 ROSAT data analysis
Each ROSAT field has been analyzed searching for the soft X–ray counterpart of the BeppoSAX HELLAS sources, assuming a cross-correlation radius of 100 arcsec. Six ROSAT sources have been found at larger radii: five have been spectroscopically identified and the soft X–ray position coincides with the optical one within 30 arcsec. This evidence, coupled with the errors which can be associated to BeppoSAX MECS pointing position reconstruction (mainly due to the unavailability of one star-tracker for a part of the observation, see paper II for a full description of these problems), makes us confident that these associations are real. The sixth source belongs to a high-Galactic field where BeppoSAX position reconstruction was not possible due to the absence of a bright known source in the same field of view as the HELLAS source.
For the majority of fields only one ROSAT source is present in each BeppoSAX error box. For the three cases in which more than one ROSAT source is present, the one closest to the center of BeppoSAX error box has been chosen. For these sources the soft X–ray emission is also associated to radio emission.
Given the large range of both ROSAT exposure times and off-axis angles distributions, the sensitivity limit is different from field to field. As a consequence, the number of spurious ROSAT - BeppoSAX associations has been derived by computing for each source the number of objects expected at its flux according to the 0.5–2 keV integral source counts (Hasinger et al. 1998) and adopting a searching radius of 100 arcsec. The final number of spurious associations is therefore the summed contribution of the chance coincidences expected for each field. With this approach, we expect 2 associations by chance.
68 out of the 104 HELLAS sources have a ROSAT soft X–ray counterpart, while 36 sources went undetected. The 5–10 keV flux distribution for the sources detected by ROSAT is not significantly different from that of the entire HELLAS sample (20 % confidence level according to the Kolmogorov-Smirnov (KS) test).
3.3 HELLAS sources detected by ROSAT
Among the 68 sources detected by ROSAT 51 have been identified with extragalactic objects (see Table 1 for a comprehensive view on their soft X–ray properties), i.e. 35 Type 1 objects (including 4 radio-loud AGNs and 1 red quasar), 4 Type 1.8–2, 2 emission-line galaxies, 2 BL Lac objects, 1 radio-galaxy and 6 clusters. Moreover, one source is associated with a bright K star. All the radio-loud AGNs and the clusters, and about one third of the Type 1 objects have been identified through existing catalogues, while the remaining have been spectroscopically identified by our group (see La Franca et al. 2001). In several cases the ROSAT –BeppoSAX association has been used in the spectroscopic identification process. For what concerns the ROSAT -optical association, we have considered the X–ray source physically associated with the optically identified object if the distance between the X–ray and the optical position is below 40 arcsec (which should take into account the dependence of the PSPC point-spread function with the off-axis angle and the possible error in aspect reconstruction). The ROSAT sources of the present sample have typical distances of about 15–20 arcsec from the optical position (which is consistent with the values found by Voges et al. 1999 for point-like sources). Only for two sources the optical and the ROSAT positions seem to be different: in one case the most likely explanation is that the X–ray emission comes from a group of galaxies (the likely counterpart of the HELLAS source) and not from a single object (which is confirmed by the presence of some optical emission-line objects in the BeppoSAX error box). In the other case, the X–ray source is clearly extended and identified with a Type 1.9 AGN.
3.4 HELLAS sources undetected by ROSAT
The off-axis angles and the exposure times distributions of the 68 detected sources are not statistically different – according to the KS test – from those of the 36 undetected sources.
X–ray absorption is likely to play a major role in “hiding” a fraction of objects, thus making them extremely faint or even absent in the soft X–rays. This is confirmed by computing the average BeppoSAX softness ratio (SR=(SH)/(SH), where S=1.3–4.5 keV and H=4.5–10 keV band) for the subsamples which are detected and undetected by ROSAT , the former having SR = 0.037 (dispersion=0.363), the latter SR = 0.314 (dispersion = 0.424), this value corresponding to 1023 cm-2 at any redshift, see Fig. 7 in Comastri et al. 2001 (paper III). This is a further clear indication that absorption plays a major role in the soft X–ray detection/undetection of the HELLAS sources.
Among the 12 sources which are spectroscopically identified without being detected by ROSAT , we find 2 high-z Type 1 objects (z=0.953 and z=2.386), 3 emission-line galaxies, 1 red quasar and 6 Type 1.8-2. These objects, on the basis of the X–ray analysis performed with BeppoSAX , are likely to be affected by absorption, their mean softness ratio being SR 0.228 ( 1023 cm-2 at z 0.015).
4 ROSAT results
4.1 Absorption
The BeppoSAX 5–10 keV and ROSAT 0.5–2 keV fluxes are reported in Fig. 1. The dashed lines indicate the fluxes expected for a spectral slope of =2.3 and =1.6 (with the average Galactic absorption of the present distribution: 31020 cm-2), and =1.8 plus =1022 cm-2, from top to bottom. It appears clear that for a significant fraction of the objects intrinsic absorption and/or flatter spectral slopes are required in order to reproduce the observed flux ratio. It must be kept in mind that the values derived from Fig. 1 are only indicative and may be considered as lower limits on the presence of X–ray absorption, since any additional component in the ROSAT energy range would increase the soft X–ray flux, and that source variability between the observations with the two satellites may affect the results. However, since the amplitude of nuclear variability scales as (about) the inverse of the luminosity (Nandra et al. 1997), for the majority of the objects of the present subsample (with an average 0.5–2 keV luminosity of 1044 erg s-1) variability is unlikely to significantly affect the present results.

In order to provide a further evidence of the presence of strong absorption in the HELLAS sources, the upper limits for the sources which went undetected in the ROSAT band are also plotted in Fig. 1. 12 of these upper limits are relative to spectroscopically identified sources (cfr. 3.4). It can be seen that the upper limits are extremely concentrated in the region characterized by high absorbing column densities: this is a further indication of the role of absorption in hiding the HELLAS sources, despite of their optical classification.


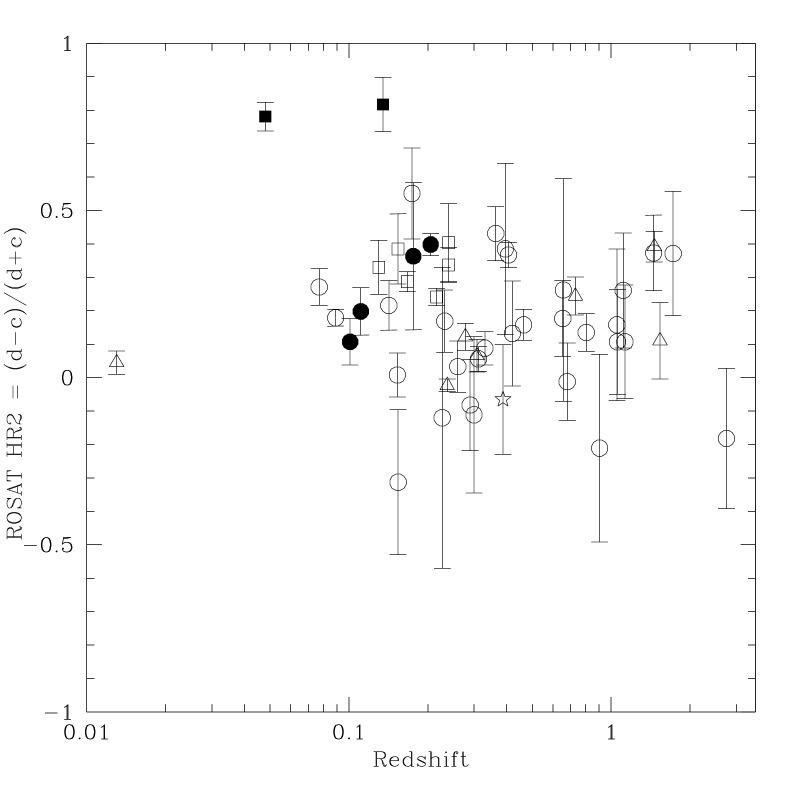
Similar results can be obtained by plotting the 5–10 keV to 0.5–2 keV flux ratios as a function of redshift (Fig. 2, left panel) for Type 1 and Type 2 sources. In order to provide an estimate of the absorption at the source redshift, three curves corresponding to Log = 22, 22.5 and 23 cm-2 are also plotted. The underlying assumed spectrum is a power law with = 1.8. It is evident that about half of the sources require absorption in excess to 1022 cm-2 and, among them, many are associated to broad-line objects. Viceversa, 3 out of 4 Type 2 AGNs are consistent with 1022 cm-2. We also note a trend of increasing hardness with redshift, which is more pronounced for Type 1 objects.
A similar trend can be found by adding ASCA Large Sky Survey (LSS) broad-line objects (small crossed circles in Fig. 2, right panel) to the HELLAS ones. The increasing hardness with redshift, parameterized by the relation / , is particular evident at z 0.3 and could be ascribed to a flattening of the primary X–ray spectral slope at moderate/high redshift, as tentatively suggested by Vignali et al. (1999) for a small sample of high-z radio-quiet quasars. Even though the large majority of the objects of Fig. 2 (right panel) can be parameterized by a variety of spectral slopes ranging from = 1.0 to = 2.0 (the short-long dashed lines), the flux ratios of some sources are not well reproduced, clearly suggesting that absorption is a better explanation, in line with BeppoSAX softness ratio predictions. A combination of these effects, absorption and flattening with redshift, is also plausible.
4.2 Soft X–ray components
The broad-band X–ray spectrum has been investigated by selecting a subsample of 12 HELLAS sources spectroscopically identified as broad-line objects, whose softness ratio (as a function of redshift) indicates the presence of substantial intrinsic absorption ( 5 1022 cm-2 at the source rest frame). For these sources we have calculated the 0.5–2 keV flux which is expected by extrapolating the BeppoSAX flux in the ROSAT band under the assumption of a = 1.8 power-law continuum absorbed by the obtained by the softness ratio analysis with BeppoSAX . These values have been subsequently compared to the observed 0.5–2 keV fluxes obtained directly from our analysis.
Among the 12 Type 1 objects, 5 sources have ROSAT fluxes which agree with the predicted ones within 10 %, while for 6 of the remaining objects, in order to reproduce the observed ROSAT flux, an additional component is strongly required, with a moderate/high fraction (from 25 to 65 %) of the nuclear (5–10 keV) radiation being reprocessed in soft X–ray radiation and re-emitted. The remaining source is characterized by a soft X–ray flux higher than 5–10 keV flux, clearly pointing towards a prominent soft excess in this object.
Similar values (from 5 to 35 %) have been obtained for the 2 Type 2 objects which appear absorbed in BeppoSAX and which are detected by ROSAT .
The true nature of the soft component is far from being clear: it could be due to nuclear photons spilling from a partial covering screen, or reflected by a warm/hot medium or, alternatively, it could be thermal emission from starburst regions and winds. At the present it is difficult to shed light on the nature of this component on the basis of these X–ray data only, unless Chandra or XMM-Newton follow-up observations will be performed.
5 Comparison with the ROSAT Deep Survey sample
In order to further investigate the soft X–ray properties and the nature of the hard X–ray-selected HELLAS sources, we compared the present sample with that of similar size extracted from the ROSAT Deep Survey in the Lockman Hole (hereafter RDS, Hasinger et al. 1998; Schmidt et al. 1998; Lehmann et al. 2000), which is soft X–ray-selected and fully identified at a limiting X–ray flux of 5.5 10-15 erg cm-2 s-1 (0.5–2 keV). The redshift distributions of the two samples are shown in Fig. 3.


The properties of the two samples have been compared by means of hardness ratios HR1 and HR2 (cfr. Sect. 3.1). Figure 4 shows the plot of HR1 vs. HR2 for the HELLAS and the RDS sources (left and right panel, respectively).


It appears clear that most of the HELLAS sources populate the hardest region (HR1 0, HR2 0) of the diagram, while with a few exceptions the Lockman Hole sources are softer. It must be noted, however, that HR1 is very sensitive even to relatively small values of the Galactic absorption, that towards the Lockman Hole being of the order of 5.7 1019 cm-2, while the HELLAS sample spans a wide range of Galactic , from 5.7 1019 cm-2 (two sources detected in the Lockman Hole) to 1.1 1021 cm-2 (only one source having this ), with an average column density of 2.6 1020 cm-2. This result in a shift of the HR1 distribution up to 0.5–0.6.
Therefore, since a meaningful comparison between HR1 for the two samples is not possible, a more reliable result can be obtained by comparing HR2, which is much less sensible to the Galactic absorption. Indeed, given the HELLAS distribution, the effect of absorption is only marginal and could give rise to an increase in HR2 of only 0.05–0.1 (which is within the statistical errors). The result is that the HR2 distribution of the HELLAS sample (Fig. 5, left panel) is intrinsecally different from that obtained for the Lockman Hole sources (Fig. 5, right panel), as confirmed by the Kolmogorov-Smirnov test (probability of 10-6 that the two samples are drawn from the same parent population). The differences observed in the color-color diagram between the two samples are also evident in the color-redshift distribution. In particular, the HR2 of the HELLAS sources (Fig. 6, left panel) populates, on average, a harder region (upper right corner) of the diagram than the RDS sources (Fig. 6, right panel).

It is interesting to note that the variety of optical classification of hard sources is also found in the Lockman Hole sample (even though based on a smaller number of objects), where in the hardest part of the color-color diagram (Fig. 4, right panel) there are two Type 2 objects, two RK5–6 sources (candidate EROs, Extremely Red Galaxies; see Lehmann et al. 2000 for a detailed discussion) and two Type 1 objects, whose redshifts (1.561 and 2.832) and hard X–ray colors seem to confirm BeppoSAX findings on X–ray absorbed Type 1s.
All the previous results indicate that hard X–ray selection provides a significant fraction of absorbed objects, characterized by varied optical properties and classifications (broad-line AGNs, narrow-line AGNs, emission-line galaxies). X–ray absorbed objects are however present also in soft X–ray selected samples, even though at a lower level. Most interesting, a large fraction of hard X–ray-selected objects is present in ROSAT : the obscured constituents of the XRB progressively show up going to fainter fluxes and harder energy ranges.

6 Discussion and conclusions
The recent hard X–ray surveys performed by ASCA , BeppoSAX and Chandra have revealed that the population responsible for the hard X–ray background has quite varied multiwavelength properties. According to AGN synthesis models (i.e. Comastri et al. 1995), these sources must be characterized by a spectral energy density spanning a wide range of luminosities and absorption column densities, in order to reproduce both the XRB spectrum and the source counts in different energy ranges. In particular, the energetically dominant contribution comes from sources around the knee of the X–ray luminosity function ( a few 1044 erg s-1 at z=1) and with absorbing column densities of the order of 1023 cm-2 (Comastri 2000). These objects, the so-called “QSO 2”, i.e. quasars with optical narrow-emission lines, have been extensively searched, but, at present, only a handful of candidates have been found (Ohta et al. 1996; Akiyama et al. 2000; Della Ceca et al. 2000). Results from recent hard X–ray surveys and the ones presented in this paper indicate that X–ray absorption is not correlated with the optical reddening, hence the classical statement of unobscured Type 1 – obscured Type 2 objects is far from being always valid. Indeed, Type 1 AGNs characterized by hard X–ray colors, likely to be absorbed by column density of the order of 5 1022 cm-2 or greater, have been found by both BeppoSAX and ASCA surveys (Akiyama et al. 2000), and their role in contributing to the XRB may be exactly the same as the postulated Type 2 QSOs.
The emerging picture is that the zoo of the hard X–ray-selected sources is characterized by more complex properties than previously thought (Comastri et al. 2000; Vignali et al. 2000).
Another interesting result comes from the relatively high number of HELLAS hard X–ray selected sources revealed by ROSAT . This is due to a combination of effects, the most important being the high sensitivity of ROSAT also at faint flux levels and the presence of soft X–ray emission also in strongly obscured AGNs. The most important implication is that the same highly absorbed sources responsible for a sizeable fraction of the hard XRB emit in the soft X–rays (Giommi et al. 2000; Giacconi et al. 2001), where they confirm their hardness. In some cases it was found that this emission is enhanced, with respect to the extrapolation at low energies of the absorbed higher energy component, by Compton downscattering or through a thermal component. For a subsample of HELLAS sources it has been possible to provide an estimate of the relative fraction of this scattered component with respect to the nuclear flux, spanning from a few to 65 per cent.
Although this component is not energetically dominant (indeed it is not present in the XRB synthesis model by Comastri et al. 1995), it could be important when comparing surveys performed in different energy ranges and, most important, at limiting fluxes differing by one (or more) order of magnitude. This has interesting consequences also in the computation of the X–ray luminosity function for the sources responsible for the XRB, since the contribution from this additional component is taken into account as it was of nuclear origin, not due either to reprocessing of the primary radiation or to thermal emission.
Remarkably, the ROSAT analysis indicates that a significant number of HELLAS sources are characterized by hard X–ray colors also in soft X–rays. The broad-band analysis of the sources which are not detected by ROSAT (upper limits in Fig. 1) suggests that truly hard sources (where the soft X–ray emission is extremely faint or totally absent) do exist. There are evidences that such sources have also been detected by XMM-Newton in the Lockman Hole (Hasinger et al. 2001).
The comparison of the color-color properties of the present sample with those of the ROSAT Deep Survey (Hasinger et al. 1998) in the Lockman Hole confirms that we are sampling the hard tail of the distribution of the sources responsible for the XRB, where the hardness of the spectrum may be ascribed to a flat continuum or, more convincingly, to large amounts of X–ray absorption, or to a combination of both the factors. Even though the HELLAS sources are harder in soft X–rays than the RDS objects, it is straightforward to note a continuity of properties between the two samples, with a optically varied population of hard sources in both.
Acknowledgements.
This research has made use of the NASA/IPAC Extragalactic Database (NED) which is operated by the Jet Propulsion Laboratory, California Institute of Technology, under contract with the National Aeronautics and Space Administration. The authors wish to thank G. Zamorani, G. Matt and P. Giommi for useful suggestions and discussion, and the anonymous referee for prompt and constructive comments. This work is partly supported by the Italian Space Agency, contract ARS–99–79 and by the Ministry for University and Research (MURST) under grant COFIN–98–02–32.References
- (1) Akiyama, M., Ohta, K., Yamada, T., et al. 2000, ApJ, 532, 700
- (2) Awaki, H., Ueno, S. Taniguchi, Y., Weaver, K. A. 2000, ApJ, 542, 175
- (3) Barger, A. J., Cowie, L. L., Mushotzky, R.F., Richards, E. A. 2001, AJ, 121, 662
- (4) Boyle, B. J., Shanks, T., Georgantopoulos, I., Stewart, G. C., Griffiths, R. E. 1994, MNRAS, 271, 639
- (5) Brandt, W. N., Hornschemeier, A. E., Schneider, D. P., et al. 2000, AJ, 119, 2349
- (6) Comastri, A., Setti, G., Zamorani, G., Hasinger, G. 1995, A&A, 296, 1
- (7) Comastri, A. 2000. In “X–ray Astronomy ’999: Stellar Endpoints, AGN and the Diffuse X-ray Background”, ed. G. Malaguti, G. Palumbo & N. E. White (astro-ph/0003437)
- (8) Comastri, A., Fiore, F., Vignali, C., La Franca, F., Matt, G. 2000. In “Large scale structure in the X–ray Universe”, ed. M. Plionis, & I. Georgantopoulos, p. 227
- (9) Comastri, A., Fiore, F., Vignali, C., et al. 2001, MNRAS, submitted (paper III)
- (10) Cruddace, R. G., Hasinger, G., Schmitt, J. H. 1988. In “Astronomy from large databases: scientific objectives and methodological approaches”, p. 177.
- (11) Della Ceca, R., Castelli, G., Braito, V., Cagnoni, I., Maccacaro, T. 1999, ApJ, 524, 674
- (12) Della Ceca, R., Maccacaro, T., Rosati, P., Braito, V. 2000, A&A, 355, 121
- (13) Dickey, J. M., Lockman, F. J. 1990, ARA&A, 28, 215
- (14) Fiore, F., La Franca, F., Giommi, P., et al. 1999, MNRAS, 306, L55
- (15) Fiore, F., Antonelli, L. A., Ciliegi, P., et al. 2000a. In “X–ray Astronomy ’999: Stellar Endpoints, AGN, and the Diffuse Background”, ed. G. Malaguti, G. Palumbo & N. E. White (astro-ph/0007118)
- (16) Fiore, F., La Franca, F., Vignali, C., et al. 2000b, New Astronomy, 5, 143
- (17) Fiore, F., Giommi, P., Vignali, C., et al. 2001, MNRAS, submitted (paper II)
- (18) Gendreau, K. C., Mushotzky, R. F., Fabian, A. C., et al. 1995, PASJ, 47, L5
- (19) Giacconi, R., Rosati, P., Tozzi, P., et al. 2001, ApJ, submitted (astro-ph/0007240)
- (20) Gilli, R., Risaliti, G., Salvati, M. 1999, A&A, 347, 424
- (21) Giommi, P., Tagliaferri, G., Beuermann, K., et al. 1991, ApJ, 378, 77
- (22) Giommi, P., Perri, M., Fiore, F. 2000, A&A, 362, 799
- (23) Hasinger, G., Burg, R., Giacconi, R., et al. 1993, A&A, 275, 1
- (24) Hasinger, G., Burg, R., Giacconi, R., et al. 1998, A&A, 329, 482.
- (25) Hasinger, G., Altieri, B., Arnaud, M, et al. 2001, A&A, 365, L45
- (26) La Franca, F., Fiore, F., Vignali, C., Comastri, A., Pompilio, F. 2001. In “The New Era of Wide Field Astronomy”, ed. R. G. Clowes, A. J. Adamson & G. E. Bromage, ASP Conf. Series (astro-ph/0011008)
- (27) Lehmann, I., Hasinger, G., Schmidt, M., et al. 2000, A&A, 354, 35
- (28) Madau, P., Ghisellini, G., Fabian, A. C. 1994, MNRAS, 270, L17
- (29) Mushotzky, R. F., Cowie, L. L., Barger, A. J., Arnaud, K. A. 2000, Nature, 404, 459
- (30) Nandra, K., George, I. M., Mushotzky, R. F., Turner, T. J., Yaqoob, T. 1997, ApJ, 476, 70
- (31) Ohta, K., Yamada, T., Nakanishi, K., et al. 1996, ApJ, 458, L70
- (32) Piccinotti, G., Mushotzky, R. F., Boldt, E. A., et al. 1982, ApJ, 253, 485
- (33) Schmidt, M., Hasinger, G., Gunn, J., et al. 1998, A&A, 329, 495.
- (34) Setti, G., Woltjer, L. 1989, A&A, 224, L21
- (35) Shanks, T., Georgantopulos, I., Stewart, G. C., et al. 1991, Nature, 353, 315
- (36) Ueda, Y., Takahashi, T., Inoue, H., et al. 1999, ApJ, 518, 656
- (37) Vecchi, A., Molendi, S., Guainazzi, M., Fiore, F., Parmar, A. N. 1999, A&A, 349, L73
- (38) Vignali, C., Comastri, A., Cappi, et al. 1999, ApJ, 516, 582
- (39) Vignali, C., Mignoli, M., Comastri, A., Maiolino, R., Fiore, F. 2000, MNRAS, 314, L11
- (40) Voges, W., Aschenbach, B., Boller, Th., et al. 1999, A&A, 349, 389
- (41) White, N. E., Giommi, P., Angelini, L. 1994, American Astronomical Society Meeting, 185, 4111
- (42) Zimmermann, H. U., Boese, G., Becker, W., et al. 1998, MPE Report