Reconsidering the Identification of M101 Hypernova Remnant Candidates
Abstract
Using a deep Chandra AO-1 observation of the face-on spiral galaxy M101, we examine three of five previously optically-identified X-ray sources which are spatially correlated with optical supernova remnants (MF54, MF57, and MF83). The X-ray fluxes from these objects, if due to diffuse emission from the remnants, are bright enough to require a new class of objects, with the possible attribution by Wang to diffuse emission from hypernova remnants. Of the three, MF83 was considered the most likely candidate for such an object due to its size, nature, and close positional coincidence. However, we find that MF83 is clearly ruled out as a hypernova remnant by both its temporal variability and spectrum. The bright X-ray sources previously associated with MF54 and MF57 are seen by Chandra to be clearly offset from the optical positions of the supernova remnants by several arc seconds, confirming a result suggested by the previous work. MF54 does have a faint X-ray counterpart, however, with a luminosity and temperature consistent with a normal supernova remnant of its size. The most likely classifications of the sources are as X-ray binaries. Although counting statistics are limited, over the 0.3–5.0 keV spectral band the data are well fit by simple absorbed power laws with luminosities in the ergs s-1 range. The power law indices are softer than those of Milky Way LMXB of similar luminosities, and are more consistent with those of the Large Magellanic Cloud. Both the high luminosity and the soft spectral shape favor these being accreting black hole binaries in high soft states.
1 Introduction
M101 (NGC 5457), a face-on Sc galaxy at a distance of 7.2 Mpc (Stetson et al., 1998), is an ideal subject for the study of spiral galaxies of types similar to the Milky Way. The low Galactic column density ( HI cm-2) allows investigations of X-ray emission down to energies of keV. It is relatively large with a diameter of , kpc, compared to kpc for the Milky Way. With the arc-second resolution of the Chandra X-ray Observatory (Weisskopf, O’Dell, & van Speybroeck, 1996), structures as small as pc can be resolved, and their positions can be well determined.
By correlating a catalog of optically-identified supernova remnants (Matonick & Fesen, 1997) in M101 with X-ray sources detected in a ROSAT HRI deep observation (Wang, Immler, & Pietsch, 1999), Wang (1999) identified five positional coincidences. Because of the implied high luminosity of the objects, ergs s-1, if the observed emission was due to shock-heated interstellar gas then a new class of objects was required as the input energy would be well beyond that of a normal supernova. Wang speculated that the excess energy could be due to the progenitor events being hypernovae, the name proposed by Paczyński (1998) for the entire gamma-ray burst (GRB) and afterglow event. In a hypernova, the GRB ejecta (e.g., the outer material of a star that can be ejected during the period when a compact object enters its atmosphere preceding the object/helium-core collapse) collides with the ambient medium surrounding the event (Paczyński (1998) and references within). This can produce an afterglow which can be hundreds of times more luminous than that of a normal supernova.
| Supernova | Matonick & Fesen (1997) | Wang (1999) | Pence et al. (2001) | ||||
|---|---|---|---|---|---|---|---|
| Remnant | R.A. (J2000) | Decl. (J2000) | DiameteraaDiameter of the supernova remnant in parsecs. | Source | Source | R.A. (J2000) | Decl. (J2000) |
| MF54bbBright source likely detected by Wang et al. (1999). | 14 03 20.7 | 54 19 42.2 | 20 | H29 | P70 | 14 03 21.5 | 54 19 45.9 |
| MF54ccChandra source likely associated with MF54. | 14 03 20.7 | 54 19 42.2 | 20 | P67 | 14 03 20.6 | 54 19 42.3 | |
| MF57 | 14 03 24.2 | 54 19 44.0 | 30 | H30 | P76 | 14 03 24.2 | 54 19 48.9 |
| MF83 | 14 03 35.9 | 54 19 24.1 | 200 | H36 | P104 | 14 03 36.0 | 54 19 24.8 |
In this paper we examine the three X-ray source/optical supernova remnant correlations which were considered as possible hypernova remnant candidates by Wang (1999), and which were included in the field covered by the S3 (backside illuminated) CCD chip during our deep ( ks) Chandra Advanced CCD Imaging Spectrometer (ACIS, Garmire et al. (1992); Bautz et al. (1998)) observation of M101 (Table 1). All of these objects have luminosities substantially higher than that expected from a normal supernova remnant implying that if the fluxes originate from diffuse emission the progenitor events were extremely energetic. Of these three objects, the X-ray counterpart of MF83 (the MF nomenclature refers to the source number in Matonick & Fesen (1997)) was deemed the most likely to be a hypernova remnant and was discussed most extensively by Wang (1999). (Unfortunately, the other more likely hypernova remnant candidate in M101, NGC 5471B, lies outside of the region covered by the S3 chip, or by any operational CCD during the observation.) The other two objects, MF54 and MF57, were deemed less plausible as hypernova remnants as their optical morphology was filled (rather than shell-like) and thus not likely to have entered the X-ray bright pressure-driven snowplow phase. In addition, the angular offsets between the positions of the optical and X-ray counterparts were also larger for MF54 and MF57 than for MF83, and were border-line cases for association. We will discuss all three sources in this paper. Section 2 discusses the data and data analysis, § 3 discusses the results, and § 4 presents our conclusions.
2 Data and Analysis
The new data presented here are from a deep (97.4 ks) Chandra AO-1 observation of M101 (Sequence ID 600111) which took place on 2000 March 26-27. The observation primarily utilized the ACIS S3 backside-illuminated CCD chip to maximize the instrumental sensitivity at low energies. The pointing direction () was slightly offset from the galactic nucleus () to provide better S3 coverage of the region of M101 exhibiting diffuse keV emission (Snowden & Pietsch, 1995), as well as other objects of interest. The observation occurred during a quiet period of the particle background providing an exceptionally clean data set. A more extensive discussion of the observation will be provided in Pence et al. (2001), which will provide a catalog of the detected sources.
Processing the delivered data consisted of executing the “acisclean” perl script of K. Arnaud and I. George (private communication) to remove bad pixels and provide event grade selection. Appropriate detector response matrices (rmfs) and effective area files (arfs) were produced for the three sources, again using scripts provided by K. Arnaud along with the CIAO software package of the Chandra X-ray Center. Source and background data were extracted and spectral and temporal properties fit using the HEASARC HEASoft package. The sources were all reasonably bright with source counts ranging from .
2.1 Temporal Variability
As extended objects, hypernovae remnants should show no temporal variation over the duration of the observation. To search for any variability, we binned the data into 2 ks intervals to provide for reasonable statistics and fit for a constant count rate. The data for P70 (MF54/H29) and P76 (MF57/H30) were consistent with a constant flux with reduced values of 0.92 and 0.76, respectively. (The source names P67, P70, P76, and P104 used in this paper refer to the source numbers in Pence et al. (2001), while the source names H29 and H30 refer to the source numbers in Wang, Immler, & Pietsch (1999).
P104 (MF83/H36), on the other hand, shows significant variation from a constant flux with a reduced value of 4.89, which clearly rules out a hypernova remnant origin. The light curves are shown in Figure 1. We note that one of the two associations discussed by Wang (1999), MF37/H19, which were outside of the region covered by the S3 chip in our observation was also eliminated as a hypernova remnant candidate because of its temporal variability.

| Chandra | Wang et al. (1999) | This Work | |||||||
|---|---|---|---|---|---|---|---|---|---|
| Source | S14(0.5-2 keV)a,ba,bfootnotemark: | Count RateccUnits of counts s-1. | S14(0.5-2 keV)aaUnits of ergs cm-2 s-1. The quoted errors, when listed, are . | S14(0.5-10 keV)aaUnits of ergs cm-2 s-1. The quoted errors, when listed, are . | L38(0.5-10 keV)d,ed,efootnotemark: | ffPhoton index from the power-law fit, the quoted errors are . or kTggTemperature (keV) of fitted thermal equilibrium (Raymond & Smith 1977) model, the quoted errors are . | hhUnits of HI cm-2, the quoted errors are . | VariablejjConstant fit to data binned in 2.0 ks bins, value in parentheses. | |
| P67 (MF54) | 0.26 | 0.049 | 0.043 | ggTemperature (keV) of fitted thermal equilibrium (Raymond & Smith 1977) model, the quoted errors are . | 0.1kkFixed value. | 1.82/2/0.48 | |||
| P70 | 1.72 | 8.7 | 1.9 | 5.3 | ffPhoton index from the power-law fit, the quoted errors are . | 28.1/24/0.25 | No (0.92) | ||
| P76 | 1.61 | 10.1 | 2.0 | 9.1 | ffPhoton index from the power-law fit, the quoted errors are . | 24.9/30/0.73 | No (0.76) | ||
| P104 (MF83) | 1.32 | 6.9 | 1.5 | 2.0 | ffPhoton index from the power-law fit, the quoted errors are . | 21.3/21/0.44 | Yes (4.89) | ||
The sources show only slight long-term variation in their fluxes when compared to the Wang, Immler, & Pietsch (1999) data. We have recalculated the fluxes from the ROSAT HRI deep-exposure count rates using the Chandra-determined spectrum (see § 2.2) for the conversion, and the current values for P70, P76, and P104 are 10%, 24%, and 14% higher, respectively (Table 2), where the uncertainties from counting statistics are %. The fact that the fluxes are all systematically higher for the three independent sources suggests that there may be an error in the interobservatory comparison. With such a systematic error at the % level, then all sources would have varied at only the % level. We note that the flux of P104 in the ROSAT PSPC observation determined using the Chandra spectral fit is only % higher than the current value.
2.2 Spectral Properties

| Source | S14(0.5-2 keV)aaUnits of ergs cm-2 s-1. The quoted errors, when listed, are . | S14(0.5-10 keV)aaUnits of ergs cm-2 s-1. The quoted errors, when listed, are . | L38(0.5-10 keV)b,cb,cfootnotemark: | T (keV)ddUnits of ergs s-1. | eeDeabsorbed luminosity. | ff value/degrees of freedom/ probability. |
|---|---|---|---|---|---|---|
| P70 | 1.9 | 4.5 | 27.6/24/0.28 | |||
| P76 | 2.0 | 8.0 | 21.1/30/0.70 | |||
| P104 | 1.5 | 1.4 | 28.4/21/0.13 |
The fitted spectra for P70, P76, and P104 are shown in Figure 2. In all three cases a simple absorbed power law spectrum adequately fits the data, as shown in Table 2. In all cases the power-law fits show evidence for additional absorption beyond that provided by the Milky Way, ranging from HI cm-2. The upper values are well above the typical thickness of the M101 disk implying that the sources are embedded in significant enhancements in the density of the interstellar medium, or are sources with intrinsic absorption. A bremßtrahlung model (Table 3) fit the harder spectra of P70 and P76 well but was less successful for the softer spectrum of P104. The bremßtrahlung fits require lower values for , and except for P76 are consistent with the Galactic column plus a reasonable value for the absorption by the interstellar medium in the disk of M101.
The spectra of P70 and P76 are reasonably well fit by thermal spectra with keV, which are essentially power-law in shape. The spectrum of P104 is poorly fit by a thermal emission model, although the best-fit temperature is significantly lower at keV. Thus, in all three cases, the source spectra are best fit by continuum emission models.
2.3 Positions
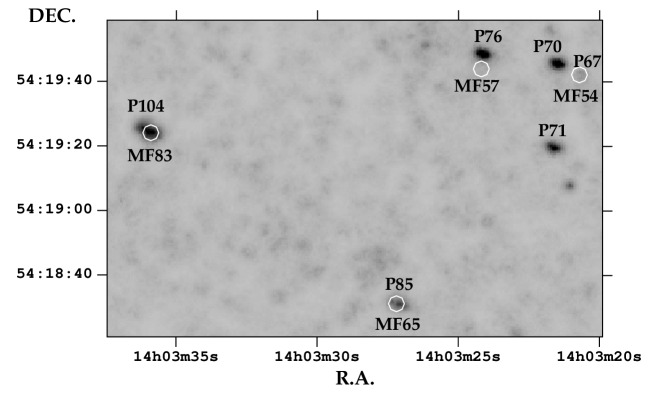
Chandra source coordinates (Pence et al., 2001) were determined using reprocessed data providing positions accurate to . The Pence et al. (2001) and Wang (1999) positions of the three sources considered here agree to . Figure 3 shows the Chandra data for a limited region of M101 surrounding the three hypernova remnant candidates. The positions of the Matonick & Fesen (1997) supernova remnants are indicated by diameter circles. The positions of MF54 and MF57 in the upper right of the image are clearly inconsistent with the bright X-ray sources in the vicinity with offsets of and , respectively. (There is an apparent faint enhancement at the source position of MF54, the source at the far right, which is discussed below.) However, the positions are close enough to have justified the conclusion, drawn by Wang (1999) from the lower angular resolution ROSAT HRI data, that they were possibly associated, and are actually in relatively good agreement with the offsets of and quoted in that paper. The projected separations between the X-ray positions of P70 and P76 and the optical positions of MF54 and MF57 are 290 pc and 170 pc, respectively.
2.4 MF54, Will the Real SNR Please Stand Up
We have detected a faint source (P67) at the optically-determined position of MF54 at the level. Accepting the lower reliability of spectral fits to data with poor statistics (note that there are source counts and background counts in the spectrum from the source region), we have extracted and fit the data to test for consistency with the attribution of the observed emission to an SNR source. Using an absorbed thermal model, the best fit yields keV and H I cm-2 with (with one degree of freedom). The fitted values for and are essentially unconstrained, however. The implied flux ( keV) is ergs cm-2 s-1 with an unabsorbed luminosity of ergs s-1. Fixing the absorption at H I cm-2, a level closer to the nominal disk absorption of M101 plus that from the Milky Way, and refitting the data yields keV with (with two degrees of freedom). The flux and unabsorbed luminosity in this case are ergs cm-2 s-1 and ergs s-1. The latter values are completely reasonable for a supernova remnant with a diameter of pc (determined by Matonick & Fesen (1997)), and the quality of the fit is still reasonable.
Alternatively we fit continuum power law and blackbody spectra to the data. The best fit for an absorbed power law, with , required an exceptionally soft photon index of 8.0 and absorption of H I cm-2. The blackbody spectrum fared slightly worse with keV and H I cm-2 with (as with the thermal model, the values for the fitted parameters were essentially unconstrained). While not exceptionally significant (even the black body fit was still acceptable at the % level), these poorer quality fits support the attribution of the detected flux to thermal emission from a supernova remnant. In both cases the fitted soft spectra coupled with fitted high absorption act to imitate the intrinsically more narrowly peaked spectrum of the probable thermal emission.
3 Discussion
If the bright sources are not hypernovae remnants, what are they? In the case of MF83, where the X-ray emission is coincident with the optical position of the supernova remnant, a recent paper by Lai et al. (2001) provides some information. Based on deep ground-based and HST optical images and echelle spectra, they provided a detailed look at MF83, and found that it has a diameter of pc (rather large for a supernova remnant), contains several OB associations, and has several H II regions associated with its rim. Because of these aspects as well as arguments based on the observed expansion velocities and optical line ratios, Lai et al. (2001) suggest that MF83 should be more accurately characterized as a superbubble and star-formation region rather than as a supernova remnant. With the temporal variability, power-law spectrum, and unresolved nature of the Chandra source, we suggest that the bulk of the observed flux is from an X-ray binary associated with the superbubble.
The bright sources associated by Wang (1999) with MF54 and MF57 provide a different challenge. By their positions they are clearly not associated with the supernova remnants nor with any objects in the Simbad catalog. Given their power law spectra and intrinsic absorption, either an AGN or X-ray binary origin are possible. Using the curve published in Mushotzky et al. (2000) (relying in the appropriate flux range on ROSAT data from Hasinger et al. (1998)), only such sources should be found on an S3 chip observation at the flux level of ergs cm-2 s-1 and above. Finding two such sources within of each other is unlikely. On the other hand, the sources are kpc from the galactic nucleus, about % of the equivalent solar circle in M101. Thus the identification of the sources as X-ray binaries associated with M101 is not unreasonable.
To further investigate the source identifications we compare the spectral properties derived here to the sources in Christian & Swank (1997) (their Figure 25), where the value for from the fits to the unsaturated Compton (USC) emission model are plotted as a function of luminosity. Due to the limited statistics at high energies, we were unable to constrain the scaling energy of the USC model; we therefore adopted a typical Milky Way value of 4 keV. Figure 4 displays the results, where we have also added points for LMC X-1, X-3, and X-4. The M101 sources occupy a region of this diagram distinct from the Milky Way sources, but compare well with the LMC sources. One possible cause of the difference is the nature of the compact object: while most of the Milky Way sources discussed by Christian & Swank (1997) are neutron star binaries, LMC X-1 and X-3 are black hole candidates. Since the M101 sources are all near or above the Eddington limit for a neutron star binary, they are black hole candidates as well. The separation seen in Figure 4 can be taken as an additional support for the view that the M101 sources are black hole binaries in a soft, high state. The spectral properties of these and other bright sources of M101 will be discussed in Mukai et al. (2001).

4 Conclusions
We have considered the three X-ray source/optical supernova remnant associations that were suggested as possible hypernova remnant candidates by Wang (1999), which were covered by our Chandra deep exposure of M101. The most plausible case, that of MF83, is clearly ruled out because of its temporal variability. The two less plausible candidates, MF54 and MF57, are ruled out by their positions, which are inconsistent with the optically identified supernova remnants. However, we have detected an X-ray source consistent with the optical position of MF54 which has a spectrum and luminosity consistent with those of a normal supernova remnant. The bright sources, P70, P76, and P104, have luminosities on the high end of the Milky Way LMXB distribution but have spectra which are significantly softer. However, the attribution of the observed emission to LMXBs is not unreasonable.
The positional correlation, at least in the case of P104/MF83, of the X-ray sources with the optically-identified supernova remnants is suggestive of an association between the two, even if the emission is not extended and from the remnant itself. Clearly, supernovae provide a simple mechanism for producing a black hole as well as the remnant. However, for the P70/MF54 and P76/MF57 pairs the situation is not so simple. The projected separations between the binary systems and the centers of the supernova remnants are on the order of 200 pc, which is ten times the optical diameters of the remnants. Thus while the progenitor(s) of the P104 binary system could easily have contributed to the energy of the MF83 superbubble, it is much less likely that progenitors of P70 and P76 contributed similarly to MF54 and MF57.
References
- Bautz et al. (1998) Bautz, M. W. et al. 1998, Proc. SPIE, 3444, 210
- Christian & Swank (1997) Christian, D. J., & Swank, J. H. 1997, ApJS, 109, 177
- Fryer & Woosley (1998) Fryer, C. L., & Woosley, S. E. 1998 ApJL, 502, L9
- Garmire et al. (1992) Garmire, G. P., Ricker, G. R., Bautz, M. W., Burke, B., Burrows, D. N., Collins, S. A., Doty, J. P., Gendreau, K., & Lumb, D. H. 1992, in AIAA, Space Programs and Technologies Conf. (New York: AIAA), 8 Nousek, J. A.
- Hasinger et al. (1998) Hasinger, G., Burg, R., Giacconi, R., Schmidt, M., Trümper, J., & Zamorani, G. 1998, A&A, 329, 482
- Lai et al. (2001) Lai, S.-P., Chu, Y.-H., Chen, C.-H. R., Ciardullo, R., & Grebel, E. K., submitted
- Matonick & Fesen (1997) Matonick, D. M., & Fesen, R. A. 1997, ApJS, 112, 49
- Mukai et al. (2001) Mukai, K., et al. 2001, ApJ, in preparation
- Mushotzky et al. (2000) Mushotzky, R. F., Cowie, L. L., Barger, A. J., & Arnaud, K. A. 2000, Nat, 404, 459
- Paczyński (1998) Paczyński, B. 1998, ApJ, 494, L45
- Pence et al. (2001) Pence, W., et al., 2001, ApJ, in preparation
- Snowden & Pietsch (1995) Snowden, S. L., & Pietsch, W. 1955, ApJ, 452, 627
- Stetson et al. (1998) Stetson, P. B., et al. 1998, ApJ, 290, 449
- Wang (1999) Wang, Q. D. 1999, ApJL, 517, L27
- Wang, Immler, & Pietsch (1999) Wang, Q. D., Immler, S., & Pietsch, W. 1999, ApJ, 523, 121
- Weisskopf, O’Dell, & van Speybroeck (1996) Weisskopf, M. C., O’dell, S. L., & van Speybroeck, L. P. 1996, Proc. SPIE, 2805, 2