Discovery of Radio Emission from the Brown Dwarf LP94420
This paper has been submitted to Nature. You are free to use the results here for the purpose of your research. In accordance with the editorial policy of Nature, we request that you not discuss this result in the popular press. If you have any question or need clarifications please contact Edo Berger, ejb@astro.caltech.edu.
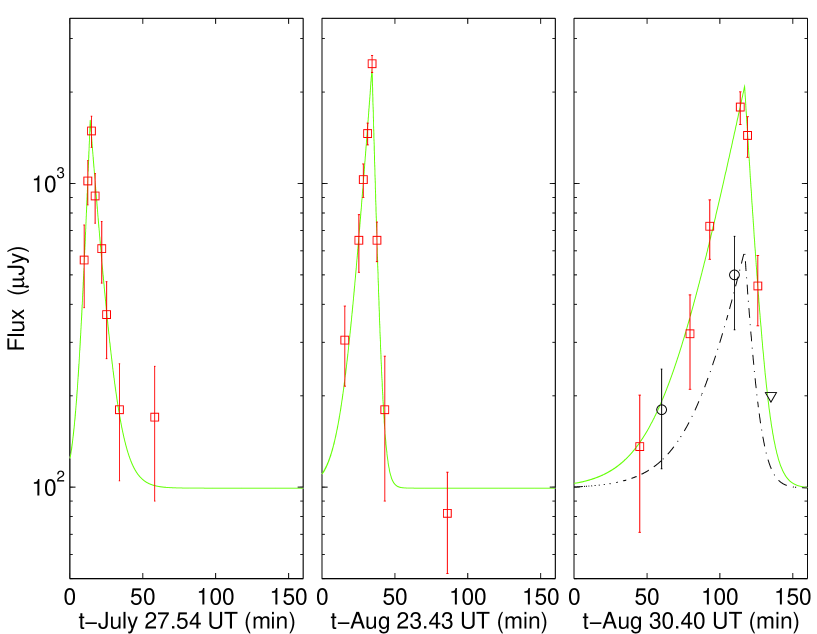
Following the detection of an X-ray flare from the brown dwarf LP94420 on 1999 December 15 by the Chandra X-ray Observatory [Rutledge et al.¡3¿], we observed the X-ray position of this source with the Very Large Array (VLA) on 2000 July 27.54 UT, and detected a radio source. We tested the radio emission for variability by imaging subsets of the observation and constructing a light-curve, and found a bright flare, as well as quiescent emission (see Figure 1). In subsequent observations we detected two additional flares, and quiescent emission at 4.9 and 8.5 GHz. A log of all observations, the details of the data reduction, and results can be found in Table 1 and Figure 1. The quiescent emission at the location of the source was detected at the level in individual measurements, but with a level of 2.5 and 5.5 for the average of all measurements at 4.9 and 8.5 GHz, respectively. Since we know the precise location of the source, these levels represent a significant detection of quiescent emission.
This set of observations comprises the first detection of persistent quiescent and flaring emission from a bona-fide brown dwarf.[Neuhäuser et al.¡1¿],[Krishnamurthi, Leto & Linsky¡12¿] Moreover, the levels of emission — approximately 80 Jy in quiescence and 2 mJy at peak-flare — are highly unusual in the context of stellar coronal emission. We now seek to interpret the quiescent and flaring emission in this framework.
Coronal activity in a broad range of stars has been studied by Guedel and Benz who found[Guedel & Benz¡8¿] a simple empirical relation between the quiescent X-ray and radio luminosities, Hz-1. Using this relation with the Chandra-determined[Rutledge et al.¡3¿] upper limit on the quiescent X-ray luminosity of LP94420, erg sec-1 ( keV band), we find that the expected quiescent radio luminosity is erg sec-1 Hz-1, which translates to a received flux density of Jy on Earth. Therefore, the flux density we measured in quiescence is at least four orders of magnitude larger than predicted.
Benz and Guedel also found[Benz & Guedel¡9¿] a similar, but slightly non-linear, relation between X-ray and radio flares from a broad range of stars. The non-linearity means that for flaring emission the ratio varies with the luminosity of the flare. For the X-ray luminosity detected by Chandra, erg sec-1, the relation is Hz, and we therefore predict an observed radio flux density, Jy. The actual observed value is approximately times higher.
Even though the X-ray and radio observations were not carried simultaneously, X-ray flares bright enough to resolve the discrepancy are not likely. In order to conform to the Benz–Guedel relation, the luminosity of the X-ray flares would have to be approximately equal to the bolometric luminosity of LP94420. Such superflaring activity[Schaefer, King & Deliyannis¡13¿],[Rubenstein & Schaefer¡14¿] has been observed in nine solar-type stars, but with an average recurrence time of years to centuries. In contrast, the average recurrence time for the radio flares is of order several hours (see Table 2). Moreover, with such a short recurrence time, Chandra would have been expected to detect at least one of these superflares during the 13-hour observation of LP94420. We can therefore conclude that the Benz–Guedel relation for flaring emission is severely violated, and the radio emission from LP94420 is highly abnormal when compared to stellar emission.
The brightness temperature of the radio emission, approximately K in quiescence and K during flares, indicates that the emission mechanism is non-thermal. Most likely the emission is via synchrotron, which comes from relativistic electrons gyrating in a magnetic field and emitting radio waves at high harmonics of the electron gyrofrequency. Another possible mechanism is coherent emission, but the observed properties of the quiescent and flaring emission: flare timescale of order minutes, polarization of order 30%, broad-band emission, and K, all point to synchrotron emission;[Haisch, Strong & Rodono¡11¿],[Dulk¡15¿] for coherent emission we would expect a much shorter timescale, a much higher polarization and brightness temperature, and narrow-band emission. For a comprehensive treatment of synchrotron theory we refer the reader to the work of Rybicki and Lightman[Rybicki & Lightman¡16¿].
To find the spectral properties of the flaring emission, and thus the physical properties of the emission region around LP94420, we use the observed fraction of circular polarization in the flaring emission at 8.5 GHz, , which matches theoretical predictions[Bruggmann & Magun¡17¿],[Bastian, Benz & Gary¡18¿],[Dulk & Marsh¡19¿] for optically-thin synchrotron emission at moderate values of the gyrating electrons’ minimum Lorentz factor (). In addition, we find from the simultaneous observation on 2000 August 30.40 UT that the spectral index between 4.9 and 8.5 GHz was , indicating that the emission at 4.9 GHz was optically-thick (see Figure 1c). We therefore conclude that the radio spectrum of the flaring emission peaks at about 8.5 GHz, so that most of the energy in the flares at radio wavelengths is released at this frequency. Thus, we can use GHz and as an excellent approximation for the flare energetics (see Table 2).
The amount of energy released in the flares is estimated by using an exponentially rising and decaying model, and solving for the peak flux density and rise and decay times (see Table 2). We find that the energy released in each of the flares at radio wavelengths is approximately the same, ranging from ergs. Interestingly, this energy release is several times larger than for the brightest solar flares[Bastian, Benz & Gary¡18¿]. From the flare model we also find that the best-fit quiescent flux density is Jy, and that the probability of no quiescent component is . This result serves to bolster our claim that we detected quiescent emission at a level of 100 Jy from LP94420.
From the fraction of circular polarization we can also estimate the value of using the relation for synchrotron emission , which gives . Using the more accurate formalism of Dulk and Marsh[Dulk & Marsh¡19¿], we get a similar result.
With the values of , , and we now calculate the magnetic field strength and the electron density during a flare from the basic equations of synchrotron theory[Rybicki & Lightman¡16¿], and from the minimum energy argument, which relies on the premise that the energy of a source is minimized in equipartition.[Burbidge & Burbidge¡20¿],[Readhead¡21¿] From synchrotron theory we find that the magnetic field strength is G, and the total number of electrons is (see Figure 1). From equipartition we find that the “equipartition radius”[Scott & Readhead¡22¿] of LP94420 is as, while its physical angular size is as, indicating that the energy is released from a thin shell around the source, with a volume, cm3. The electrons’ Lorentz factor calculated from equipartition is , which is exactly the value we calculated independently from circular polarization, and hence we again find that G and . Using the volume of the emitting shell we calculate an electron number density, cm-3. For comparison, the surface magnetic field of Jupiter[Smith et al.¡23¿] is approximately 10 G, while in Solar flaring emission[Bruggmann & Magun¡17¿] the magnetic field is G, but the electron density and energy are much lower than in the flaring emission from LP94420.
Similarly, the magnetic fields of some active dwarf M stars[Saar & Linsky¡10¿],[Haisch, Strong & Rodono¡11¿] reach strengths of a few kG, and their X-ray luminosities in quiescence[Fleming et al.¡24¿],[Giampapa et al.¡25¿],[Fleming et al.¡26¿] are of order erg sec-1. These are markedly different conditions than those in and around LP94420, as evidenced by the weak magnetic field and non-detectable quiescent X-ray emission, but they may help to elucidate several lines of evidence that point to no magnetic field activity in this object. Extremely low levels of H emission[Tinney & Reid¡5¿], which indicate no chromospheric activity, rapid rotation[Tinney & Reid¡5¿], which indicates no magnetic braking, and relatively old age[Tinney¡4¿], which implies a quenched dynamo mechanism, all agree with a magnetic field strength of a few Gauss rather than the much stronger fields observed in M dwarfs, the Sun, and even Jupiter.
We finally note that radio synchrotron and X-ray emission are expected in the context of a basic model of coronal emission — the magnetic reconnection process,[Bastian, Benz & Gary¡18¿],[Sturrock¡27¿] and that the previously noted constancy of radio-wavelength energy release during flares appears to indicate that magnetic reconnection in LP94420 takes place once the magnetic fields reach a critical strength, and therefore release approximately the same amount of energy every time.
It is still not clear why the emission from LP94420 violates the Guedel–Benz relations so severely, but it is possible that this violation is tied to the difference in physical conditions in LP94420 relative to M dwarfs, namely a very weak magnetic field. It is therefore crucial that radio and X-ray observations of this and other brown dwarfs be undertaken in order to establish whether similar conditions and unusually strong radio emission are common to some of these objects. In particular, it is clear that the radio regime is highly effective for detailed studies of both the flaring and quiescent emission due to the ease and availability of radio observations and the excellent sensitivity of radio telescopes.
References
- [Neuhäuser et al.¡1¿] Neuhäuser, R., Briceño, C., Comerón, F., Hearty, T., Martín, E. L., Schmitt, J. H. M. M., Stelzer, B., Supper, R., Voges, W. & Zinnecker, H. Search for X-ray emission from bona-fide and candidate brown dwarfs. Astr. Astrophys. 343, 883–893 (1999).
- [Durney, De Young & Roxburgh¡2¿] Durney, B. R., De Young, D. S. & Roxburgh, I. W. On the generation of the large-scale and turbulent magnetic fields in solar-type stars. Solar Phys. 145, 207–225 (1993).
- [Rutledge et al.¡3¿] Rutledge, R. E., Basri, G., Martín, E. L. & Bildsten, L. Chandra Detection of an X-Ray Flare from the Brown Dwarf LP 944-20. Astrophys. J. 538, L141–L144 (2000).
- [Tinney¡4¿] Tinney, C. G. The intermediate-age brown dwarf LP944-20. Mon. Not. R. astr. Soc. 296, L42–L44 (1998).
- [Tinney & Reid¡5¿] Tinney, C. G. & Reid, I. N. High-resolution spectra of very low-mass stars. Mon. Not. R. astr. Soc. 301, 1031–1048 (1998).
- [Tinney & Tolley¡6¿] Tinney, C. G. & Tolley, A. J. Searching for weather in brown dwarfs. Mon. Not. R. astr. Soc. 304, 119–126 (1999).
- [Kirkpatrick, Henry & Irwin¡7¿] Kirkpatrick, J. D., Henry, T. J. & Irwin, M. J. Ultra-Cool M Dwarfs Discovered by QSO Surveys.I: The APM Objects. Astron. J. 113, 1421–1428 (1997).
- [Guedel & Benz¡8¿] Guedel, M. & Benz, A. O. X-ray/microwave relation of different types of active stars. Astrophys. J. 405, L63–L66 (1993).
- [Benz & Guedel¡9¿] Benz, A. O. & Guedel, M. X-ray/microwave ratio of flares and coronae. Astr. Astrophys. 285, 621–630 (1994).
- [Saar & Linsky¡10¿] Saar, S. H. & Linsky, J. L. The photospheric magnetic field of the dM3.5e flare star AD Leonis. Astrophys. J. 299, L47–L50 (1985).
- [Haisch, Strong & Rodono¡11¿] Haisch, B., Strong, K. T. & Rodono, M. Flares on the sun and other stars. Ann. Rev. Astr. Ap. 29, 275–324 (1991).
- [Krishnamurthi, Leto & Linsky¡12¿] Krishnamurthi, A., Leto, G. & Linsky, J. L. A Search for Radio Emission at the Bottom of the Main Sequence and Beyond. Astron. J. 118, 1369–1372 (1999).
- [Schaefer, King & Deliyannis¡13¿] Schaefer, B. E., King, J. R. & Deliyannis, C. P. Superflares on Ordinary Solar-Type Stars. Astrophys. J. 529, 1026–1030 (2000).
- [Rubenstein & Schaefer¡14¿] Rubenstein, E. P. & Schaefer, B. E. Are Superflares on Solar Analogues Caused by Extrasolar Planets? Astrophys. J. 529, 1031–1033 (2000).
- [Dulk¡15¿] Dulk, G. A. in LNP Vol. 291: Cool Stars, Stellar Systems and the Sun (eds Linsky, J. L. & Stencel, R. E.) 72–82 (Berlin, Springer–Verlag, 1987. 537 p., 1987).
- [Rybicki & Lightman¡16¿] Rybicki, G. B. & Lightman, A. P. Radiative processes in astrophysics. New York, Wiley-Interscience, 1979. 393 p. (1979).
- [Bruggmann & Magun¡17¿] Bruggmann, G. & Magun, A. Temporal and spectral characteristics of the circular polarization of solar microwave bursts. Astr. Astrophys. 239, 347–355 (1990).
- [Bastian, Benz & Gary¡18¿] Bastian, T. S., Benz, A. O. & Gary, D. E. Radio Emission from Solar Flares. Ann. Rev. Astr. Ap. 36, 131–188 (1998).
- [Dulk & Marsh¡19¿] Dulk, G. A. & Marsh, K. A. Simplified expressions for the gyrosynchrotron radiation from mildly relativistic, nonthermal and thermal electrons. Astrophys. J. 259, 350–358 (1982).
- [Burbidge & Burbidge¡20¿] Burbidge, G. R. & Burbidge, E. M. The Sources of Radio Emission in NGC 5128 and NGC 1316. Astrophys. J. 125, 1–8 (1957).
- [Readhead¡21¿] Readhead, A. C. S. Equipartition brightness temperature and the inverse Compton catastrophe. Astrophys. J. 426, 51–59 (1994).
- [Scott & Readhead¡22¿] Scott, M. A. & Readhead, A. C. S. The low-frequency structure of powerful radio sources and limits to departures from equipartition. Mon. Not. R. astr. Soc. 180, 539–550 (1977).
- [Smith et al.¡23¿] Smith, E. J., Davis, L., Jones, D. E., Coleman, P. J., Colburn, D. S., Dyal, P. & Sonett, C. P. Jupiter’s magnetic field, magnetosphere, and interaction with the solar wind - Pioneer 11. Science 188, 451–455 (1975).
- [Fleming et al.¡24¿] Fleming, T. A., Liebert, J., Gioia, I. M. & Maccacaro, T. M dwarfs from the Einstein extended medium sensitivity survey. Astrophys. J. 331, 958–973 (1988).
- [Giampapa et al.¡25¿] Giampapa, M. S., Rosner, R., Kashyap, V., Fleming, T. A., Schmitt, J. H. M. M. & Bookbinder, J. A. The Coronae of Low-Mass Dwarf Stars. Astrophys. J. 463, 707–725 (1996).
- [Fleming et al.¡26¿] Fleming, T. A., Giampapa, M. S., Schmitt, J. H. M. M. & Bookbinder, J. A. Stellar coronae at the end of the main sequence - A ROSAT survey of the late M dwarfs. Astrophys. J. 410, 387–392 (1993).
- [Sturrock¡27¿] Sturrock, P. A. Chromospheric Magnetic Reconnection and Its Possible Relationship to Coronal Heating. Astrophys. J. 521, 451–459 (1999).
Acknowledgements
We thank B. Clark for the allocation of ad hoc VLA time. We also thank D. E. Gary and R. Sari for helpful discussions. The initial observation of LP94420 was undertaken as part of the National Radio Astronomy Observatory (NRAO) VLA Summer Program funded by the National Science Foundation (NSF). The National Radio Astronomy Observatory is a facility of the NSF operated under cooperative agreement by Associated Universities, Inc.
| Date | Frequency | On-source observation time | Synthesized beam size | |
|---|---|---|---|---|
| (UT) | (GHz) | (ksec) | (arcsec) | (Jy) |
| 2000 July 27.54 | 8.46 | 3.6 | ||
| 2000 Aug 11.47 | 8.46 | 4.2 | ||
| 2000 Aug 15.45 | 4.86 | 1.7 | ||
| 2000 Aug 15.45 | 8.46 | 1.6 | ||
| 2000 Aug 23.43 | 8.46 | 5.6 | ||
| 2000 Aug 30.40 | 4.86 | 7.2 | ||
| 2000 Aug 30.40 | 8.46 | 7.2 | ||
| 2000 Sep 6.39 | 8.46 | 8.8 | ||
| 2000 Sep 6.39 | 22.5 | 8.8 | ||
| 2000 Sep 20.34 | 4.86 | 10.5 | ||
| 2000 Sep 20.34 | 8.46 | 10.5 | ||
| 2000 Sep 27.35 | 8.46 | 10.2 |
In the initial observation we detected an object with a flux Jy at (J2000)=03h39m35.3s, (J2000)=, with an error of in both and . We identify our detection with the brown dwarf LP94420 based on the positional coincidence between this detection and the X-ray position[Rutledge et al.¡3¿] provided by Chandra.
| Parameter | 2000 July 27.5727 | 2000 Aug 23.4407 | 2000 Aug 30.4849 |
|---|---|---|---|
| (mJy) | |||
| (min) | |||
| (min) | |||
| (min) | |||
| ( ergs) |
The energy released in the flares at radio wavelengths is calculated using the equation , where pc is the distance to the source, Hz is the peak frequency, is the peak flux density in units of erg sec-1 cm-2 Hz-1, and is the temporal extent of the flare. We find that all three flares released approximately the same amount of energy at 8.5 GHz.
Based on these lightcurves we can calculate the magnetic field strength and the number density of trapped electrons using the equations for synchrotron emission: and erg sec-1, where and are the electron charge and mass, respectively, is the Thomson cross-section, is the total number of trapped electrons, is the distance to the source, and is the peak-flare flux density.