Spectral Energy Distributions of Blazars: Facts and Speculations
Abstract
We discuss the present knowledge about the Spectral Energy Distributions (SEDs) of blazars within a unified approach emphasizing overall similarities. The properties of the average SEDs of different samples of blazars suggest that more powerful sources contain on average less energetic particles. Detailed studies of TeV emitting blazars show that the energy of the particles emitting the bulk of the power increases during flares. A framework for a general theoretical understanding is proposed. We present recent results on the SEDs of a group of blazars with emission lines, allowing to estimate both the luminosity in the jet and the luminosity of the accretion disk. Implications for the origin of the power carried by relativistic jets are considered.
Osservatorio Astronomico di Brera, Via Brera 28 20121 Milano I
1. Introduction
It is now generally accepted tha the blazar ”phenomenon” (highly polarised and rapidly variable radio/optical continuum) is due to a relativistic jet pointing close to the line of sight. This concept, introduced by Blandford and Rees in 1978, represented a fundamental break through. It took however a long time to gather sufficient data to apply it consistently and quantitatively to individual objects and to object classes. Taxonomy has confused the issues, since observational definitions were based (as usual in astronomy) on analogies with known objects rather than on well defined intrinsic properties. Moreover variability could alter the ”classification” of the same object. After decades of studies to distinguish between objects with or without emission lines (flat spectrum quasars vs. BL Lacs) or between radio bright and X-ray bright BL Lacs, we think that presently the most productive approach is to assume that all blazars contain relativistic jets and ask in what way these jets differ in different objects and eventually why.
Therefore here and in the following we will assume that Quasars with Flat Radio Spectrum (FSQs, which include OVVs and HPQs) and BL Lac objects are essentially ”similar” objects in the sense that the nature of the central engine is similar apart from some basic scales. The obvious parameters are the central black hole mass, angular momentum and the accretion rate (Blandford 1990). We don’t know yet what governs the phenomenology but we assume that it is some combination of these three parameters. The goal is to understand the role of these fundamental parameters starting from a physical comprehension of the phenomenology. We will therefore take a particular ”point of view” and not attempt a review of all the work carried out in this field.
2. The average SEDs of different samples of blazars.
It was noted early on that the SEDs of blazars exhibited remarkable systematic properties (Landau et al. 1986, Sambruna et al. 1996). The subsequent discovery by the Compton Gamma Ray Observatory of gamma-ray emission from blazars (a summary can be found in Mukherjee et al. 1997) was a major step forward, showing that in many cases the bulk of the luminosity was emitted in this band and questioning the importance of previous studies of the SEDs at lower frequencies.
Although a large fraction of the sky was surveyed with the EGRET instrument on board CGRO, its sensitivity was just sufficient to detect the brightest or flaring sources. Therefore the results did not allow to define a complete sample.
A simple approach was taken by Fossati et al. (1998) in order to explore systematically the properties of the blazar SEDs up to gamma-ray energies. The procedure was to construct ”average” SEDs of known complete samples of blazars (FSRQs from the 2 Jy radiosample, BL Lacs from the 1 Jy radiosample and BL Lacs from the Slew Survey X-ray sample) using published fluxes at 6 wavelengths in the radio to UV interval plus average fluxes and spectral indices in the X-ray and GeV range.
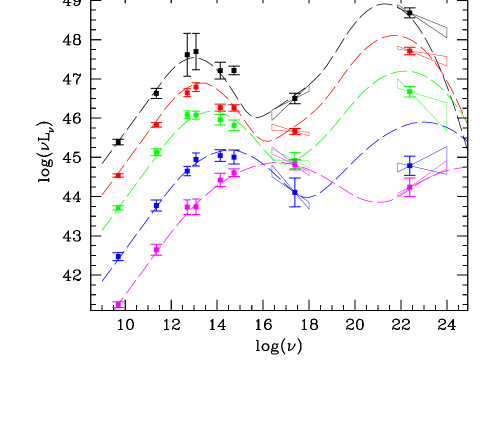
Clear systematic differences emerged between the three samples, in particular concerning the slopes of the X-ray and gamma-ray emission. Moreover the average luminosities of the three samples were different. Since in each sample there are objects with different spectral properties (e.g. X-ray to radio flux ratios) we thought that if luminosity was an important parameter it would be useful to bin the objects not according to their belonging to a specified sample, but according to luminosity only. The result is shown in Fig 1 (from Fossati et al. 1998). Indeed, the resulting SEDs appear homogenous and systematic trends are evident. For each luminosity class the derived SEDs show two very broad components peaking between Hz and between Hz respectively. Analytic curves have been plotted for comparison (see Fossati et al. 1998 for a complete account). The underlying simple assumptions were: i) that the peak frequencies are inversely related to the radio-luminosity. ii) that the ratio of the two peak frequencies in each SED is constant iii) that the height of the second peak is proportional to the radio luminosity. These ”analytic” laws seem to represent the average SEDs quite closely.
2.1. Biases
All the sources in the three samples have radio optical and X-ray data, most have also infrared data, while only a fraction have gamma-ray data. Within the three original samples, the fraction of objects detected in gamma-rays are 19/50, 9/34 and 8/48 respectively.
Thus it is still an open issue whether the -ray properties of the average SEDs are representative of the whole population or are significantly biased. Clearly, since most sources are close to the detection limit and many are known to be strongly variable (e.g. Mukherjee et al. 1997), EGRET preferentially detected those that were in an active state. In an interesting but rarely quoted paper, Impey (1996) showed via MonteCarlo simulations that, assuming all FSQ in the 1 Jy sample have the same average ratio, the properties of the -ray detected sample can be reproduced if the intrinsic average is about 1/10 of the actually observed one, with a ”normal” scatter of about 1 order of amgnitude (the scatter could be due to variability). We did not apply any correction to the SEDs because the estimate though interesting is rather uncertain. Moreover the analysis of Impey refers to FSQ and it would not be justified to assume the same correction factor for all luminosity classes. There can be little doubt however that the average gamma ray fluxes in Fig. 1 are overestimated.
In order to assess the possible differences between blazars detected and non detected in gamma-rays we obtained BeppoSAX observations of ”non gamma-ray” HPQs. A good example is 1641+399 (3C 345): the source is clearly detected up to the PDS range with a hard X-ray luminosity comparable to that in the first peak (Tavecchio et al., in prep). Thus the hypothesis that all blazars emit gamma-rays at an average level not much different than those actually detected with EGRET (within an order of magnitude) finds support.
2.2. The Unified Framework for the SEDs of blazars.
Fig 1. strongly suggests that the same radiation mechanisms operate in all blazars. The SEDs define a spectral sequence ( we will call red and blue the objects at the different extremes of the sequence), implying that the jet properties change with continuity, therefore there are no qualitative differences among jets of different power. Beamed synchrotron and inverse Compton emission from a single population of electrons account very well for the observed SEDs except in the radio to mm range where effects of selfabsorption and inhomogeneity are important (see also Kubo et al. 1998 ). This model predicts that variability of the two spectral components should be correlated especially at frequencies near the peaks. Given the difficulty of getting adequate data, it is remarkable that this has been verified at least in some well studied objects. In the following we will assume that this emission model holds in general.
There are however quantitative differences between jets producing the SEDs depicted in Fig 1.. Adapting model spectra to the observed SEDs of about 50 sources with gamma-ray information (but in many cases rather poor broad band data) Ghisellini et al. 1998 derived the physical parameters of the jets including seed photons of internal (SSC) as well as external (EC) origin. The model fits suggest that the observed trends are due to i) an increasing importance of external seed photons with increasing jet luminosity ii) a decreasing ”critical” energy of the radiating electrons with increasing (total) radiation energy density. The latter dependence is physically plausible since the radiation energy density determines the energy losses of relativistic particles. If the critical electron energies were determined by a balance between injection/acceleration and cooling processes the latter dependence could be understood.
This ”unified” theoretical scheme, attractive as it is, needs to be tested in many respects. One can think of at least two ways of doing so : i) determine the physical parameters in individual objects with good data ii) understand the mechanisms of particle acceleration and injection from detailed variability studies.
More indirectly, if the shapes of blazar SEDs are ”biunivocally” related to luminosity (of course some scatter will have to be allowed for) there must be predictable consequences on number counts and luminosity functions of different types of objects. Even if FSQs and BL Lacs contain ”similar” jets (at least close to the nucleus) as suggested by the continuity of the SEDs, we still need to understand the differences in emission line properties. Also in this respect continuity could hold in the sense that the accretion rate may decrease continuously along the sequence but the emission properties of the disk may not simply scale with the accretion rate.
3. Studies of individual objects.
The detailed study of the spectral and variability characteristics of single Blazars is an important approach complementary to the study of samples described above. In the following we will focus on observations obtained with the Italian-Dutch satellite BeppoSAX.
Unfortunately in the case of red blazars the study of the synchrotron component is difficult, because of the position of the Synchrotron peak, which falls in the poorly covered IR - FIR range. Furthermore the study of the gamma-ray component in the MeV-GeV region of the spectrum has been difficult in the last few years due to the loss of efficiency of EGRET and is now impossible after reentry of CGRO.
We show in Fig. 2 the case of 3C 279, observed with BeppoSAX in January 1997 simultaneously with CGRO (Hartman et al. 2000, ) and close in time (December 1996) with ISO (Haas et al. 1998). The source was found to be in a rather low state, analogous to the low state observed in 1993 (also shown). Also shown for comparison are the two highest states recorded in 1991 and 1997.
A general correlation of the optical X-ray and -ray fluxes is apparent. The FIR data strongly suggest an additional, highly luminous thermal dust component, presumably observed at low inclination with respect to a putative accretion disk. In any case the synchrotron peak is difficult to localize.
The situation is better for blue blazars. In several sources of this class the Synchrotron component peaks in the X-ray band, where numerous satellites can provide good data. In few bright extreme BLLac objects the high energy -ray component is observable from ground with TeV telescopes (for a general account see Catanese & Weekes 1999). In these particular cases the contemporaneous X-ray/TeV monotoring demonstrated well the correlation between the Synchrotron and the IC components. A very good example is Mkn 421 for which we obtained the observation of a simultaneous TeV/X-ray flare with Whipple and BeppoSAX in 1998, probing for the first time the existence of correlation on short (hour) time scales (Maraschi et al. 1999; see also Takahashi et al. 1999, Catanese & Sambruna 2000). When the position of the two peaks can be well determined observationally, as is possible in this type of sources, robust estimates of the physical parameters of the jet can be obtained (e.g. Tavecchio et al. 1998). This was done for both Mkn 421 and Mkn 501; the case of Mkn 501 is shown in Fig 3a.
The broad band response of BeppoSAX allows a reliable determination of the position of the synchrotron peak, , if it falls between 0.1 and 100 keV. We could verify that during the flare of Mkn 421 mentioned previously , moved to higher energies with increasing intensity (Fossati et al. 2000). The same behaviour was exhibited in a more dramatic way by Mkn 501. Its synchrotron peak moved to keV during the extraordinary activity in April 1997. Subsequent snapshot spectra obtained with BeppoSAX showed a systematic decrease of down to keV in June 1999 while the source was fading (Fig. 3b, Tavecchio et al. in preparation). Over this two year period the X-ray light curve as measured by the ASM aboard XTE was not monotonic with an overall decay interrupted by flares. Thus our observations show that correlates with luminosity not only along individual flares but also on much longer timescales.
The vs. luminosity relation observed in the time dependent behaviour of these two sources (higher for higher luminosity) is opposite to that found in the “spectral sequence”, where the peak falls at lower frequencies for objects of higher luminosity.
A general scenario that could include both types of behaviour is the following. Let us suppose that the Lorentz factor of particles emitting at the peak is determined by the equilibrium between the cooling and acceleration processes, namely . Given that , where is the total energy density, and using the general expression , found in the theory of diffusive shock acceleration (see e.g. Kirk et al. 1998) one can write:
| (1) |
This expression is consistent with the correlation found by Ghisellini et al. (1998), provided that the acceleration timescale is, on average, similar in all sources. Flares in single sources can then be interpreted as due to the temporaneous decrease of due to changes in the physical process of acceleration. This scenario seems to apply quite well to Mkn 501 (Tavecchio et al. 2000, in prep), for which it is possible to reproduce the observed variability with the only change of .
4. Jet power vs. accretion power
Finally we wish to discuss some recent results on luminous blazars with emission lines. They are at the high-luminosity end of the sequence, with the Synchrotron peak in the FIR region. In these sources the X-ray emission is believed to be produced through the IC scattering between soft photons external to the jet (produced and/or scattered by the Broad Line Region) and electrons at the low energy end of their energy distribution. Thus measuring the X-ray spectra and adapting a broad band model to their SEDs yields reliable estimates of the total number of relativistic particles involved, which is dominated by those at the lowest energies. This is interesting in view of a determination of the total energy flux along the jet (e.g. Celotti et al. 1997, Sikora et al. 1997). The ”kinetic” luminosity of the jet can be written as
| (2) |
(e.g. Celotti et al. 1997) where is the jet radius, is the bulk Lorentz factor and is the total energy density in the jet, including radiation, magnetic field, relativistic particles and finally protons. If one assumes that there is 1 (cold) proton per relativistic electron the proton contribution is usually dominant.
In high luminosity blazars the UV bump is often directly observed and/or can be estimated from the measurable emission lines, yielding important information on the accretion process. Thus the relation between accretion power and jet power can be explored.
For three sources of this type we performed a detailed analysis of the BeppoSAX data and modeled the overall SED (Fig. 4, Tavecchio et al. 2000). For other 6 sources also observed with BeppoSAX a similar analysis is in progress and the results reported here are still preliminary.

In all cases we estimated the kinetic luminosity of the jet and the luminosity of the disk as described above. We can then compare the two in Fig. 5b. We include also four BL Lac objects (namely BL Lac, ON231, Mkn 501 and Mkn 421) for wich we have reliable information on the power carried by the jet. Unfortunately we can set only upper limits on the luminosity of their putative accretion disks except for BL Lac, where the presence of a broad Hα line allows us to estimate of the ionizing continuum (e.g. Corbett et al. 2000).
The diagram in Fig. 5a shows the comparison between the total radiative luminosity of the jet and the power transported by the jet including the proton contribution which is dominant. The ratio between these two quantities gives directly the ”radiative efficiency” of the jet, which turns out to be , though with large scatter. The line traces the result of a least-squares fit: we found a the slope , indicating a rather constant radiative efficiency along the Blazar sequence (note that the data cover a wide range of about 5 orders of magnitude).
As discussed above we have reliable estimates of the luminosity released by the accretion disk, calculated directly with the luminosity of the blue bump or inferred by the luminosity of emission lines. Therefore we can directely compare the luminosity of the disk, , and the the luminosity of the jet, . In Fig. 5b we report the radiative luminosity of the jet , which is a lower limit of versus . Note that in the case of the four BL Lac objects the disk luminosity is formally an upper limit. A similar approach was pioneered by Celotti et al. 1997, but their estimates of were obtained applying the SSC theory to VLBI data which refer to larger scales .
The first important result is that in some objects the power transported by the jet is much larger (at least an order of magnitude) than the luminosity released through accretion. This result is a strong challenge for models elaborated to explain the formation of jets.
Two main lines of approach consider either extraction of rotational energy from the black hole itself or magnetohydrodynamic winds associated with the inner regions of accretion disks. We briefly discuss here the first case, treated by Blandford & Znajek (1977). The result of their complex analysis is summarized in the well known expression:
| (3) |
Assuming maximal rotation for the black hole, the critical problem is the estimate of the intensity reached by the magnetic field threading the event horizon. Several authors have recently discussed this difficult and subtle issue: here we use the results obtained by Ghosh & Abramovicz (1997) on the basis of equipartition within an accretion disk described by the Shakura and Sunyaev (1973) model. Their estimates for the rotational power are shown in Fig for various values of the mass of the central black hole as a function of the luminosity observed from the disk. The latter is related to the accretion rate which appears in the formulae of Ghosh & Abramovicz (1997) adopting an efficiency of 10%. Clearly the model fails to explain the large power observed in the jets of bright quasars, even for BH masses ().
In another class of models it is assumed that the energy powering the jet is extracted directly from the accretion disk. Assuming a similar efficiency, , for the conversion of both the accretion power and the jet power into radiation, the plot in Fig. 5 suggests that the mechanism responsible for the formation of the jet is able to split the total accreted power in such a way that .
5. Conclusions
The study of broad band SEDs and their variability is essential for understanding blazars. A unified approach is possible and valuable since it can be tested and possibly disproved. While the phenomenological framework is suggested to be ”simple” (e.g. ”red” blazars are highly luminous and emit GeV gamma-rays while ”blue” blazars have low luminosity and emit TeV gamma-rays) we do not yet know what determines the emission properties of jets of different power nor what determines the jet power in a given AGN. There is however the exciting prospect that such problems can be tackled with data that can be gathered in the near future.
6. References
Blandford, R.D., & Znajek, R.L., 1977, MNRAS, 179, 433
Blandford, R.D., & Rees, M.J., 1978, Pittsburgh Conf. on BL Lac
Objects, p. 341-347.
Blandford, R.D. 1990, in Saas-Fee Advanced Course 20. Lecture Notes,
Springer-Verlag
Catanese, M., & Weekes, T.C., 1999, PASP, 111, 1193
Catanese, M.& Sambruna, R. M. 2000, ApJ, 534, L39
Celotti, A., Padovani, P., & Ghisellini, G. 1997, MNRAS, 286, 415
Corbett, E. A., et al. 2000, MNRAS, 311, 485
Fossati, G., et al. 1998, MNRAS, 299, 433
Fossati, G., et al. 2000, ApJ, 541, 166
Ghisellini, G., et al. 1998, MNRAS, 301, 451
Ghosh, P., & Abramowicz, M.A. 1997, MNRAS, 292, 887
Haas, M., et al. 1998, ApJ, 503, L109
Impey, C.,1996, AJ, 112, 2667
Kirk, J.G., Rieger, F.M., & Mastichiadis, A., 1998, A&A, 333, 452
Kubo, H., et al. 1998, ApJ, 504, 693
Landau, R., et al. 1986, ApJ, 308, 78
Maraschi, L., et al. 1999, ApJ, 526, L81
Mukherjee, R., et al. 1997, ApJ, 490, 116
Sambruna, R.,M., Maraschi, L., &Urry, C.M., 1996, ApJ, 463, 444
Shakura, N. I. & Sunyaev, R. A. 1973, A&A, 24, 337
Sikora, M., et al. 1997, ApJ, 484, 108
Takahashi, T., et al. 1999, Astroparticle Physics, 11, 177
Tavecchio, F., Maraschi, L., & Ghisellini, G., 1998, ApJ, 509, 608
Tavecchio, F., et al. 2000, ApJ, in press (astro-ph/0006443)