FUSE Observations of Outflowing OVI in the Dwarf Starburst Galaxy NGC 1705
Abstract
We report far-UV spectroscopy of the prototypical dwarf starburst galaxy NGC 1705. These data allow us for the first time to directly probe the coronal-phase ( = few 105 K) gas that may dominate the radiative cooling of the supernova-heated ISM and thereby determine the dynamical evolution of the starburst-driven outflows in dwarf galaxies. We detect a broad (100 km s-1 FWHM) and blueshifted ( = 77 km s-1) 1032 absorption-line arising in the previously-known galactic outflow. The mass and kinetic energy in the outflow we detect is dominated by the warm ( 104 K) photoionized gas which is also seen through its optical line-emission. The kinematics of this warm gas are compatible with a simple model of the adiabatic expansion of a superbubble driven by the collective effect of the kinetic energy supplied by supernovae in the starburst. However, the observed properties of the absorption in NGC 1705 are not consistent with the simple superbubble model, in which the would arise in a conductive interface inside the superbubble’s outer shell. The relative outflow speed of the is too high and the observed column density ( 14.3) is much too large. We argue that the superbubble has begun to blow out of the ISM of NGC 1705. During this blow-out phase the superbubble shell accelerates and fragments. The resulting hydrodynamical interaction as hot outrushing gas flows between the cool shell fragments will create intermediate-temperature coronal gas that can produce the observed absorption. For the observed flow speed of km s-1, the observed column density is just what is expected for gas that has been heated and which then cools radiatively. Assuming that the coronal-phase gas is in rough pressure balance with the warm photoionized gas, we estimate a cooling rate of-order 0.1 per year and 1039 erg s-1 in the coronal gas. The latter represents 10% of the supernova heating rate. Independent of the assumed pressure, the lack of observed redshifted emission from the backside of the outflow leads to upper limits on the cooling rate of 20% of the supernova heating rate. Since the X-ray luminosity of NGC 1705 is negligible, we conclude that radiative-losses are insignificant in the outflow. The outflow should therefore be able to fully blow-out of the ISM of NGC 1705 and vent its metals and kinetic energy. This process has potentially important implications for the evolution of dwarf galaxies and the IGM.
1 Introduction
Local starburst galaxies are excellent local laboratories to study the physics of galaxy building (cf. Heckman 1998). It is now clear that the deposition of mechanical and thermal energy by multiple supernovae in starbursts leads to a global outflow of metal-enriched gas. These outflows are called “superbubbles” during their early dynamical evolution, and “superwinds” after they blow out of the galaxy’s ISM (e.g., Heckman 2000 and references therein). Such flows are expected to play an especially important role in the evolution of dwarf galaxies, whose relatively shallow potential wells make them susceptible to wind-driven loss of gas and newly-created metals (e.g., Dekel & Silk 1986; Martin 1999). Since similar outflows appear to be common in high-redshift galaxies as well (Pettini et al. 1998, 2000; Tenorio-Tagle et al. 1999) they are perhaps the most plausible mechanism by which the mass-metallicity relation in galactic spheroids was established (e.g., Lynden-Bell 1992) and the intergalactic medium was heated and chemically-enriched (e.g., Ponman, Cannon, & Navarro 1999; Gibson, Loewenstein, & Mushotzky 1997).
One of the major uncertainties concerning starburst-driven outflows is the importance of radiative cooling: what fraction of the kinetic energy supplied by supernovae is carried out in the flow rather than being radiated away? While the available X-ray data and models establish that radiative losses from hot gas (K) are not severe (see Strickland & Stevens 2000), up until now there has been no direct observational probe of the coronal-phase gas ( to K) that could dominate the radiative cooling.
The recent launch of the ( - Moos et al. 2000) provides access to the best probe of rapidly-cooling coronal gas in starburst outflows: the OVI1032,1038 doublet. Accordingly, we have obtained spectra of a small sample of the nearest and brightest starbursts. In this paper, we present the first detection of in the galaxy NGC 1705.
NGC 1705 is an ideal test-case for the study of coronal-phase gas. This nearby (D = 6.2 Mpc) dwarf starburst galaxy has the second highest vacuum-ultraviolet flux of any starburst galaxy in the extensive compilation of IUE spectra in Kinney et al. (1993). The detailed investigation by Meurer et al. (1992) established NGC 1705 as a prototypical example of a dwarf starburst undergoing mass-loss. They were able to delineate a kpc-scale fragmented ellipsoidal shell of emission-line gas that was expanding at roughly 50 km s-1 along our line-of-sight. They also showed that the population of supernovae in the young super star cluster (NGC 1705-1) was energetically-sufficient to drive this flow. The expulsive nature of the flow was later confirmed by observations that showed that the ultraviolet interstellar absorption-lines towards NGC 1705-1 were blueshifted by 70 to 80 km s-1 relative to the galaxy systemic velocity (Heckman & Leitherer 1997; Sahu & Blades 1997; Sahu 1998). Hensler et al. (1998) reported the detection of soft X-ray emission, presumably from hot gas inside the expanding emission-line nebula.
2 Observations & Data Reduction
Two observations of NGC 1705 (; ) were obtained on 4-5 February 2000. The central super star cluster NGC 1705-1 was centered in the large (LWRS, ) aperture of the LiF1 (guiding) channel for each observation by the standard guide-star acquisition procedure. The two observations resulted in 13 exposures totaling 21.3 of on-target exposure time. Approximately 95% of the observing time occurred during orbital night, which greatly reduced the amount of terrestrial O I and N I airglow entering the FUSE apertures. Flux was recorded through the LWRS apertures in both long wavelength (LiF, Å) channels and both short wavelength (SiC, Å) channels. The astigmatic heights of the LiF1 spectra near 1030 Å were roughly 1/3 of the aperture width, consistent with the compact photometric structure of NGC 1705. 111 images at 2200Å show that roughly 40% of the light that would be admitted into the LWRS aperture would come from the single brightest star cluster NGC 1705-1, and 70% of the light would come from the region within a radius of 2.8 arcsec of NGC 1705-1 (Meurer et al 1995). A comparison of the HST (1.7 arcsec aperture) and (10 by 20 arcsec aperture) spectra implies that these fractions should not be strongly wavelength dependent. Thus, while the data sample the entire inner region of NGC 1705 (projected size of roughly 900 by 900 pc), the sightlines within about 80 pc of NGC 1705-1 are very strongly weighted. The data are preserved in the archive with observation identifications A0460102 and A0460103.
The raw time-tagged photon event lists for each exposure were processed with the standard calibration software () available at the Johns Hopkins University as of August 2000. The lists were screened for valid data, and corrections for geometric distortions, spectral motions, and Doppler shifts were applied (see Sahnow et al. 2000). The data were not affected by the detector event bursts that plagued many of the early FUSE spectra. The 13 individual calibrated extracted spectra for each channel were cross-correlated, shifted to remove residual velocity offsets due to image motion in the apertures, and combined to a produce composite spectrum for each channel. These composite spectra in the 1000–1070 Å region were then compared, and any remaining velocity offsets were removed by referencing to the LiF1 channel data. The wavelengths were put into the Local Standard of Rest (LSR) reference frame by requiring that the Galactic ISM lines fall at km s-1, the approximate velocity of the Milky Way lines as observed at longer wavelengths with the Space Telescope Imaging Spectrograph (STIS) on the . These new STIS data will be presented in future papers (Sembach et al. 2001; Heckman et al 2001). The data have a wavelength uncertainty of km s-1 (). The spectrum of NGC 1705 is shown in Figure 1.
In this article, we do not combine the data from all four channels because the instrumental resolution and sensitivity changes as a function of wavelength. Therefore, when measuring the strengths of absorption features, we compare the individual measurements (Wλ) for the two channels having the highest sensitivity at the wavelengths of the absorption features of interest (usually LiF1 and LiF2 for Å, or SiC1 and SiC2 for Å). The integrated equivalent widths derived from separate channels generally agree very well. Table 1 contains these measurements for selected Milky Way and NGC 1705 absorption features observed along the sight line. The data have a velocity resolution of km s-1 and S/N ratios of 16, 13, 10, and 9 per resolution element at 1032 Å in the LiF1, LiF2, SiC1, and SiC2 channels, respectively.


3 Results
We confirm the principal conclusion of Sahu & Blades (1997) and Sahu (1998): there are three separate systems of interstellar absorption-lines along the sight-line to NGC 1705 (Table 1; Figure 2). These arise in the Milky Way, the periphery of the high velocity cloud HVC 487, and the interstellar medium of NGC 1705. In the present paper, we will focus our analysis on NGC 1705, but briefly summarize our results on HVC 487.
3.1 HVC 487
As pointed out by Sahu & Blades (1997), HVC 487 is located 2∘ away from the NGC 1705 sight-line. Sahu (1998) proposes that HVC 487 is associated with the Magellanic Stream, so the implied impact parameter would be roughly 2 kpc. The properties of the absorption associated with HVC 487 will be discussed in detail in a future paper which will combine the data with echelle spectra taken with STIS on (Sembach et al. 2001). Here, we note only that HVC 487 is strongly detected in absorption in the 1032, 977, 1036, and Lyman-series lines. Assuming that the 1032 line is optically-thin, the implied column is 2.00.3 1014 cm-2. This is typical of other HVC sight-lines studied with (Sembach et al. 2000). The Lyman series, CIII977, and CII1036 absorption-lines from HVC 487 are at = 27015 km s-1. These are close to the 21cm velocity of HVC 487 of 23214 km s-1 (Sahu 1998). In contrast, the 1032 line is centered at = 32610 km s-1, an offset of 9417 km s-1 from the 21cm velocity. The line is very broad, with an observed FWHM = 10015 km s-1. This breadth is comparable to the sound speed in coronal gas where would be abundant, and is similar to those of other HVCs observed with (Sembach et al. 2000).
3.2 NGC 1705
We expect our data to probe four phases of interstellar gas in NGC 1705: molecular gas, neutral atomic gas, warm gas photoionized by hot stars, and collisionally-heated coronal gas. The neutral atomic gas is traced by species with ionization potentials of creation 1 Ryd, the warm gas by ions with = 1 to 4 Ryd (up to the HeII edge), and the coronal gas by ions with 4 Ryd.
No molecular hydrogen was detected in any of the first three levels (0-2), and the limit on the total column density is 14.6 (corresponding to a molecular hydrogen fraction of - based on the observed HI column given below). Similar results have been reported for the metal-poor dwarf starburst IZw18 (Vidal-Madjar et al. 2000). The intrinsic reddening in NGC 1705 is very small: Heckman et al. (1998) give 0.1. In the particular case of NGC 1705, the low values for and are quite consistent with Galactic sightlines with similarly-low and (Savage et al. 1977).
Lines tracing the other three phases are well-detected (Table 1; Figures 1 and 3). In particular, the 1032 line is independently detected at the 10 level in both the LiF1 and LiF2 detectors (Figure 2). The weaker member of the doublet (1038) is blended with the much stronger Galactic 1039 line and is not convincingly detected.

3.2.1 Kinematics
We begin by considering the kinematic properties of the gas. In what follows, we will adopt an LSR systemic velocity for NGC 1705 of = 622 km s-1, which is derived from the HI21cm rotation curve (Meurer et al. 1998).
The mean radial velocity of the neutral gas lines listed in Table 1 is 59011 km s-1 as determined by fitting Gaussian components to the observed absorption features. This implies a blue-shift of 32 km s-1 relative to , which is significantly larger than the uncertainty 11 km s-1 derived from the standard deviation of the line centroids. In contrast, the coronal gas traced by is significantly more blueshifted: = 54510 km s-1, or = -77 km s-1. The warm photoionized gas appears to have intermediate velocities with the mean line centroid at 56910 km s-1 ( = -53 km s-1)222We exclude the highly saturated and very broad 977 line, which is discussed separately.
Further evidence for differing dynamics between the neutral and coronal gas comes from the line widths (see Figure 3). The weak (unsaturated) lines from the neutral phase have observed lines widths (FWHM) of roughly 70 km s-1, while the 1032 line has a broader structure (FWHM 10010 km s-1). The lines from the photoionized gas are roughly the same width as the line.
The strongly saturated 977 and 1036 lines allow us to probe the low-column density gas at extreme radial velocities. Relative to , the centroid of the line is blueshifted by 9520 km s-1. The blueward edge of the line is blended with the HVC feature, but absorption extends to at least -260 km s-1 with respect to . Relative to , the 1036 line centroid is blueshifted by 4020 km s-1 km s-1 and absorption is present from at least -180 km s-1 (where the line is blended with the HVC feature) to roughly +70 km s-1. The HI21cm maps of NGC 1705 published by Meurer et al (1998) show emission from -94 to +86 km s-1 relative to . The velocity range of the redshifted gas seen in 1036 is thus consistent with the kinematics of the normal neutral (turbulent?) ISM, but an additional component of highly blueshifted (outflowing) neutral gas is also present.
3.2.2 Column Densities and Abundances
We have determined column densities by converting the observed absorption profiles into optical depth profiles and integrating over velocity (see Savage & Sembach 1991). We measured only the weaker (and thus, more-optically-thin) metal lines with equivalent widths 250 mÅ. The results are given in Table 2.
For the lines in the neutral phase, we estimate the following column densities (log): (14.0), (15.6), (14.6), (13.5), and (14.5). Heckman & Leitherer (1997) estimated that = 1.51020 cm-2 column towards NGC 1705-1 based on fitting the red side of the damped profile in the HST data. We have fit the Ly and higher-order Lyman series lines in our spectrum, and find = 21 1020 cm-2 (5 km s-1). We adopt the mean of these two estimates: log = 20.20.2. Since these species above should be the dominant state of their respective element in the neutral gas, we can estimate the following abundances (Anders & Grevesse 1989): [N/H]=-2.2, [O/H]=-1.5, [Si/H]=-1.1, [Ar/H]=-1.3, and [Fe/H]=-1.2. The absolute abundances are uncertain by 0.3 dex. With the exception of nitrogen, the abundances are marginally consistent with the metallicity of [O/H]=-0.9 derived for the nebular emission-line gas (Heckman et al. 1998). This is in agreement with expectations that we see ambient interstellar gas, rather than the much hotter gas that is polluted by recent supernova ejecta.
We confirm Sahu‘s (1998) finding of a low relative abundance, based on the column density. As Sahu points out, the ion can also make a significant contribution to the total column in the phase (see Sofia & Jenkins 1998). We estimate log = 14.7. Unless most of this is associated with the phase, remains selectively underabundant. In fact, most of the observed must be associated with the warm photoionized gas that dominates the total gas column along our line-of-sight (see below). This is implied by the kinematics of the 1084 line, which has a significantly larger blueshift and FWHM than the lines arising in the neutral phase, but agrees with the other lines arisiing in the warm photoionized gas (Table 1; and see above). A low nitrogen abundance is typical of low-metallicity gas in dwarf galaxies, and is a consequence of a partly secondary nucleosynthetic origin for (e.g. van Zee, Haynes, & Salzer 1997). We do not confirm the low relative abundance noted by Sahu & Blades (1997). Finally, we see no evidence for the systematic gas-phase depletion of refractory elements (e.g. compare to ). The neutral gas in the outflow thus appears largely dust-free (e.g., Savage & Sembach 1996), consistent with the lack of detectable reddening in the UV spectrum of NGC 1705 (e.g., Meurer, Heckman, & Calzetti 1999).
The total column density in the warm photoionized gas is more uncertain. The weak 1012 and 1063 lines imply column densities log = 15.0 and log = 14.4. The ion can also be adundant in photoionized gas. While the HST spectrum covers a somewhat different sight-line (the 1.71.7 arcsec Large Science Aperture was centered on NGC 1705-1), the column density log = 15.0 from Sahu & Blades (1997) is a useful additional constraint. The total implied column of ionized is log = 15.3. For an assumed value [S/H]=-0.9 (based on nebular emission-line metallicity), the total column in the photoionized gas is log = 20.9, or almost an order-of-magnitude greater than the column.
The observed 1032 line yields an column density log = 14.3. Deriving the total column density of the coronal phase gas requires uncertain assumptions. For gas in collisional ionization equilibrium, reaches its peak relative abundance (20% of the total abundance) at 3105 K (Sutherland & Dopita 1993). If we assume that [O/H]=-0.9 in the coronal phase gas (similar to the value in the optical emission-line gas), the implied minimum total column in the coronal gas is then log = 19.0. While uncertain, we note that this is a substantially smaller column than seen in the cooler gas.
3.3 Limits on OVI Emission
In addition to the blueshifted absorption-line produced by coronal gas on the frontside of the outflow, redshifted emission from the backside of the outflow must also be present. We do not detect such emission, but can set an interesting upper limit to its intensity. Combining our LiF1 and LiF2 spectra, we obtain a 3 upper limit on the flux of the redshifted 1032 emission-line of 10-15 erg cm-2 s-1. This limit assumes that the line would have a breadth similar to the blueshifted absorption-line ( 100 km s-1).
We first correct this flux for forground dust extinction. The Galactic column towards NGC 1705 is 1.31020 cm-2, based on both the damped profile (Sahu 1998) and radio 21cm observations (reported in Hensler et al. 1998). Adopting the standard extinction curve of Mathis (1990), the implied extinction at 1032Å is 0.3 magnitudes. The data discussed in section 3.2.2 imply that there is a negligible amount of dust extinction intrinsic to NGC 1705.
In the discussion below, we will be interested in the total luminosity of NGC 1705. To derive a global upper limit, we make a simple aperture correction to our observed limit. The portion of the backside of the NGC 1705 outflow included in our aperture represents about 15% of the total surface area of the outflow (front and back sides), as mapped by Meurer et al. (1992). Thus, the global extinction-corrected 1032 flux from NGC 1705 is 6.510-14 erg cm-2 s-1, and the corresponding luminosity is 31038 erg s-1.
4 Discussion
4.1 A Simple Model
The simplest physical model that can be compared to our data is an adiabatic expanding superbubble whose expansion is driven by the energy supplied by multiple supernovae (Weaver et al. 1977; Koo & McKee 1992). This is a natural model to use, since it appears to be a good first-order description of the properties of the emission line nebula in NGC 1705 (Meurer et al. 1992; Marlowe et al. 1995).
In this simple model, there are six concentric zones. From inside-out these are: An innermost region inside which energy is injected by supernovae (the starburst). A region of supersonic flow fed by the hot gas created in zone 1. A region of hot gas (material from zone that has passed through an internal shock). A conductive interface of intermediate-temperature gas created as the hot gas in zone heats the relatively cool, dense gas in zone . A thin dense shell of ambient gas that has been swept-up (shocked and then radiatively cooled) as the “piston” of hot gas in zone expands into the ISM. Depending on the available flux of ionizing radiation from the starburst, this shell may be partially or fully photoionized. The undisturbed ambient ISM.
The dynamical evolution of a superbubble in the type of plane-parallel ISM appropriate to a starburst has been extensively discussed (see MacLow & Ferrara 1999 and references therein). Once the radius of the superbubble is several times the vertical scale-height of the ISM, its expansion will accelerate and Rayleigh-Taylor instabilities will cause the outer shell (zone ) to fragment. This will allow the hot gas from the interior to escape from the ruptured superbubble and flow out into the galactic halo. This “blow-out” or “ break-out” stage marks the transition from superbubble to superwind.
4.2 Some Simple Inferences
Before considering the superbubble model in more detail, it is worthwhile to make some rough estimates of the mass and kinetic energy in the gas and compare these to expectations. To convert the observed column densities and outflow velocities into masses and kinetic energy, we will assume the following idealized model for the NGC 1705 outflow. Meurer et al. (1992) show that the morphology and kinematics of the emission-line nebula can be described as the expansion of a hollow prolate ellipsoid with a semi-major axis of 1.5 kpc and semi-minor axes of 0.5 kpc. Multiplying the surface area of this ellipsoid by our estimated column densities (see above) implies total gas masses of 5107, 1107, and 6105 respectively in the warm photoionized gas, the neutral gas, and the coronal gas. The outflow speeds then yield corresponding kinetic energies of 1.61054, 11053, and 31052 ergs.
The supernovae in the NGC 1705 starburst will supply kinetic energy at a mean rate of roughly 21040 erg s-1 (Marlowe, Meurer, & Heckman 1999). The dynamical age of the expanding emission-line nebula is 10 to 15 Myr (Marlowe et al. 1995; Meurer et al. 1992), so the total amount of kinetic energy supplied by the starburst during this time is 1055 ergs. In the standard adiabatic superbubble model, the kinetic energy of the swept-up shell (zone ) will be about 19% of the total injected energy (e.g. MacLow & McCray 1988). Given the nature of our estimates, the rough agreement between the observed and available/predicted kinetic energies is gratifying.
The amount of mass returned directly by supernovae and stellar winds during the last 10-15 Myr will only be 10 (Leitherer & Heckman 1995). This is tiny compared to shell’s mass (see above), consistent with the basic superbubble model in which the shell is swept-up ambient ISM. In this case, the total gas column density seen by (1021 cm-2) can be no larger than the total column density of the ISM prior to the expansion of the superbubble. The HI21cm maps in Meurer et al. (1998) show that the mean column density in the inner part of NGC 1705 is about 21021 cm-2, consistent with this requirement.
The similarity between the total gas column of outflowing gas measured by and the typical HI column in NGC 1705 implies that the dimensions of the superbubble must be at least comparable to the characteristic thickness of the ISM. This suggests that the superbubble is early in the blow-out stage of it dynamical evolution. Such an inference is also consistent with the patchy, filamentary morphology of the superbubble’s H emission (Meurer et al. 1992; Marlowe et al. 1995), which suggests that the superbubble shell has begun to accelerate and fragment (see above).
The absorbing column in NGC 1705 (log = 20.20.2) is roughly an order-of-magnitude smaller than the column observed in emission at 21cm in the same region (with the 30 arcsec beam - Meurer et al. 1998). This implies that roughly 90% of the seen in the radio map lies behind the dominant source of far-UV light (the region around the super star cluster NGC 1705-1). That is, we infer that the superbubble is not symmetrically located within the HI disk of NGC 1705, but must be on the near side. Thus, the blow-out is apparently one-sided at present (cf. MacLow, McCray, & Norman 1989).
4.3 The Warm Photoionized Gas
The column density of gas along our line-of-sight is dominated by the warm ionized gas. This implies that the shell of swept-up material (zone in the superbubble) has been mostly photoionized by Lyman continuum radiation from the starburst. It is natural to identify the gas seen in absorption in the data with the emission-line nebula studied by Marlowe et al. (1995) and Meurer et al. (1992).
The kinematics are consistent with this identification. Recall that the sight-line is heavily weighted towards material within about 3 arcsec of the bright super star cluster NGC 1705-1. The echelle spectra of this region analyzed by Marlowe et al. (1995) and Meurer et al. (1992) show double-peaked H emission-line profiles, with the blueshifted (redshifted) peak corresponding to emission from the front (back) side of the expanding superbubble. The measured LSR radial velocity of the blueshifted component is 56020 km s-1 along the different position angles covered by their combined data sets. Within the uncertainties, this agrees with the mean velocity for the corresponding absorption-lines (56910 km s-1).
Since we now have a mass for the warm photoionized gas (§ 4.2), its H luminosity (Marlowe et al. 1995) can be used to directly determine that the mean electron density in this material is 1 cm-3. We emphasize that this makes no assumptions about the volume filling-factor of the gas. Taking 104 K (typical of photoionized gas), the corresponding thermal pressure is P/k 2104 K cm-3. Can the starburst in NGC 1705 keep this gas photoionized? Taking 1 cm-3, the measured radius of the superbubble ( 500 pc), and the Lyman continuum luminosity of NGC 1705 ( = 1052 s-1), the Stromgren thickness of the photoionized supershell will be 1021 cm and the column density of the ionized layer is then 1021 cm-2. This is in good agreement with the column density of photoionized gas we infer from the data.
We can compare the basic dynamical properties of the warm ionized gas in NGC 1705 to the predictions of the superbubble model. In convenient units, the radius and expansion speed of the superbubble are given by:
| (1) |
| (2) |
for an adiabatic superbubble inflated by a kinetic energy injection rate (in units of 1040 erg s-1) into a uniform medium with nucleon density for a time (in units of 107 years).
The age of the dominant super star cluster (NGC 1705-1) is well-constrained to be about 107 years (de Mello, Leitherer, & Heckman 2000). This agrees with the dynamical age () of the superbubble (Marlowe et al. 1995; Meurer et al. 1992). The estimated kinetic energy injection rate due to supernovae is = 2 (Marlowe, Meurer, & Heckman 1999). Finally, the HI column in the center of NGC 1705 implies a mean nucleon density of 1 cm-3 for an ISM thickness of 1 kpc. Our estimate of the swept-up mass of gas in the supershell (5107 ) divided by volume enclosed by the supershell ( cm3) likewise implies 1 cm-3. Equations 1) and 2) above then predict a radius of 0.8 kpc and an expansion velocity of 50 km s-1 for the supershell. Given the overly-simplistic model (spherical symmetry, constant density), we regard the agreement with the data as satisfactory.
4.4 The Neutral Gas
The neutral gas probed by is significantly less blueshifted than the ionized gas, and must therefore have a different origin. For this gas to remain neutral, it must be optically-thick to the Lyman continuum radiation from the starburst. This condition implies that a slab of gas with a column density log = 20.2 located inside the superbubble (and thus at a distance 500 pc from an ionizing source with a Lyman continuum luminosity of s-1) must have a density 8 cm-3. Recall that the mean ISM density in NGC 1705 is roughly 1 cm-3. Moreover, log = 20.2 and 8 cm-3 implies that the neutral absorbers must be very small (smaller than a few pc).
Thus, only relatively small dense clouds would be neutral. On-average, the clouds are outflowing, so most can not be in any undisturbed ambient medium in front of the superbubble’s outer shell. We therefore identify the outflowing material with clouds in the superbubble’s interior. These were presumably clouds in the ISM of NGC 1705 that were overtaken and engulfed as the superbubble propagated through the more tenuous inter-cloud medium. This would be a natural consequence of a multi-phase ISM (e.g., White & Long 1991).
The dynamical model here is one of dense clouds exposed to the outflowing hot gas in zones and of the superbubble. We would expect to see absorbing material that is injected from quiescent material at or near , and which is then accelerated up to some terminal velocity as it is transported outward by the hot outflow. Following Heckman et al. (2000), an interstellar cloud with column density , originally located a distance from a starburst, will be accelerated by a spherically-symmetric outflow that carries an outward momentum flux up to a terminal velocity given by:
| (3) |
We have chosen values for these parameters that are appropriate to the neutral gas in NGC 1705. The predicted velocity range of absorption relative to would be 0 to -100 km s-1. This agrees tolerably well with the velocities of the blueshifted neutral gas observed in our data.
4.5 The Coronal Gas
The detection of the interstellar absorption-line (the first in a starburst galaxy) is the most important result in this paper. We will organize our discussion of the coronal gas in NGC 1705 as follows.
We begin by making some simple inferences about the basic physical properties of the gas that are independent of any specific model for the origin of the gas (§ 4.5.1). In particular, in § 4.5.2 we point out that - independent of the detailed thermal/dynamical history of the gas - the observed column density and line width imply that we are observing gas that has been heated to and which then cools radiatively. These model-independent results can then be used to constrain the radiative cooling rate from the coronal gas and show that it is small compared to the supernova heating rate.
We then turn our attention to specific models for the . We will not exhaustively consider all the possible alternative models (for example, conduction fronts associated with either the supershell fragments or the HI clouds discussed above). Instead we will describe the shortcomings of the standard superbubble model (§ 4.5.3), and then consider what we regard as an especially plausible alternative model in which the arises in a hydrodynamical interaction between hot outrushing gas and the dense, cooler fragments of the superbubble shell during the “blow-out” phase. This idea is considered analytically in §4.5.4 in the context of models of turbulent mixing layers, and then using numerical hydrodynamical models in §4.5.5.
4.5.1 Basic Physical Properties
The combination of a detection of blueshifted 1032 in absorption and an upper limit to corresponding redshifted emission allows us to place an upper bound on the density and pressure in the coronal gas (since we know the column density, and have an upper limit to the emission-measure). This calculation only assumes reasonable symmetry between the front and back sides of the outflow averaged over the kpc-scale projected aperture.
The ion is abundant only over a rather narrow temperature range (e.g. Sutherland & Dopita 1993), so we will assume 3105 K. The upper limit to the extinction-corrected 1032 flux in the aperture corresponds to an upper limit to the intensity of 104 photons cm-2 s-1 ster-1. Following Shull & Slavin (1994), our observed column density then leads to an upper limit to the electron density in the coronal gas of 0.1 cm-3. The corresponding upper limit to the pressure is 104 K cm-3.
We have estimated a pressure in the warm photoionized gas of 2104 K cm-3. The pressure in the coronal-phase gas probed by the ion should be the same, since zones through in the adiabatic superbubble model are isobaric (MacLow & McCray 1988). We note that the isobaric condition could be invalidated by the presence of a dynamically-significant magnetic field (in which case the thermal pressure in the coronal gas should be higher than in the denser photoionized material). However, our model-independent upper bound of 104 K cm-3 in the coronal gas is only a factor of three higher than the pressure implied by an assumption of isobaric conditions. For 3105 K, our estimated pressure then implies that the characteristic density in the coronal gas is 310-2 cm-3. For a metal abundance of 1/8 Solar in NGC 1705 (Heckman et al. 1998) the implied radiative cooling time from 3105 K is = 1106 years (interpolating between the collisional-ionization-equilibrium models for different metallicities in Sutherland & Dopita 1993). The assumption of collisional-ionization-equilibrium is probably reasonable for , since the relevant recombination times at our assumed density and temperature (Nahar 1999) are roughly an order-of-magnitude less than the radiative cooling time.
The estimated column density in the coronal gas in NGC 1705 is 1019 cm-2, so the above density implies a characteristic thickness for the absorbing material of 100 pc. If this path length is contributed by total clouds, the sound crossing time of a cloud is years. Thus, the ratio of sound-crossing and radiative cooling times in a cloud is and the assumption that the coronal gas is in rough pressure-balance with its surroundings is therefore plausible.
We have estimated that the total mass of coronal-phase gas is . The above cooling time then implies a cooling rate of 0.6 per year. This can be compared to the average rate at which mass has been swept up by the superbubble over its lifetime: years 5 per year. The implied cooling luminosity is erg s-1. This is about 5% of the estimated rate at which the starburst supplies mechanical energy.
Thus, radiative cooling associated with the coronal gas should not dominate the dynamical evolution of the outflow. We note that radiative cooling from the hotter gas detected in soft X-rays ( erg s-1 - Hensler et al. 1998) is significantly smaller than our estimate of , and is therefore negligible.
4.5.2 The Origin of the Observed Column Density
Edgar & Chevalier (1986) have computed the expected column densities of various ions for the generic situation in which gas is heated to a temperature K and then cools radiatively. The total column density of cooling gas is just given by , where is the radiative cooling time and is the rate of cooling per unit area. For a flow speed , mass conservation in the cooling flow implies . Thus, the cooling column can also be written at .
It is important to note that is independent of density, since . Moreover, at coronal temperatures the cooling is dominated by metals, so (where is the metallicity). Since , the characteristic column density in radiatively cooling coronal gas is essentially independent of density and metallicity and depends only on the value for . Edgar & Chevalier (1986) calculate that cm-2 (/100 km/s). Calculations of production in high-speed radiative shocks give similar values (Dopita & Sutherland 1996). This fiducial column density agrees well with our measured values for and in NGC 1705.
This good agreement has two immediate implications. First, independent of the detailed dynamical and thermodynamical history of the , this gas it is almost certainly the result of the radiative cooling of initially hotter gas. Second, we can now estimate the implied cooling rate.
Using the Edgar & Chevalier (1986) models, our observed value = 14.3 implies that = 5 106 cm s-1. In their models the gas cools from 106 K (and we note that significantly higher values for in NGC 1705 are excluded by its low X-ray luminosity). Since we estimate = 2104 K cm-3, it follows that = 0.01 cm-3 at K and thus = 5 104 cm-2 s-1. To calculate the implied rate at which gas is cooling (), we take a surface area cm2 for the NGC 1705 superbubble (see above), and find that per year. As the gas cools from 106 K its cooling luminosity is erg s-1. This is about 5% of the estimated rate at which the starburst supplies mechanical energy, which agrees well with the more naive estimate in § 4.5.1 above.
The above estimates of the cooling rate depend upon our assumed pressure. However, the upper limit to the luminosity of 1032 emission-line (§ 3.2.3) yields a pressure-independent upper limit to the cooling rates of 0.3 per year and 41039 erg s-1 (Edgar & Chevalier 1986). These limits are consistent with the above estimates.
4.5.3 The Failure of the Simple Superbubble Model
In the simple superbubble model there are two plausible origins for the coronal gas. First, if the speed of outer shock driven into the ambient ISM is high enough, ions will be abundant behind this shock (in zone ). This does not appear to be feasible in NGC 1705, since the minimum required shock speed (post-shock temperature) is 150 km s-1 (3 K) - see Shull & McKee (1979) and Dopita & Sutherland (1996). This is significantly higher than the expansion speed measured in for the shell in NGC 1705: 53 km s-1, corresponding to a post-shock temperature of only 40,000 K.
Second, thermal conduction will transfer heat from zone to zone and create coronal-phase gas at the interface (zone ). Weaver et al. (1977) predict an column density in this material of
| (4) |
where is the oxygen abundance relative to Solar. For = 1/8, the predicted value for is a factor of 15 smaller than we measure. In this case, is smaller than the value for radiatively cooled gas (§ 4.5.2) and has a direct dependence on the metallicity. This is because cooling in the conductively heated zone is dominated by adiabatic expansion losses (Weaver et al. 1977).
The relative velocity of absorption in NGC 1705 is also inconsistent with the simple superbubble model, which predicts that the outflow velocity in this material (zone ) will be substantially less than the outflow speed of the superbubble shell (zone ). Our data instead show that the outflow speed is probably even larger than that of the shell (7710 vs. 5310 km s-1 - see above).
We conclude that the simple superbubble model does not account for the observed properties of the absorption-line in NGC 1705.
4.5.4 Hydrodynamical Heating During Blow-Out
We have argued in § 4.5.2 that the arises in a flow of gas that has been heated to an initial temperature of and which is then cooling radiatively. As discussed in § 4.5.3, this heating/cooling process does not correspond to the outer shock in the superbubble (zone 5) because the observed expansion velocity of the superbubble is too slow to produce behind this shock. In this section, we therefore consider a plausible alternative model.
We have argued above that that the superbubble in NGC 1705 is in the process of breaking out of the ISM of NGC 1705. During this phase, the expansion speed of the superbubble shell accelerates and Rayleigh-Taylor instabilities will cause the shell (zone ) to fragment. This allows the hot X-ray emitting gas in zone to push its way out through the fragmented shell, and Kelvin-Helmholtz instabilities are believed to lead to the turbulent mixing of this hot outrushing gas with the cooler shell fragments (e.g. MacLow, McCray, & Norman 1989). Slavin, Shull, & Begelman (1993 hereafter SSB) have investigated the emission and absorption-lines produced by the intermediate-temperature (coronal phase) gas in these “turbulent mixing layers” (TMLs).
We emphasize that the kinematics of the absorbers in NGC 1705 are consistent with TMLs. The blueshift of the relative to the shell material is expected as the hot gas rushes out through “cracks” in the shell. The magnitude of this blueshift follows from SSB: the velocity of the intermediate temperature gas in the TML relative to the cool gas from which it is created is given by , where is the relative flow speed between the gas at and the outrushing hot gas at . For the photoionized shell fragments that dominate the mass in NGC 1705 K. Based on X-ray spectroscopy of dwarf starburst galaxies (della Ceca et al. 1996,1997; Hensler et al. 1998), few106 to 107 K. As this hot gas flows past the shell fragments, its maximum relative velocity will be roughly its sound speed (i.e. 500 km s-1). Thus, for 10-3, 16 km s-1 for = 500 km s-1. This can be compared with NGC 1705 where the absorption line is blueshifted by 2410 km s-1 relative to the photoionized shell material.
As pointed out by SSB, the ionic column density per TML is independent of the pressure in the gas, but is directly proportional to the relative velocity of the cool and hot gas (). Also the column will be appreciable only if the maximum temperature of the TML exceeds K. Their models only extend up to = 100 km s-1 and = 5.5, and these predict columns that are of-order 1012 cm-2 per TML. These values could be adjusted upward in TMLs with larger values for and . In terms of the arguments in § 4.5.2, the low columns in the TML models are partly attributable to the small relevant flow velocity in the TML: 10 km s-1. It appears that of-order 102 TMLs per line-of-sight are needed in NGC 1705 (we see a ‘sea” of shell fragments, each with its own TML). Proportionately fewer TMLs would be needed for larger flow velocities.
4.6 Insights from Numerical Hydrodynamics
As an initial attempt to investigate qualitatively the dynamics of gas in the complex transitional stage between superbubble and superwind, we have performed several 2-dimensional hydrodynamical simulations of a superbubble blowing out of a dwarf galaxy. We calculate the column densities and velocity structure of simulated lines of sight through these models, in particular the relative velocities of the warm and coronal phases that the observations of NGC 1705 show can not be explained by the classic superbubble model.
The simulations were performed using the hydrodynamical code described in Strickland & Stevens (2000), with the initial conditions altered to roughly correspond to NGC 1705. These simulations were performed in cylindrical coordinates, assuming rotational symmetry around the -axis (the minor axis of the galaxy). The hydrodynamical grid covers a region 2.5 kpc in radius by 2.5 kpc high along the -axis with 500 by 500 equally sized cells.
The initial ISM was set up in rotating hydrostatic equilibrium. We use a King model for the gravitational potential, producing a rotational velocity at kpc of km s-1. The ambient gas was given a temperature of K, to approximate turbulent pressure support of the ISM, based on the km s-1 velocity dispersion of the HI gas. The resulting initial ISM density distribution has a peak number density (in the nucleus) of cm-3, a total column density through the galaxy along the minor axis of cm-2, a vertical scale height of 0.2 kpc, and a total mass of (within kpc). These properties are all crudely similar to those observed in NGC 1705 (Meurer et al. 1998).
We modeled the return of mass and mechanical energy into the ISM from starburst event as a single instantaneous burst of star-formation, using the low metallicity models () of Leitherer & Heckman (1995). Appropriate amounts of mass and thermal energy were added at each computational time step to those cells within our assumed starburst region, a cylindrical region pc in radius and pc thick vertically.
Our fiducial model has a time-average mechanical luminosity of erg s-1, somewhat weaker than the observed starburst NGC 1705, but chosen to give blow-out at Myr (approximately the observed dynamical age of the superbubble in NGC 1705). At blow-out the radius of superbubble is pc in the plane of the galaxy, and about twice as large along the minor axis.
We assume an ISM metal abundance of 1/10 Solar for the purposes of calculating radiative cooling and column densities. We also performed other simulations to crudely explore parameter space: First, a simulation with a more powerful starburst ( erg s-1), which blows out earlier at Myr but otherwise is very similar to the fiducial model in other properties. Second, a model using Solar abundance to investigate the scaling of column density with metal abundance. Third, a higher resolution model with twice the resolution in every dimension, to investigate the dependence of calculated properties on numerical resolution.
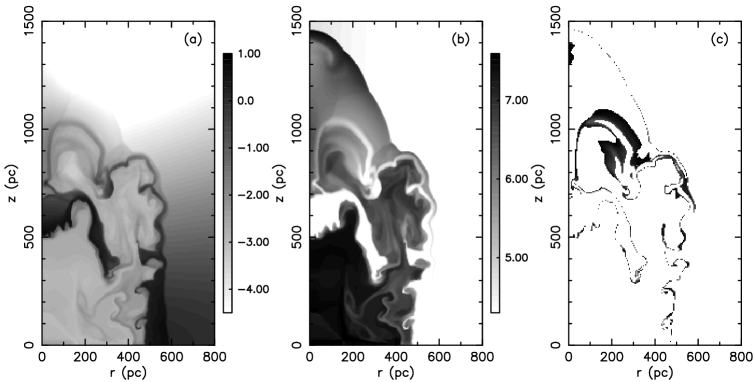
An example of the model is shown in Figure 4, which plots the density and temperature of the gas in our fiducial low-metallicity model at t = 12.5 Myr. The absorption seem in these simulations arises primarily in material at the interfaces between cool dense gas, e.g. in the shell of the superbubble or shell fragments after blow-out, and the hot ( K) gas filling the bubble volume (see Figure 4). In almost all cases these interfaces are numerically unresolved.

We calculate the column density as a function of line-of-sight velocity profiles in each model at three different epochs (pre-, during, and post- blow-out, typically at and Myr respectively), for four different lines of sight from the nuclear starburst (assuming galaxy inclination angles of & ), and for two different ionic species that probe different observed phases in superwinds (warm gas: ; coronal gas: ). Fractional ion abundances as a function of temperature were taken from Sutherland & Dopita (1993), which assume collisional ionization equilibrium. This a reasonable assumption in the case of (see above). It is also a reasonable mock-up of (in reality, photoionization by stars in NGC 1705 keeps the gas containing near 104, close to the temperature floor of 1.6 104 K in the simulations).
Much of the UV light in NGC 1705 comes from the compact central star cluster, but a significant fraction comes from a more diffusely spread component (Meurer et al 1995). The width of FUSE aperture used corresponds to a projected width of pc at the distance of NGC 1705, so the observed spectrum is a sum over many slightly different lines of sight. To investigate the effect of this on the simulated absorption line profiles we explored two cases, which should bracket the real situation. In the first case we assumed all the light comes from a single point-like source at the center of the galaxy, and in the second case that the light comes from uniform surface brightness disk of radius pc. We found very little difference in the simulated absorption line profiles between the two methods, and so quote only results using the point-like light source.
For any particular model, the column densities and kinematics of the gas vary strongly between different sight lines, due to the structural complexity that arises in 2-D simulations (see Suchkov et al. 1994, Strickland & Stevens 2000). The total column densities (in either or ) do not change systematically with time in these simulations. We find that the mean and variance in total column density is the same before, during and after blow-out, considering all 12 simulated lines of sight at each specific epoch.
As shown in Figure 5, we find column densities in the range in the low metallicity models (), and in the Solar metallicity model. Only about 10% of the lines-of-sight in the low metallicity models have columns comparable to the observed value in NGC 1705. One reason for the failure of these simulations to reproduce the observed OVI column densities may be that there is insufficient numerical resolution to resolve the cooling zones between hot and cool gas, where the OVI-absorbing gas exists. Evidence to support this idea comes from comparing the predicted column densities in the fiducial model with those in the high resolution model. Although the predicted columns for low ionisation species always agree to within a factor 2, the predicted OVI column densities agree to within a factor 2 in only 50% of the sight lines, with the remaining sight lines differing by a factor of up to 30. The lack of thermal conduction in these models may also be partially responsible for the low OVI columns, although the arguments presented in § 4.5.3 suggest thermal conduction alone can not produce the observed OVI columns. Our simulations do show that the column density of lower ionization material is considerably higher than that of coronal material, and that this phase contains most of the mass in the outflow (consistent with our observations).
The column-weighted mean velocities for the coronal gas along the different sight-lines generally lie in the range to km s-1, although the full range covers to km s-1 (Figure 5). This gas is typically more blue shifted, and has a wider range of outflow velocities, than the cooler gas in our simulations. For example, the typical velocity range for is to km s-1 and the full range seen only covers to km s-1. The velocity range covered appears very similar in both low and Solar metallicity models, so it appears that the kinematics of the gas in these simulations is independent of the metal abundance. For , the mean outflow velocity (and range of velocities), does appear to increase with time, moving from pre-blow-out through to post-blow-out. This is not the case for lower ionization species, e.g. the distribution of mean velocity for is very similar at all three epochs.
In summary, while the numerical models underpredict the columns, they can explain one aspect of the observed data on NGC 1705. The mean outflow velocity of high-ionization gas probed by is as high as, or higher than, that of low-ionization gas. This is in contrast with the standard superbubble model in which the outflow speed in the coronal gas (zone ) is less than that of the superbubble shell. This result supports the idea that blow-out is responsible for the kinematics of the coronal phase in NGC 1705.
5 Implications
As summarized in § 1, probably the greatest uncertainty in assessing the impact of starburst-driven outflows on the evolution of dwarf galaxies is the importance of radiative cooling (which will directly determine the outflow’s dynamical evolution). In the absence of severe radiative cooling, both analytic arguments and hydrodynamical simulations imply that outflows like the one in NGC 1705 will easily blow-out of their galaxy’s ISM (e.g., MacLow & McCray 1988; Marlowe et al. 1995; Martin 1998,1999; MacLow & Ferrara 1999; Strickland & Stevens 2000). The hot gas that blows out of the superbubble will then be able to heat and chemically enrich the inter-galactic medium (e.g., Ponman et al. 1999; Tozzi, Scharf, & Norman 2000) and/or an extended gaseous halo surrounding the dwarf galaxy (Silich & Tenorio-Tagle 1998).
We will not repeat these arguments here, but simply note that within the context of the standard McKee & Ostriker (1977) formalism, the lack of radiative cooling would be a result of the exceedingly high supernova rate per unit volume, which leads to a porosity near unity in the ISM (i.e., the ISM within which the supernovae detonate is filled almost entirely with hot, diffuse gas). This is especially pertinent to NGC 1705, in which nearly half of the supernovae will detonate inside the pc-scale super-star-cluster NGC 1705-1.
Existing X-ray data establish that radiative cooling from hot (K) gas is energetically insignificant in NGC 1705 (Hensler et al. 1998) and other starburst galaxies (cf. Heckman 2000 and references therein). The new data from are very instructive, since they directly probe for the coronal-phase ( K) gas near the peak of the cooling curve where hitherto-unobserved radiative cooling might be severe. As we showed in § 4.5.2 above, the observed column density ( cm-2) and flow speed ( km s-1) implies that we are seeing gas in the outflow that has been heated to K and then radiatively cooled. We have estimated that the implied rate of radiative cooling is only 6% of the rate of supernova heating (§ 4.5.2). Thus, there is no place left to hide the radiation necessary to quench the supernova-driven outflow in NGC 1705.
What then is the fate of the outflowing gas? For an isothermal gravitational potential that extends to a maximum radius , and has a virial velocity , the escape velocity at a radius is given by:
| (5) |
The rotation curve for NGC 1705 implies = 62 km s-1 (Meurer et al. 1998), and the rotation curve remains relatively flat out to the last measured point at = 7 kpc. Thus, the minimum escape velocity at the present location of the superbubble wall ( 0.5 kpc) will be roughly 170 km s-1. This is significantly higher than the velocities of most of the outflowing gas that we observe in-absorption in NGC 1705. Thus, there is no direct evidence that most of this material will escape NGC 1705. Maps of the HI in NGC 1705 (Meurer et al. 1998) show that the large-scale ISM in NGC 1705 will not be strongly affected by the outflow (which will only puncture a few-kpc-scale hole in the central region of the HI disk).
On the other hand, the bulk of kinetic energy and most of the newly-created metals will reside in the hotter gas that is driving the superbubble’s expansion. The temperature of this gas will be K (della Ceca et al. 1996,1997; Hensler et al. 1998) . We have argued that we are witnessing the blow-out phase in NGC 1705 in which this gas is vented through the fragmented superbubble wall. Following blow-out, in the absence of significant radiative cooling this hot gas will feed a galactic wind with a terminal velocity of at least 300 km s-1 (Chevalier & Clegg 1985). This is comfortably above for any plausible value for . Once the hot gas vents out of the ruptured superbubble, there is no known external medium to impede the resulting high-speed wind.
We conclude that NGC 1705 can eject most of the newly-created metals and kinetic energy returned by the central starburst over the past 107 years. If typical of dwarf starbursts, this process could help create the low metal abundances in dwarf galaxies (e.g., Dekel & Silk 1986; Lyden-Bell 1992) and contribute to the heating and chemical enrichment of the intergalactic medium (Ponman et al. 1999; Gibson et al. 1997; Ellison et al. 2000).
6 Conclusions
We have presented new far-UV spectroscopy of the prototypical dwarf starburst galaxy NGC 1705. Previous optical and UV spectroscopy has established that the starburst in this galaxy is driving a large-scale outflow (Meurer et al. 1992; Marlowe et al. 1995). The data are especially important because they probe the coronal-phase ( 105 to 106 K) gas that may dominate the radiative cooling of the outflow, and thereby largely determine its dynamical evolution. The high quality of the data (spectral resolution of 30 km s-1 and a 16) gives us important new insight into all the phases in the ISM of this galaxy.
Firstly, we do not detect any , with an upper limit of 14.6. This is similar to the results obtained by Vidal-Madjar et al. (2000) for the dwarf starburst IZw18. In the specific case of NGC 1705 the low abundance is consistent with Galactic sight-lines with similarly low (Savage et al. 1977).
We do detect absorption from three other phases of the ISM: neutral gas, warm photoionized gas, and coronal-phase gas (probed with the 1032 line). The total column densities (cm-2) in the three phases are = 20.2, 20.9, and 19.0 respectively. The first is directly measured from Lyman series, while the latter two are estimated from the measured ionic columns assuming a metal abundance of 12% solar (as measured in the optical emission-line gas).
All the interstellar absorption-lines associated with NGC 1705 are broad ( 102 km s-1) and blueshifted. Thus, gas is flowing out of NGC 1705 with = -32, -53, and -77 km s-1 for the neutral, photoionized, and coronal gas respectively.
The mass and kinetic energy in the outflowing gas probed by is dominated by the warm photoionized gas, which is also seen via its optical line-emission. The size, morphology, outflow speed, mass, kinetic energy, and dynamical age of this structure are all consistent with a simple model of an adiabatic superbubble whose expansion is driven by a piston of hot gas created by the cumulative effect of the supernovae in the starburst (e.g., Weaver et al. 1977).
In contrast, we have shown that the neutral gas must reside in relatively small dense clumps in order to be optically-thick in the Lyman continuum. We attribute the outflowing material to clouds in the ISM that have been overtaken by the superbubble and accelerated by the outflowing hot gas.
The properties of the coronal gas probed with 1032 are inconsistent with the predictions of the simple superbubble model. The observed expansion speed of the superbubble (5310 km s-1) is too small to produce behind its shock-front. The blueshift of the line is larger than that of superbubble shell (while the model predict that it should be substantially smaller). Finally, the observed column ( = 14.3) is a factor of 15 too large compared to the superbubble model (in which such gas arises in a conductively-heated and adiabatically-cooled interface between hot gas and the cool outer superbubble shell).
We therefore proposed the following origin for the absorber, and have investigated its plausibility via numerical hydrodynamical models. The morphology and relative size-scale of the superbubble implies that it has begun to “break out” or “blow out” of the ISM in the disk of this galaxy. During the blow-out phase, the superbubble shell will accelerate and then fragment (e.g., MacLow & McCray 1988). As it fragments, the piston of hot gas inside the superbubble will flow out through the “cracks”, and the resulting hydrodynamical interaction between this outrushing gas and the shell fragments will create intermediate-temperature coronal gas that can produce the observed absorption (e.g., Slavin et al. 1993). This process accounts nicely for the observed kinematics of the absorption. We also emphasized that for the observed flow speed of km s-1, the observed column density is just what is expected for gas that has been collisionally-ionized and then radiatively-cooled, independent of its density or metallicity and independent of any specific hydrodynamical model (Edgar & Chevalier 1986).
We have argued that the coronal gas should be in rough pressure-balance with the warm photoionized gas (whose pressure we determined to be K cm-3). This allowed us to estimate cooling rates of 0.07 per year and 1039 erg s-1 in the coronal gas, based on the absorption-line. Independent of the gas pressure, the lack of redshifted emission from the backside of the outflow implies upper limits to the cooling rates of 0.3 per year and erg s-1. The rate of radiative cooling due to hotter ( K) gas is negligible in comparison (Hensler et al. 1998). Since the rate of supernova-heating in NGC 1705 is erg s-1 (Marlowe et al. 1999), we have argued that radiative cooling is not dynamically important in the NGC 1705 outflow.
In the absence of significant radiative cooling, the superbubble in NGC 1705 should be able to blow out of the ISM. Based on the relatively low outflow velocities, it is unlikely that the absorption-line gas we observe with will escape from the galaxy. Likewise, the bulk of the global ISM () in NGC 1705 will be retained (cf. De Young & Heckman 1994; MacLow & Ferrara 1999). However, we have argued that the hotter gas that drives the outflow (and which is now being vented out of the ruptured superbubble) can escape and thereby carry away most of the kinetic energy and newly-created metals supplied by the starburst. This process has potentially important implications for the evolution of both dwarf galaxies and the IGM.
References
- (1) Anders, E., & Grevesse, N. 1989, Geochim. Cosmochim. Acta., 53, 197
- (2) Chevalier, R., & Clegg, A., 1986, Nature, 317, 44
- (3) Dekel, A., & Silk, J. 1986, ApJ, 303, 39
- (4) della Ceca, R., Griffiths, R., & Heckman, T. 1997, ApJ, 485, 581
- (5) della Ceca, R., Griffiths, R., Heckman, T., & MacKenty, J. 1996, ApJ, 469, 662
- (6) de Mello, D., Leitherer, C., & Heckman, T. 2000, ApJ, 530, 251
- (7) De Young, D., & Heckman, T. 1994, ApJ, 431, 598
- (8) Dopita, M., Sutherland, R. 1996, ApJS, 102, 161
- (9) Edgar, R., & Chevalier, R. 1986, ApJL, 310, L27
- (10) Ellison, S., Songaila, A., Schaye, J., & Pettini, M. 2000, AJ, 120, 1175
- (11) Gibson, B., Loewenstein, M., & Mushotzky, R. 1997, MNRAS, 290, 623
- (12) Heckman, T. 1998, in Origins, ASP Conf. Series, 148, 127
- (13) Heckman, T. 2000, astro-ph/0009075
- (14) Heckman, T., & Leitherer, C. 1997, AJ, 114, 69
- (15) Heckman, T., Robert, C., Leitherer, C., Garnett, D., & van der Rydt, F. 1998, ApJ, 503, 646
- (16) Heckman, T., Lehnert, M., Strickland, D., & Armus, L. 2000, ApJS, 129, 493
- (17) Heckman, T., Sembach, K., Leitherer, C., Martin, C.L., Meurer, G., de Mello, D. 2001, in preparation
- (18) Hensler, G., Dickow, R., Junkes, N., & Gallagher, J. 1998, ApJL, 502, L17
- (19) Kinney, A., Bohlin, R., Calzetti, D., Panagia, N., & Wyse, R. 1993, ApJS, 86, 5
- (20) Koo, B., McKee, C. 1992, ApJ, 388, 93
- (21) Leitherer, C., & Heckman, T. 1995, ApJS, 96, 9
- (22) Lynden-Bell, D. 1992, in Elements and the Cosmos, ed. M. Edmunds & R. Terlevich (Cambridge: Cambridge Univ. Press), 270
- (23) MacLow, M., & McCray, R. 1988, ApJ, 324, 776
- (24) MacLow, M., & Ferrara, A. 1999, ApJ, 513, 142
- (25) MacLow, M., McCray, R., & Norman, M. 1989, ApJ, 347, 141
- (26) Marlowe, A., Heckman, T., Wyse, R., & Schommer, R. 1995, ApJ, 438, 563
- (27) Marlowe, A., Meurer, G., & Heckman, T. 1999, ApJ, 522, 183
- (28) Martin, C. 1998, ApJ, 506, 222
- (29) Martin, C. 1999, ApJ, 513, 156
- (30) Mathis, J. 1990, ARA&A, 28, 37
- (31) McKee, C., & Ostriker, J. 1977, ApJ, 218, 148
- (32) Meurer, G., Freeman, K., Dopita, M., & Cacciari, C. 1992, AJ, 103, 60
- (33) Meurer, G., Heckman, T., Leitherer, C., Kinney, A., Robert, C., & Garnett, D. 1995, AJ, 110, 2665
- (34) Meurer, G., Stavely-Smith, L., & Killeen, N. 1998, MNRAS, 200, 705
- (35) Meurer, G., Heckman, T., & Calzetti, D. 1999, 521, 64
- (36) Moos, H.W. et al. 2000, ApJ, 538, L1
- (37) Morton, D. 1991, ApJS, 77, 119
- (38) Nahar, S. 1999, ApJS, 120, 131
- (39) Pettini, M., Kellogg, M., Steidel, C., Dickinson, M., Adelberger, K., & Giavalisco, M. 1998, 508, 539
- (40) Pettini, M., Steidel, C., Adelberger, K., Dickinson, M., & Giavalisco, M. 2000, ApJ, 528, 96
- (41) Ponman, T., Cannon, D., & Navarro, J. 1999, Nature, 397, 135
- (42) Sahnow, D.S., et al. 2000, ApJ, 538, L7
- (43) Sahu, M. 1998, AJ, 116, 1205
- (44) Sahu, M., & Blades, J.C. 1997, ApJL, 484, L12
- (45) Savage, B., & Sembach, K. 1991, ApJ, 379, 245
- (46) Savage, B., & Sembach, K. 1996, ARA&A, 34, 279
- (47) Savage, B., Bohlin, R., Drake, J., & Budich, W. 1977, ApJ, 216, 291
- (48) Sembach, K., & Savage, B. 1992, ApJS, 83, 147
- (49) Sembach, K. et al. 2000, ApJL, 538, L31
- (50) Sembach, K., Heckman, T., Leitherer, C. 2001, Meurer, G., Martin, C.L., & de Mello, D. 2001, in preparation
- (51) Shull, J.M., & McKee, C. 1979, ApJ, 227, 131
- (52) Shull, J.M., & Slavin, J.D. 1994, ApJ, 427, 784
- (53) Slavin, J., Shull, J.M., & Begelman, M. 1993, ApJ, 407, 83
- (54) Steidel, C., Giavalisco, M., Pettini, M., Dickinson, M., & Adelberger, K. 1996, ApJL, 462, L17
- (55) Silich, S., & Tenorio-Tagle, G. 1998, MNRAS, 299, 249
- (56) Sofia, U., & Jenkins, E. 1998, ApJ, 499, 951
- (57) Strickland, D., & Stevens, I. 2000, MNRAS, 314, 511
- (58) Suchkov, A., Balsara, D., Heckman, T., & Leitherer, C. 1994, ApJ, 430, 511
- (59) Sutherland, R., & Dopita, M. 1993, ApJS, 88, 253
- (60) Tenorio-Tagle, G., Silich, S., Kunth, D., Terlevich, E., & Terlevich, R. 1999, MNRAS, 309, 332
- (61) Tozzi, P., Scharf, C., & Norman, C. 2000, ApJ, 542, 106
- (62) van Zee, L., Haynes, M., & Salzer, J. 1997, AJ, 114, 2497
- (63) Vidal-Madjar, A. et al. 2000, ApJL, 538, L77
- (64) Weaver, R., McCray, R., Castor, J., Shapiro, P., & Moore, R. 1977, ApJ, 218, 377
- (65) White, R., & Long, K. 1991, ApJ, 373, 543
| ID | |||||
|---|---|---|---|---|---|
| (1) | (2) | (3) | (4) | (5) | (6) |
| H2 Q(1) | 1009.770 | 35(3) | 35(3) | … | … |
| C II | 1036.337 | 51030 (L1) | 680 (L1)c | +18 | +582 |
| 49222 (L2) | 670 (L2)c | ||||
| C III | 977.020 | 56030 (S2) | 800 (S2)b | +28 | +555 |
| 52035 (S1) | 700 (S1)b | ||||
| N I | 1134.165 | 12110 (L1) | 2310 (L1) | +28 | +582 |
| 13410 (L2) | 2410 (L2) | ||||
| N I | 1134.415 | 15510 (L1) | 3210 (L1) | +24 | +590 |
| 15610 (L2) | 2310 (L2) | ||||
| N I | 1134.980 | 17111 (L1) | 3511 (L1) | +25 | +602 |
| 16110 (L2) | 3510 (L2) | ||||
| N II | 1083.990 | 35625 (S2) | 33835 (S2) | +7 | +573 |
| O I | 1039.230 | 26020 (L1)a | 24315 (L1) | +14 | +592 |
| 25220 (L2)a | 23715 (L2) | ||||
| O I | 988.773 | 30225 (S2)a | 48030 (S2) | +10 | +595 |
| 28330 (S1) | 54045 (S1) | ||||
| O VI | 1031.926 | 25222 (L1) | 17118 (L1) | +25 | +545 |
| 22022 (L2) | 19119 (L2) | ||||
| Si II | 1020.699 | 12916 (L1) | 9424 (L1) | +16 | +589 |
| 10412 (L2) | 6520 (L2) | ||||
| S III | 1012.502 | 14320 (L1)b | 25015 (L1) | +8 | +578 |
| 12820 (L2)b | 21520 (L2) | ||||
| S IV | 1062.662 | 36 (3) | 8515 (L1) | … | +555 |
| 36 (3) | 8215 (L2) | ||||
| Ar I | 1048.220 | 7610 (L1) | 6010 (L1) | +20 | +566 |
| 8310 (L2) | 8020 (L2) | ||||
| Fe II | 1063.176 | 12511 (L1) | 16216 (L1) | +11 | +597 |
| 14013 (L2) | 17721 (L2) | ||||
| Fe II | 1144.938 | 19212 (L1) | 26217 (L1) | +20 | +601 |
| 20611 (L2) | 24117 (L2) |
Note. — The line equivalent widths in the Milky Way (Col. 3) and NGC 1705 (Col. 4) are in mÅ. These widths and the 1 errors were derived according to the prescription outlined by Sembach & Savage (1992). The values account for statistical noise and modest continuum placement uncertainties. In some cases, additional uncertainties (not listed) due to stellar blending and fixed-pattern noise introduced by the FUSE detectors may be warranted. The detector segment utilized (LiF1, LiF2, SiC1, and SiC2) is indicated in parentheses following each equivalent width. The letters appended after these measurements have the following meaning: - Value may be affected by terrestrial O I airglow emission; - Line probably has some stellar blending, measurement uncertain; - Lower limit because of blending with other lines. The radial velocities of the centroids for Milky Way (Col. 5) and NGC 1705 lines (Col. 6) are in the LSR frame. These were derived by fitting single Gaussian profiles to the absorption lines. Typical uncertainties are 10 km s-1. The wavelength scale in our data has been adjusted so that the Milky Way neutrals agree with the mean velocity of the lines from similar species in our STIS echelle spectrum of NGC 1705 (Sembach et al. 2001; Heckman et al. 2001).
| Species | |||||
|---|---|---|---|---|---|
| (Side1) | (Side2) | Final | |||
| H2 (J=0) | 14.2 | 14.2 | 14.2 | ||
| H2 (J=1) | 14.2 | 14.2 | 14.2 | ||
| H2 (J=2) | 14.2 | 14.2 | 14.2 | ||
| H I | 1025.7 | 1.909 | 20.2 | 20.2 | 20.20.2 |
| N I | 1134.1 | 1.182 | 14.17 | 14.30 | 14.30 |
| 1134.4 | 1.483 | 14.08 | 14.07 | 14.07 | |
| 1135.0 | 1.660 | 13.97 | 13.98 | 13.970.08 | |
| N II | 1084.0 | 2.048 | — | 14.70 | 14.700.15 |
| O I | 1039.2 | 0.980 | 15.64 | 15.63 | 15.630.08 |
| O VI | 1031.9 | 2.137 | 14.26 | 14.26 | 14.260.08 |
| Si II | 1020.7 | 1.460 | 14.68 | 14.51 | 14.610.14 |
| S III | 1012.4 | 1.556 | 15.02 | 15.00 | 15.020.12 |
| S IV | 1062.7 | 1.628 | 14.45 | 14.43 | 14.450.08 |
| Ar I | 1048.2 | 2.408 | 13.44 | 13.49 | 13.460.10 |
| Fe II | 1144.9 | 2.084 | 14.53 | 14.54 | 14.540.10 |
| 1063.2 | 1.805 | 14.54 | 14.55 | 14.540.10 |
Note. — The -values are taken from Morton (1991), and is in Å. Column densities (cm-2) were derived by converting the observed absorption profiles into optical depth profiles and integrating over velocity (see Savage & Sembach 1991). These column densities do not have any saturation corrections applied, though these are expected to be small given the great breadth of the lines. A comparison of the results for the two lines listed indicates that this is indeed the case. In the case of the column, we quote the average of the value obtained from the higher-order Lyman series in the data and the value derived from by Heckman & Leitherer (1997).