A Pair of Compact Red Galaxies at Redshift 2.38, Immersed in a 100 kpc Scale Ly Nebula11affiliation: Based upon observations with the Anglo-Australian Telescope, the Cerro Tololo Blanco Telescope, observations taken with the ESO New Technology Telescope (NTT) at the La Silla Observatory under program-ID No.63.0-0291(A), and observations taken with the NASA/ESA Hubble Space Telescope, obtained at the Space Telescope Science Institute, which is operated by the Association of Universities for Research in Astronomy, Inc., under NASA contract No. NASS-26555
Abstract
We present Hubble Space Telescope (HST) and ground-based observations of a pair of galaxies at redshift 2.38, which are collectively known as 21424420 B1 (Francis et al., 1996). The two galaxies are both luminous extremely red objects (EROs), separated by 0.8″. They are embedded within a 100 kpc scale diffuse Ly nebula (or blob) of luminosity .
The radial profiles and colors of both red objects are most naturally explained if they are young elliptical galaxies: the most distant yet found. It is not, however, possible to rule out a model in which they are abnormally compact, extremely dusty starbursting disk galaxies. If they are elliptical galaxies, their stellar populations have inferred masses of and ages of years. Both galaxies have color gradients: their centers are significantly bluer than their outer regions. The surface brightness of both galaxies is roughly an order of magnitude greater than would be predicted by the Kormendy relation. A chain of diffuse star formation extending 1″ from the galaxies may be evidence that they are interacting or merging.
The Ly nebula surrounding the galaxies shows apparent velocity substructure of amplitude . We propose that the Ly emission from this nebula may be produced by fast shocks, powered either by a galactic superwind or by the release of gravitational potential energy.
1 Introduction
Two of the most enigmatic types of high redshift galaxy are the extremely red objects (EROs, eg. Hu & Ridgway, 1994; Thompson et al., 1999), and the Ly blobs (eg. Lowenthal et al., 1991; Francis et al., 1996; Keel et al., 1999; Steidel et al., 2000; Roche, Lowenthal & Woodgate, 2000; Kobulnicky & Koo, 2000).
EROs are defined as having extremely red observed-frame optical/near-IR colors, and may be dusty starburst galaxies or AGN (eg. Smail et al., 1999; Hughes et al., 1998), or spheroidal galaxies (eg. Cimatti et al., 1999; Dunlop et al., 1996; Soifer et al., 1999; Moriondo, Cimatti & Daddi, 2000).
The Ly blobs are characterized by 100 kpc scale low surface brightness Ly nebulae, with total Ly luminosities . All Ly blobs identified to date appear to lie in proto-cluster environments. It has been proposed that these blobs are a form of AGN, that they are associated with cooling flows (Steidel et al., 2000; Haiman, Spaans & Quataert, 2000) or that they are generated by galaxy superwinds (Taniguchi & Shioya, 2000).
Can a galaxy be both an ERO and a Ly blob? Many high redshift radio galaxies contain ERO nuclei embedded within dense gaseous regions, which are often associated with extended diffuse Ly emission (eg. McCarthy, 1993; Pentericci et al., 1997; Ivison et al., 2000; Carilli et al., 1997; Binette et al., 2000; Bicknell et al., 2000).
In this paper we present a detailed study of a radio quiet Ly blob that contains two compact EROs. Francis et al. (1996) identified 21424420 B1, which is a luminous Ly and C IV emitting source at redshift . The enormous Ly luminosity of this source comes from an extended kpc low surface brightness nebula. Ground-based near-IR observations showed an unresolved, luminous, extremely red source lying within this blob. The whole system appears to lie within a cluster of Lyman-limit QSO absorption-line systems (Francis, Wilson & Woodgate, 2000). The optical properties of this source closely resemble those of many high redshift radio galaxies, but Francis et al. (1996) obtained an upper limit on its radio flux of 0.27 mJy at 1344 and 2378 MHz.
We describe our observations in Section 2, and show the results in Section 3. We then discuss the nature of the ERO (Section 4) and of the Ly blob surrounding it (Section 5). In Section 6 we conclude that this object is probably a pair of young merging elliptical galaxies, though a compact dusty starburst model is hard to completely exclude. We further conclude that the Ly nebula surrounding them is either photoionized by an AGN or shock excited by the energy of gravitational infall or of a superwind.
We assume a flat universe with , and . At , given this cosmology and redshift, one arcsecond corresponds to proper Kpc, and the luminosity distance is .
2 Observations
Our previous observations of this object can be found in Francis & Hewett (1993); Francis et al. (1996); Francis, Woodgate & Danks (1997) and Francis, Wilson & Woodgate (2000). The observation log is in Table 1. HST imaging was used to determine the morphology and colors of B1. Ground-based imaging measured its integrated colors and diffuse Ly emission. Slitless spectroscopy and Fabry-Perot imaging was used to constrain the velocity structure.
In addition to our own observations, we searched the ROSAT All Sky Survey (Voges et al., 1999) for data on this object. There is only a 308 sec exposure toward the field, giving a 90% upper limit X-ray count rate of 0.0075 counts sec-1. Assuming a Galactic column density of cm-2 along this line of sight (which is the weighted mean of the four nearest 21 cm measurements) and a power law spectrum with an energy index of 1.0, we obtain a flux E-2 photons cm-2 sec-1 keV-1 where E is the energy in keV.
| Instrument | Filter | Rest-frame | Exposure | Date | Notes |
|---|---|---|---|---|---|
| wavelength (nm) | (s) | ||||
| HST/WFPC2 | F410M | 67200 | 1999 Aug 27—Sep 8 | ||
| HST/WFPC2 | F450W | 19400 | 1999 Aug 31—Sep 2 | ||
| HST/WFPC2 | F702W | 14400 | 1999 Aug 23 | ||
| HST/NICMOS | F110W | 5120 | 1998 Jun 27 | ||
| HST/NICMOS | F160W | 10112 | 1998 Oct 30 | aaNot taken during a NIC3 focus campaign. Image quality degraded, and image partially vignetted | |
| HST/NICMOS | F164N | 10236 | 1997 Oct 30 | aaNot taken during a NIC3 focus campaign. Image quality degraded, and image partially vignetted | |
| HST/STIS | Clear | 3120 | 1998 Oct 25—27 | bbTaken to allow registration of the slitless spectroscopy | |
| HST/STIS | G430L | 17000 | 1998 Oct 25—27 | ccSlitless spectroscopy | |
| NTT/SOFI | 3540 | 1999 Aug 16 | |||
| NTT/SOFI | 4740 | 1999 Aug 16 | |||
| NTT/SOFI | 3480 | 1999 Aug 16 | |||
| CTIO/Mosaic | 4107Å | 18000 | 1999 Aug 7 | ||
| CTIO/Mosaic | 9000 | 1999 Aug 8 | |||
| CTIO/Mosaic | 7200 | 1999 Aug 7—8 | |||
| CTIO/Mosaic | 7800 | 1999 Aug 7—8 | |||
| CTIO/Mosaic | 2400 | 1999 Aug 8 | |||
| CTIO/Mosaic | 4800 | 1999 Aug 8 | |||
| AAT/TTF | 4110Å | 5400 | 1999 Sep 11 | ddWavelength calibration uncertain | |
| AAT/TTF | 4114Å? | 5400 | 1999 Sep 11 | ddWavelength calibration uncertain | |
| AAT/TTF | 4118Å | 9000 | 1999 Sep 12 | ddWavelength calibration uncertain |
2.1 WFPC2 Imaging
The cluster region was observed for 38 orbits with the Wide Field and Planetary Camera II (WFPC2, Trauger et al., 1994) on the Hubble Space Telescope. Galaxy B1 was placed on the WF3 chip. Exposures were dithered on a sub-pixel grid, to allow reconstruction of a better sampled image. Broad-band images were obtained through the F450W and F702W filters. Relatively narrow-band images were taken through the F410M filter, which matches the wavelength of Ly at the cluster wavelength. The F410M images suffer from a very low surface brightness, time-varying mottling. We hypothesise that this is caused by scattered Earth-light.
The images were pipeline processed, then cosmic rays were removed and the frames co-added using the drizzle algorithm (Fruchter & Hook, 1998) to minimise undersampling.
2.2 STIS Slitless Spectroscopy
The Space Telescope Imaging Spectrograph (STIS, Woodgate et al., 1998) observations (pairs of slitless spectra and images) were taken at two different orientation angles separated by 11.5 deg, in an attempt to separate slitless spectra from objects aligned along the same row for a given angle. For both the direct clear-aperture and the dispersed images, the CCD was binned , producing a plate scale of arcsec/pixel, and spectral resolution Å for point sources. There were 20 exposures each for the direct and dispersed images, with dithering of arcsec between each exposure in order to minimize the effects of cosmic rays and hot pixels. The direct and dispersed images were combined using the STIS GTO team software CALSTIS (Lindler, 1998; Gardner et al., 1998). The spectra were extracted using both the stis_extract (Chen, Lanzetta & Pascarelle, 1999) and slwidget (Lindler, 2000) software. Results from both were consistent.
2.3 NICMOS Imaging
The Near Infrared Camera and Multi Object Spectrometer (NICMOS, Thompson et al., 1998) observations were made with Camera 3, through the F110W, F160W and F164N filters. All exposures were dithered for each filter over 4 (or 8 in the case of F160W) positions spanning a arcsec box, to minimize the effects of bad pixels. The F160W and F164N observations are affected by vignetting from the field offset mirror, and were taken before the focus became optimal. The NICMOS data were reduced using the same methods as for SOFI (Section 2.4). The data were also reduced using NICRED (McLeod, 1997); there is little difference between final images reduced by the two methods. A comparison of broadband SOFI and NICMOS data show the photometry to be consistent between the two, with the exception of a vignetted band along one end of the chip in the F160W and F164W images.
2.4 NTT Imaging
Near-IR photometry was obtained with the SOFI camera on the ESO New Technology Telescope (NTT, Lidman, Cuby & Vanzi, 2000) . Conditions were photometric, but seeing was 1.1″ and the telescope was subject to considerable wind shake. The data were reduced using a modified version of IRAF111IRAF is distributed by the National Optical Astronomy Observatories, which is operated by the Association of Universities for Research in Astronomy, Inc. (AURA) under cooperative agreement with the National Science Foundation. scripts written by Peter McGregor. NICMOS standards (Persson et al., 1998) were used.
2.5 Cerro Tololo 4m Imaging
We obtained broad- and narrow-band (Ly) imaging of this field with the MOSAIC camera (Muller et al., 1998), at the prime focus of the Cerro Tololo Inter-American Observatory (CTIO) 4m Blanco Telescope. The narrow-band images were taken through a specially purchased filter, which working in the f/2.8 beam has a bandpass of 54Å, centered at 4107Å. Conditions were mostly photometric, with seeing ″.
2.6 Anglo-Australian Telescope Narrow-band Imaging and Spectroscopy
Our Anglo-Australian Telescope imaging was obtained with the Taurus Tunable Filter (TTF, Bland-Hawthorn & Heath-Jones, 1998), which is a Fabry-Perot etalon system. Conditions were photometric on the first night, and the typical image quality was ″. A MIT-Lincoln Labs CCD was used behind the TTF.
The TTF was used with a full-width at half maximum (FWHM) spectral resolution of between 3.35 and 4.4Å. Images were obtained at central wavelengths of 4110Å, 4114Å, and 4118Å.
An electronics fault was subsequently found to induce significant wavelength drifts on timescales of a few hours. The 4110 and 4118Å observations were taken within four hours of a calibration, but the 4114Å observations were taken between four and eight hours after the calibration. Thus the wavelength calibration of all three images are somewhat uncertain, particularly that of the 4114Å image.
3 Results
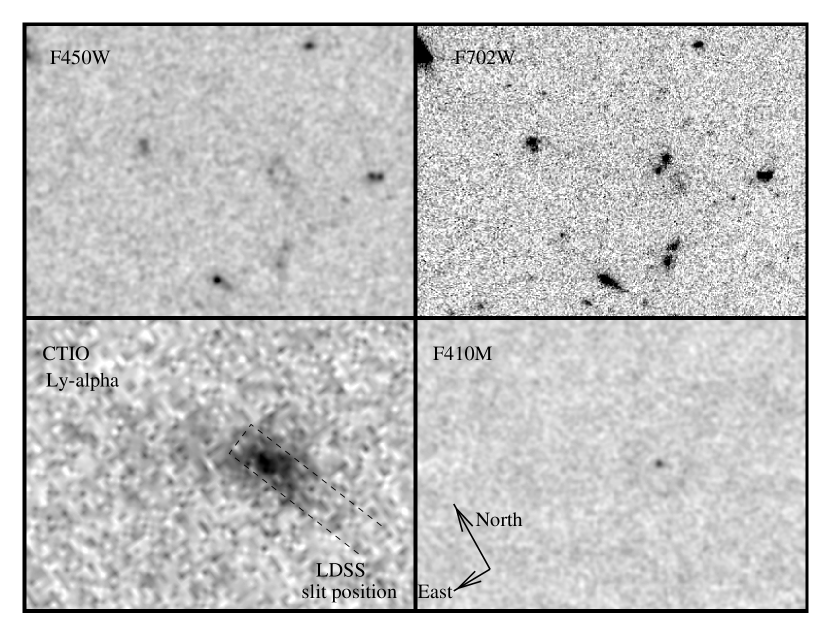
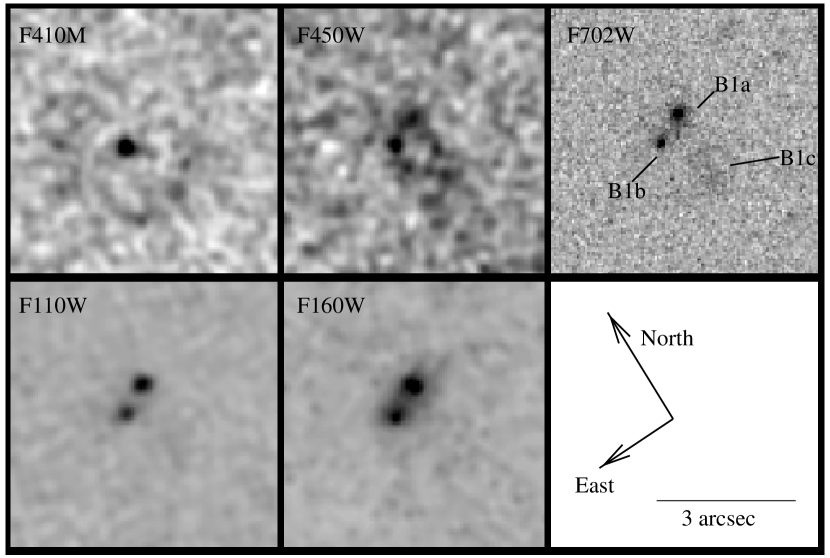
Our images of B1 are shown in Figures 1 & 2. The appearance of B1 varies dramatically as a function of wavelength and resolution. In the observed-frame red and near-IR, it breaks up into two compact components: B1a and B1b (Fig 2), separated by 0.8″. In this respect it is similar to another strong, high redshift Ly source, the Coup-Foureé galaxy (Roche, Lowenthal & Woodgate, 2000). A third continuum source, B1c, appears as chain of diffuse knots extending about 1″ to the south from B1a and B1b.
In Ly, the picture is different again. When viewed with WFPC2, we see a knot of Ly emission from B1b, but no emission from B1a. Diffuse patches of low surface brightness Ly emission are found ″ to the south and north-east of B1b. The ground-based CTIO image has much greater sensitivity to low surface brightness Ly emission, and confirms that it extends at least 10″ north-east of B1a and B1b, as reported by Francis et al. (1996) and Francis, Woodgate & Danks (1997). The non-detection of this emission in the WFPC2 image indicates that it is truly diffuse, and not coming from a series of compact sources separated by less than the ground-based resolution limit (as was the case for the Ly nebula observed by Pascarelle et al. (1996)).
The Ly contribution to the blue continuum images, and the blue continuum contribution to the narrow-band Ly images, were removed. B1 has a total Ly flux of about : a more exact number is hard to calculate as the diffuse flux fades gradually into the sky (this number is for a rectangular aperture 10″ long and 5″ wide, aligned along the major axis of the Ly flux). B1b has a Ly flux of , which is only % of the total. The remaining flux is diffuse: the average Ly surface brightness of the region within 2″ of B1b is . 4″ further east, the average surface brightness drops to .
3.1 Fluxes
Continuum fluxes (Table 3) were calculated for the three components of B1. Small circular apertures were used: 0.3″ in radius for B1a and B1b, and 0.65″ for B1c. These small apertures will miss much of the flux of these components, but were chosen to avoid contamination from the other components. No aperture corrections were attempted. A total flux for B1 was also measured, using a 2″radius aperture.
Error estimates were made using apertures placed randomly on sky regions. A copy of the image was made with all the sources detected by the SExtractor (Bertin & Arnouts, 1996) package masked out. We randomly placed 1000 apertures of identical radius on the image. Any aperture that fell on a masked region was rejected, and the procedure continued until 1000 clean measurements had been obtained. The standard deviation of these measurements is our sky error estimate. A Poisson noise model was combined with the sky error estimate to calculate object flux errors. The Ly contribution to the F450W flux has been removed, but the probable emission-line contributions to F110W, F160W and have not been removed: these contributions are discussed in Section 3.1.1. Finally, the fluxes were corrected for the local Milky Way extinction (), as estimated by Schlegel, Finkbeiner & Davis (1998). The extinction curve of Cardelli, Clayton & Mathis (1989) was used.
Integrated near-IR magnitudes for B1 were measured from the NTT image, using SExtractor with 4.2″ radius circular apertures. We measure , and .
The measured coordinates of the components of B1 are shown in Table 2.
| Component | Coordinates (J2000) |
|---|---|
| B1a | 21:42:27.4544:20:28.69 |
| B1b | 21:42:27.5144:20:28.99 |
| B1c | 21:42:27.4644:20:30.2 |
| Filter | Flux () | |||
|---|---|---|---|---|
| B1 (total) | B1a | B1b | B1c | |
| F450W () | aa3 upper limit | |||
| F702W () | ||||
| F110W () | aa3 upper limit | |||
| F160W () | ||||
3.1.1 Emission-line Contamination
The near-IR filters are subject to possible emission-line contamination at this redshift, z=2.38. [O II] (3727 Å) is redshifted into the -band, H and the [O III] (4959 and 5007 Å) doublet are shifted into the -band, and H and [N II] (6583 Å) are shifted into the band. These lines could in principle be very strong (eg. Eales et al., 1993). In this section, we estimate their strength, and conclude that it is probably small.
As described in Francis et al. (1996), we imaged the field with a narrow-band filter of wavelength coverage m, which includes both H and [N II]. Using a 5″ radius aperture, we determine that these lines contribute % of the integrated flux of B1. The F164N NICMOS image covers the wavelength of redshifted H. No significant narrow-band excess was detected: we can place a upper limit on the fraction of the integrated -band light coming from H in B1 of 3% .
We have no direct measurements of the other line fluxes, so we estimate their importance by making assumptions about their ratios with measured Balmer lines. Typical line ratios were taken from Osterbrock & Martel (1993), Kennicutt (1992) and Teplitz et al. (2000), for a variety of assumed chemical compositions and ionization sources, and including both narrow- and broad-line AGN ratios.
We conclude that line emission probably contributes only % at most of the total continuum flux of B1 in and . In , the contribution is probably % . Furthermore, only about 10% of the line flux will likely come from within the photometric aperture of B1b, and % from within the aperture of the B1c. The remainder of the optical emission lines will come from the region of the diffuse blob. As B1a shows no Ly emission, its rest-frame optical line flux is also probably small.
The line corrections will thus probably be minimal. We have not, therefore, applied any emission-line corrections to the near-IR fluxes.
3.2 Velocity Structure
The Ly line is generally extremely optically thick and often strongly self absorbed, making it a very unreliable tracer of dynamics. It is, however, the only sufficiently strong line available to us, and can be used to place some limits on the dynamics of the Ly nebula surrounding B1.
The velocity dispersion of the gas around B1 (measured at the peak of the surface brightness, as seen in ground-based images) is (Francis et al., 1996). Ly is redshifted with respect to C IV, indicating probable self absorption. The deep multislit spectroscopy of Francis, Woodgate & Danks (1997) marginally spatially resolves this emission along the slitlet. Fig 3 shows the spectra extracted from different CCD columns: notice the extra component at in the southernmost spectrum (and another possible component at ).

The diffuse Ly structure differs significantly between the three TTF images. This confirms the existence of multiple velocity components separated by . It is hard to say more, given the uncertainty in the wavelength calibration of the TTF data (Section 2.6).
The STIS spectrum detected the Ly flux from B1b. A flux of was measured, consistent with the value derived from the WFPC2 imaging. The line was not significantly spectrally resolved; an upper limit on the velocity dispersion of can be placed.
4 The Continuum
4.1 The Colors

The spectral energy distributions (SEDs) of the three components of B1 are shown in Fig 4. B1a and B1b are quite red, while the SED of B1c is very blue. B1c’s colors are similar to those of Lyman-break galaxies (eg. Steidel et al., 1996). A power-law fit to its colors gives a slope of the form , which is close to the median slope of Lyman break galaxies (1.5, Adelberger & Steidel, 2000).
Our NTT photometry demonstrates that while B1 is red at wavelengths shortward of , it has a relatively blue color. This confirms the result of Francis et al. (1996). B1’s SED thus peaks in the -band. As we discussed in Section 3.1.1, this is unlikely to be an artifact of emission-line contamination.
4.1.1 Modelling
We modelled the SEDs of B1 using the 1997 version of the spectral synthesis models of Bruzual & Charlot (1993). Models both with continuous uniform star formation and models in which all the stars were formed in an instantaneous burst (a simple stellar population) were used. All models had Salpeter stellar initial mass functions, with no mass cut-off. Dust was modelled using the empirical absorption curves of Calzetti, Kinney & Storchi-Bergmann (1994). Our predicted colors are compared with the observations in Figures 5 and 6.


The red components, B1a and B1b, can be fit by two models:
-
•
An unreddened burst model of age Myr (1 limits) and stellar mass . This naturally fits the -band peak (Fig 6) and the photometry from thru . It greatly underpredicts the observed F450W flux of B1a. We do not consider this to be a problem: a star formation rate of only will produce OB stars sufficient to produce the observed blue flux.
-
•
A dusty starburst model. The best fit is a model with a continuous star formation rate of , an extinction of mag, and an age of 500 Myr. A slightly worse fit (but still acceptable at the level) is younger (100 Myr), dustier ( mag) and has a star formation rate of .
The dusty starburst model is hard to reconcile with the strong Ly emission of B1b, as Ly is resonantly scattered and thus very strongly absorbed by even small amounts of dust.
B1c is much bluer, and can be fit either by an unreddened instantaneous burst model of age Myr and mass , or by a slightly dusty continuous star formation model, with a star formation rate of and .
4.2 The Radial Profiles
In this section, we show that B1a and B1b are spatially extended. They are, however, very compact objects: too compact to be easily modelled as spiral galaxy disks. They appear to show colour gradients: bluer in their central regions.
In Figures 7 and 8 we compare the radial profiles of B1a and B1b with the relevant point spread functions (PSFs) measured from a bright star in the same image. B1a and B1b are marginally resolved in the F702W (rest-frame 2100 Å) and F110W (rest-frame 3250 Å) images. The F160W (rest-frame 4730Å) image was taken with NICMOS out of focus, and it does not significantly resolve B1a and B1b. The observed PSF does not vary significantly across the images, and is consistent with analytic predictions.


Although B1a and B1b are clearly resolved, both are very compact, with the observed surface brightness dropping to half its peak value within about 0.1″ ( kpc). This places a strong constraint on the size of the galaxies. Consider a disk galaxy, with a typical radial surface brightness profile of the form
(Binney & Merrifield, 1998). The surface brightness of such a disk drops to half its peak value at (Fig 9). Thus our observations require that kpc. Only % of modern galaxy disks are this compact (Kent, 1984). Now consider a spheroidal galaxy, with a radial surface brightness profile of the form
(Binney & Merrifield, 1998). This profile is much more sharply peaked than the exponential disk profile, and its surface brightness drops to half its peak value at (Fig 9). Thus kpc. Over 50% of modern elliptical galaxies have effective radii this small (Djorgovski & Davis, 1987).

More detailed modelling confirms these results. A wide variety of model galaxy profiles were convolved with PSFs and fit by minimisation to the observed radial profiles. The modelling confirms that B1a and B1b are significantly extended. Both exponential disk models and spheroidal (de Vaucouleurs) models give acceptable fits to the data, as do models with a point source embedded in a fainter halo. Pure exponential disk models only give acceptable fits if ( pc), which would place B1a and B1b in the most compact 1% of present-day disk galaxies. Spheroidal models give best fits for effective (half-light) radii of around ″ ( kpc), which are typical of modern elliptical galaxies. Models which combine a nuclear spheroid or point source with a disk can give acceptable fits, but only if the disk is unusually small and/or contributes only a small fraction ( 10%) of the light.
The compact radial profiles of B1a and B1b are typical of those of high redshift Lyman-break galaxies (Giavalisco, Steidel & Macchetto, 1996). The inferred surface brightnesses in the rest-frame UV are comparable to those of faint Lyman-break galaxies, but the rest-frame optical surface brightnesses are an order of magnitude higher. As Giavalisco, Steidel & Macchetto (1996) note, these compact radial profiles are consistent with present-day elliptical galaxy profiles or bulges, but are much more compact than present-day disks.
Curiously, both B1a and B1b appear to be significantly larger at longer wavelengths. This can be seen in Figures 7 and 8: despite the wider PSF for the F110W filter, both components are clearly more extended than as seen through the F702W filter. Our modelling confirms this result: even after convolution with the relevant PSFs, no single model gives a good fit to either B1a or B1b at both F702W and F110W. The central kpc of both components is magnitudes bluer in F702WF110W than the outer regions.
The change in size as a function of wavelength could be explained by a colour gradient within a single spheroidal component. It could also be explained by a two component model: a compact blue component that dominates at rest-frame 2100Å and a more diffuse (but still compact) red component that dominates at 3250Å and beyond. This red component, if disk-like, must have , which would still place it in the most compact 1% of low redshift disks.
4.3 Discussion
What are the continuum components of B1? B1c, with its blue colors, appears relatively straightforward: it is a region of extended moderate star formation, obscured by little dust. This star formation may be triggered by the interaction of B1a and B1b.
The nature of B1a and B1b is less straightforward. We consider four models in turn.
4.3.1 Elliptical Galaxies
Could B1a and B1b be young elliptical galaxies? This hypothesis fits the data well.
-
•
The radial profiles of B1a and B1b are well fit with de Vaucouleurs profiles, and the inferred radii are typical of present-day elliptical galaxies.
-
•
The red colors are most easily explained by a stellar population which completed its star formation about 750 Myr before we observe it. It would thus be similar to modern EA galaxies.
-
•
B1 lies in an overdense region of the early universe (Francis, Wilson & Woodgate, 2000), which may be the ancestor of a galaxy cluster.
-
•
The velocity field around B1, if virial, implies masses of .
If B1a and B1b are elliptical galaxies, how do their surface brightnesses and sizes fit on the Kormendy relation (Kormendy, 1977; Hoessel, Oegerle & Schneider, 1987)? The F160W filter corresponds quite closely to the rest-frame -band. The radial profile fitting suggests that both components have effective radii in the observed-frame near-IR of kpc. Integrating a de Vaucouleurs profile over our photometric aperture, we can convert our observed magnitudes into rest-frame -band surface brightnesses at the effective radius. Were these components at low redshift, their surface brightnesses at the effective radius would be . This is roughly an order of magnitude higher than the Kormendy relation would predict for an elliptical galaxy of this radius. This is consistent with passive evolution from our unreddened burst model (Section 4.1).
If B1a and B1b are elliptical galaxies, why do they apparently show color gradients? The UV emission from the central kpc could be caused by a starburst, a hole in the dust or (for B1b) an AGN. Alternatively, some chemodynamical models predict color gradients in young elliptical galaxies (eg. Friaça & Terlevich, 1998; Jiminez et al., 1999).
4.3.2 Dusty AGN
A dusty AGN can certainly have colors as red as B1a and B1b (eg. Francis, Whiting and Webster, 2000). The red components of B1a and B1b are however spatially extended, and hence cannot be produced by an AGN. Could the observed color gradient, however, be caused by the superposition of a compact blue AGN on a more extended, lower surface brightness red galaxy?
Even in the relatively blue central regions, the continuum slope is redder than , while radio-quiet QSOs have typical continuum slopes of (Francis, Whiting and Webster, 2000). Any central AGN would thus have to be reddened by dust with . This would make it hard for the Ly emission from B1b to escape. In addition, the AGN in B1a and B1b would need remarkably equal luminosities and dust extinctions to explain the very similar observed colors and radial profiles of the two components. This fine tuning seems implausible. Furthermore, the high measured surface brightness was measured in the F160W band, to which the central blue component does not significantly contribute. We therefore conclude that while AGN may be present, they are unlikely to be responsible for the observed colors. Sensitive hard X-ray or far-IR observations will be required to determine whether a dusty AGN is present.
4.3.3 Dusty Disk Galaxies
The more extended red component of B1a and B1b can be fit by a very compact exponential disk. Could these two objects then be compact spiral galaxies? The more compact bluer central component could be caused by AGNs or nuclear starbursts.
With sufficient dust, a spiral galaxy can certainly appear as red as these two components (Section 4.1.1). Two lines of reasoning however oppose this hypothesis.
-
1.
Even the extended red components are extremely compact by the standards of modern disk galaxies. This could, however, be explained if disk galaxies form from the inside outwards.
-
2.
This model requires that the outer (red) components of B1a and B1b be greatly reddened. This would make it difficult for the observed UV light and Ly emission from the bluer central components to escape.
4.3.4 Bulges plus Low Surface Brightness Disks
Could B1a and B1b be the bulges of two disk galaxies? The disks themselves may not have formed, or might be too low in surface brightness to be detected by the Hubble Space Telescope.
Two lines of reasoning oppose this hypothesis. Firstly, the red colors and -band peak of B1 are seen in our ground-based photometry with large () apertures. Thus any extended component must have a similar stellar population to that inferred here. Secondly, the inferred masses and sizes for B1a and B1b are far larger than those typical of the bulges of disk galaxies.
5 The Ly Nebula
B1 has a total Ly luminosity of , spread over a region at least kpc in size. The emission consists of a number of diffuse, discrete components with relative velocities of . What can produce such a luminous, diffuse, fast moving Ly nebula?
The bulk motions of the Ly nebula suggest that fast shocks must be present. We will show that such shocks are quite capable of producing the observed Ly luminosity. The puzzle then becomes one of explaining the origins of the bulk motions.
It has also been suggested that photoionzation by an AGN, or a cooling flow may power such nebulae. We discuss these possibilities, which are hard to exclude.
5.1 Physical Parameters of the Nebula
If we assume that the Ly velocities are representative of the gas, and not an artifact of the high optical depth in Ly, then the dynamical timescale (crossing time) of the nebula is years. This is interestingly similar to the inferred age of the stellar population (Section 4.1).
What is the density of the nebula? The sight-line to background QSO 21394434 passes 20″ from B1 (though it does not pass through the Ly nebula). The QSO spectrum shows a strong absorption-line system at the redshift of B1, with a column density (Francis, Wilson & Woodgate, 2000). If we assume that the column density through the Ly nebula is at least as great as this, and that the nebula is kpc thick (ie. as thick as it is wide) along the line of sight (both big assumptions), then its density must be at least . If, however, the density were this low, the gas would be fully ionized by the metagalactic UV background at this redshift. If the nebula is kpc thick, it must have a density of for its recombination rate to balance the photoionization from the UV background (Francis, Wilson & Woodgate, 2000). The diffuse star formation of B1c, taking place within part of the Ly nebula, also suggests that densities may be higher. In reality, of course, the cloud may be highly inhomogeneous, with dense neutral ‘bullets’ embedded in low density ionized gas.
If we take this lower limit on the density of the nebula (), and assume that the nebula is 100 kpc long, 30 kpc wide and 10 kpc thick, then its hydrogen mass is .
5.2 Shock Models
Whenever there are blobs of gas moving at supersonic relative speeds, as are observed in the nebula, shocks are inevitable. We thus know that shocks are present. Could the emission from these shocks produce the observed Ly emission?
5.2.1 Modelling
We used the fast shock models computed with the MAPPINGS III code to calculate the line emission from the shocks. MAPPINGS III is an updated version of the MAPPINGS II code (Dopita & Sutherland, 1996) and uses improved radiation continuum and hydrogenic calculations to calculate the line and continuum radiation from shocks. The new version of the code enabled the calculation of a grid of shocks for a range of metallicities, up to 1000 km/s, although a small number of low metallicity models above failed to converge after several global iterations. A fiducial model with a velocity of was used here, having achieved a converged solution over a range of metallicities.
If the shocks are radiative, and if we assume, for example, a density of , then the Ly emissivity will be , almost independent of the metallicity of the gas. A quarter of this comes from the shock itself, the rest coming from photoionization of the assumed neutral gas in front of the shock (the precursor region). If the shock is face-on to our sight-line, this would correspond to an observed surface brightness of : nearly two orders of magnitude greater than the observed Ly surface brightness (Section 3). Much of this may be self absorbed, but if even 1% escapes, it can explain our observations. The predicted Ly/C IV ratio is also consistent with the observations (Francis et al., 1996).
How does this vary with the assumed density of the gas? If the shocks are radiative, the emissivity will scale roughly with the density. Thus even with our lower limit on the density (Section 5), shocks can produce all the Ly we observe.
Would these shocks be radiative? For our lower limit on the density, shocks become radiative on a timescale of years, which is comparable to the dynamical timescale. Thus it seems likely that at least some fraction of the shocks will be radiative.
Thus shocks are probably present, and can easily produce the Ly emission we observe. A number of factors could, however, suppress the Ly emission from shocks.
-
1.
The high optical depth in Ly may have caused us to overestimate the velocity dispersion of the Ly nebula. The emission from shocks is a strong function of their velocity: shocks emit two orders of magnitude less Ly per unit area than our fiducial model.
-
2.
The density of the Ly nebula may be close to our lower limit of , in which case the Ly emission, after the probable self absorption losses, could be an order of magnitude below the observed Ly surface brightness.
-
3.
The Ly nebula could consist of small dense ‘bullets’ of neutral gas, moving at high speeds through a hot, highly ionized, low density medium. The bowshocks in the ionized medium would not be radiative, while the reverse shocks within the ‘bullets’ would be slow, and hence have low surface brightnesses (as well as having a small area).
5.2.2 The Energy Source
If the shock model is correct, the bulk gas motions explain the Ly luminosity. What then could be the energy source for the bulk gas motions?
If we divide the total kinetic energy of the nebula (assuming a mass of ) by the Ly luminosity, we can derive an upper limit on the damping time, which is years. This is less than the dynamical timescale and stellar age of B1, suggesting that continued energy input is required. Note that the Ly we observe may only be a small fraction of the Ly emitted, which in turn will only be a small fraction (%) of the total energy dissipation in the shocks. On the other hand, the gas mass may be greater than we are assuming.
If continued energy input is required, what can the source be? Perhaps the most natural energy source is the gravitational potential energy of B1. If we assume that B1 has a total mass of , then the gravitational potential energy released in its formation would be ergs, which is more than sufficient to power the Ly luminosity for the dynamical timescale. Such a mass for B1 would imply virial velocities in the Ly nebula of , which are comparable to the bulk gas motions observed. This energy could be released by the merger of B1a and B1b, or by a continuing mass infall rate of . Haiman, Spaans & Quataert (2000) point out that chemically primordial gas at a temperature of K has few cooling mechanisms other than Ly emission. Thus if most of the gas around B1 is primordial, a Ly luminosity comparable to the gravitational binding energy (Section 5.2.2) of the system must be radiated.
Alternatively, Taniguchi & Shioya (2000) suggest that galactic superwinds driven by a starburst could power extended Ly nebulae. This would naturally explain the similarity between the dynamical timescale and the inferred age of the stellar population in B1a and B1b. The maximum plausible amount of energy which star formation can inject into the intergalactic medium is (eg. Bower et al., 2000). As B1a and B1b have a combined stellar mass of , the total energy liberated would be ergs, which could in principle drive the observed Ly luminosity for years.
The Ly emission in high redshift radio galaxies has sometimes been ascribed to mechanical energy deposition by a radio jet (eg. Bicknell et al., 2000). Could such a jet be present in B1? We do not detect any radio emission from B1 (Francis et al., 1996). Our upper limit of 0.23 mJy at 2.4 GHz corresponds to a luminosity limit of at rest-frame 1.4 GHz (assuming a typical radio galaxy radio spectrum of the form ). Typical ratios of the total jet mechanical power to the monochromatic radio flux at 1.4 GHz are — (Bicknell et al., 1998). Thus we can place an upper limit of on the energy injection from a radio jet. This is sufficient to power the observed Ly luminosity only if % of the mechanical energy is converted into observable Ly emission, which seems implausible. Deeper radio observations should test this hypothesis.
5.3 Other Models
If the shock emission is suppressed, is there an alternative mechanism capable of producing the Ly emission?
Stellar ionisation (by hot young stars) is incapable of producing the observed C IV emission. Photoionisation by the UV continuum radiation from a QSO can, however, produce both the Ly and C IV, as discussed by Francis, Woodgate & Danks (1997). We do not see strong UV continuum emission from any component of B1, so such an AGN would have to be concealed from our sight-line. Chapman et al. (2000) detected strong sub-mm emission from a Ly blob at , suggesting that a dusty AGN or starburst was present, but we have no evidence for such a source in B1.
Extended emission-line nebulosities are associated with many low redshift cooling flow clusters, such as NGC 1275. As all high-redshift Ly blobs seem to lie in cluster environments, could the Ly luminosity be associated with a cooling flow (eg. Fabian et al., 1986)?
Steidel et al. (2000) suggest that Ly nebulae are caused by gas cooling from higher temperatures, in such a cooling flow. If each cooling hydrogen atom produces one Ly photon, however, we require that of hydrogen be cooling onto B1. This would build the observed baryonic mass of B1 in years. This is far smaller than either the dynamical time or the age of the stellar population in B1a and B1b, so the simple cooling model seems implausible.
Note that the nebular emission-line luminosities of low redshift cooling-flow clusters are also orders of magnitude too great to be explained by this simple recombination mechanism (eg. Voit & Donahue, 1997). The cause of this discrepancy is still controversial even at low redshifts.
On purely energetic grounds, could the Ly luminosity be powered by the thermal energy in the nebula? If we divide the thermal energy of of hydrogen at K by the observed Ly luminosity, we get a timescale of years: shorter than the dynamical timescale or the stellar age. may however be an underestimate of the true gaseous mass of the Ly nebula, particularly if the neutral gas we observe is immersed in a much more massive cloud of hot, highly ionised X-ray emitting gas.
6 Conclusions
So what is B1? On balance, we conclude that B1a and B1b are probably young elliptical galaxies, perhaps analogues of EA galaxies today. Both their red colors and compact sizes are naturally explained by this model. An extremely dusty starburst in the central regions of a disk galaxy can however, with some fine tuning, reproduce the colors and sizes. The bluer colors of the centres of both components, and the Ly emission from the core of B1b are, however, arguments against the presence of large amounts of dust in these systems. Near-IR H-band spectroscopy on an 8m-class telescope should resolve this ambiguity, by detecting the spectral signatures of a Balmer/4000Å break. B1c appears to be a region of relatively unobscured star formation, perhaps induced by the interaction of B1a and B1b.
If B1a and B1b are elliptical galaxies, their surface brightnesses are an order of magnitude greater than those that the Kormendy relation would predict for galaxies of this size, and they show strong radial color gradients, with blue cores. The very existence of massive elliptical galaxies at this redshift, if confirmed, is interesting (eg. Treu & Stiavelli, 1999, and references therein). These galaxies would give us a chance to study young elliptical galaxies for the first time. Our observations would pose several puzzles:
-
•
Why is the surface brightness of these galaxies so great? Is this simply due to passive evolution?
-
•
Why do both galaxies show strong, but very similar color gradients?
-
•
Is the remarkable similarity and proximity of the two galaxies coincidental, or is it telling us something about how cluster elliptical galaxies form?
-
•
If these galaxies are so massive and red at , what would they have looked like at when they were forming?
The nature of the Ly nebula is less well constrained by our observations. The nebula could be excited by photoionization from an AGN, by whatever powers low redshift cooling flow nebulae, or by fast shocks powered by either superwinds or gravitational potential energy. Spatially resolved spectroscopy of other emission lines will help discriminate between these models.
References
- Adelberger & Steidel (2000) Adelberger, K.L. & Steidel, C.C. 2000, ApJ, 544, 218
- Bertin & Arnouts (1996) Bertin, E. & Arnouts, S. 1996, A&AS, 117, 393
- Bicknell et al. (1998) Bicknell, G.V., Dopita, M.A., Tsvetanov, Z.I., & Sutherland, R.S. 1998, ApJ, 495, 680
- Bicknell et al. (2000) Bicknell, G.V., Sutherland, R.S., van Breughel, W.J.M., Dopita, M.A., Dey, A. & Miley, G.K. 2000, ApJ, submitted.
- Binette et al. (2000) Binette, L., Wang, J.C.L., Zuo, L., & Magris, C.G. 1993, AJ, 105, 797
- Binney & Merrifield (1998) Binney, J. & Merrifield, M. 1998, Galactic Astronomy, Princeton University Press, (Princeton NJ)
- Bland-Hawthorn & Heath-Jones (1998) Bland-Hawthorn, J. & Heath-Jones, D. 1998, PASA, 15, 44
- Bower et al. (2000) Bower, R.G., Benson, A.J., Baugh, C.M., Cole, S., Frenk, C.S. & Lacey, C.G. 2000, MNRAS, submitted (astro-ph/0006109)
- Bruzual & Charlot (1993) Bruzual, A. G., & Charlot, S. 1993, ApJ, 405, 538
- Calzetti, Kinney & Storchi-Bergmann (1994) Calzetti, D., Kinney, A. L., & Storchi-Bergmann, T. 1994, ApJ, 429, 582
- Cardelli, Clayton & Mathis (1989) Cardelli, J.A., Clayton, G.C. & Mathis, J.S. 1989, ApJ, 345, 245
- Carilli et al. (1997) Carilli, C.L., Röttgering, H.J.A., van Ojik, R., Miley, G.K. & van Breughel, W.J.M. 1997, ApJS, 109, 1
- Carter & Meadows (1995) Carter, B. S., & Meadows, V. S. 1995, MNRAS, 276, 734
- Chapman et al. (2000) Chapman, S.C., Lewis, G.F., Scott, D., Richards, E., Borys, C., Steidel, C.C., Adelberger, K.L. & Shapley, A.E. 2000, ApJ in press (astro-ph/0010101)
- Chen, Lanzetta & Pascarelle (1999) Chen, H.-W., Lanzetta, K.M., & Pascarelle, S. 1999, Nature, 398, 586
- Cimatti et al. (1999) Cimatti, A., Daddi, E., di Serego Alighieri, S., Pozzetti, L., Mannucci, F., Renzini, A., Oliva, E., Zamorani, G., Andreani, P. & Röttgering, H.J.A. 1999, A&A, 352, 45
- Djorgovski & Davis (1987) Djorgovski, S. & Davis, M. 1987, ApJ, 313, 59
- Dopita & Sutherland (1996) Dopita, M.A. & Sutherland, R.S. 1996, ApJS, 102, 161
- Dunlop et al. (1996) Dunlop, J., Peacock, J.A., Spinrad, H.J., Dey, A., Jiminez, R., Stern, D. & Windhorst, R. 1996, Nature, 381, 581
- Eales et al. (1993) Eales, S., Rawlings, S., Puxley, P., Rocca-Volmerange, B. & Kuntz, K. 1993, Nature, 363, 140
- Fabian et al. (1986) Fabian, A.C., Arnaud, K.A., Nulsen, P.E.J., & Mushotsky, R.F.1986, ApJ, 305, 9
- Francis et al. (1991) Francis, P.J., Hewett, P.C., Foltz, C.B., Chaffee, F.H., Weymann, R.J. & Morris, S.L. 1991, ApJ, 373, 465
- Francis & Hewett (1993) Francis, P. J., & Hewett, P. C. 1993, AJ, 105, 1633
- Francis et al. (1996) Francis, P. J., et al. 1996, ApJ, 457, 490
- Francis, Whiting and Webster (2000) Francis, P.J., Whiting, M.T.& Webster, R.L. 2000, PASA, 17, 56
- Francis, Wilson & Woodgate (2000) Francis, P.J., Wilson, G.M. & Woodgate, B.E. 2000, PASA in press.
- Francis, Woodgate & Danks (1997) Francis, P. J., Woodgate, B. E. & Danks, A. C., 1997, ApJ, 482, 25
- Friaça & Terlevich (1998) Friaça, A.C.S. & Terlevich, R.J. 1998, MNRAS, 298, 399
- Fruchter & Hook (1998) Fruchter, A.S. & Hook, R.N. 1998, PASP, submitted (astro-ph/9808087)
- Gardner et al. (1998) Gardner, J.P. et al. 1998, ApJ, 492, L99
- Giavalisco, Steidel & Macchetto (1996) Giavalisco, M., STeidel, C.C. & Macchetto, F.D. 1996, ApJ, 470, 189
- Haiman, Spaans & Quataert (2000) Haiman, Z., Spaans, M. & Quataert, E. 2000, ApJ, 537, L5
- Hoessel, Oegerle & Schneider (1987) Hoessel, J.G., Oegerle, W.R. & Schneider, D.P. 1994, AJ, 94, 1111
- Hu, Cowie & McMahon (1998) Hu, E.M., Cowie, L. L., & McMahon, R. G. 1998, ApJ, 502, L99
- Hu & Ridgway (1994) Hu, E.M., & Ridgway, S. 1994, AJ, 107, 156
- Hughes et al. (1998) Hughes, D. et al. 1998, Nature, 394, 241
- Ivison et al. (2000) Ivison, R.J., Dunlop, J.S., Smail, I., Dey, A., Liu, M.C. & Graham, J.R. 2000, ApJ, in press (astro-ph/0005234)
- Jiminez et al. (1999) Jiminez, R., Friaça, A.C.S., Dunlop, J.S., Terlevich, R.J., Peacock, J.A. & Nolan, L.A. 1999, MNRAS, 305, L16
- Keel et al. (1999) Keel, W.C., Cohen, S.H., Windhorst, R.A. & Waddington, I. 1999, AJ, 118, 2547
- Kennicutt (1983) Kennicutt, R.C. 1983, ApJ, 272, 54
- Kennicutt (1992) Kennicutt, R.C. 1992, ApJ, 388, 310
- Kent (1984) Kent, S.M, 1984, ApJS,56, 105
- Kobulnicky & Koo (2000) Kobulnicky, H.A. & Koo, D. 2000, ApJ, in press (astro-ph/0008242)
- Kormendy (1977) Kormendy, J. 1977, ApJ, 214, 359
- Kudritzki et al. (2000) Kudritzki, R.-P., Méndez, R.P., Feldmeier, J.J., Ciardullo, R., Jacoby, G.H., Freeman, K.C., Arnaboldi, M., Capaccioli, M., Gerhard, O. & Ford, H.C. 2000, ApJ, in press (astro-ph/0001156)
- Lidman, Cuby & Vanzi (2000) Lidman, C., Cuby, J.-G. & Vanzi, L. 2000, “SOFI users manual”, Version 1.3 (Garching: ESO)
- Lindler (1998) Lindler, D. 1998, CALSTIS Reference Guide Version 5.1), http://hires.gsfc.nasa.gov/stis/software/software.html
- Lindler (2000) Lindler, D. 2000, personal communication.
- Lowenthal et al. (1991) Lowenthal, J. D., Hogan, C. J., Green, R. F., Caulet, A., Woodgate, B. E., Brown, L., & Foltz, C. B. 1991, ApJ, 377, L73
- Lowenthal et al. (1997) Lowenthal, J.D., Hogan, C.J., Green, R.F., Caulet, A., Woodgate, B.E., Brown, L. & Foltz, C.B. 1991, ApJ, 377, L73
- McCarthy (1993) McCarthy, P.J. 1993, ARA&A, 31, 639
- McLeod (1997) Mcleod, B.A. 1997, in “HST Calibration Workshop”, eds Casertano, S., Jedrzejewski, R., Keyes, C.D. & Stevens, M. (STScI, Baltimore)
- Moriondo, Cimatti & Daddi (2000) Moriondo, G., Cimatti, A. & Daddi, E. 2000, A&A, in press (astro-ph/0010335)
- Muller et al. (1998) Muller, G.P., Reed, R., Armandroff, T., Boroson, T.A. & Jacoby, G.H. 1998, Proc SPIE, 3355, 577
- Osterbrock & Martel (1993) Osterbrock, D. E. & Martel, A. 1993, ApJ, 414, 552
- Pascarelle et al. (1996) Pascarelle, S.M., Windhorst, R.A., Driver, S.M. & Ostrander, E.J. 1996, ApJ, 456, L21
- Pascarelle, Windhorst & Keel (1998) Pascarelle, S.M., Windhorst, R.A. & Keel, W.C. 1998, AJ, 116, 2659
- Persson et al. (1998) Persson, S.E., Murphy, D.C., Krzeminski, W., Roth, M. & Rieke, M.J. 1998, AJ, 116, 2475
- Pentericci et al. (1997) Pentericci, L., Röttgering, H.J.A., Miley, G.K., Carilli, C.L. & McCarthy, P. 1997, A&A, 326, 580
- Roche, Lowenthal & Woodgate (2000) Roche, N., Lowenthal, J. & Woodgate, B. 2000, ApJ, submitted (astro-ph/0002160)
- Schlegel, Finkbeiner & Davis (1998) Schlegel, D.J., Finkbeiner, D.P. & David, M. 1998, ApJ, 500, 525
- Smail et al. (1999) Smail, I., Ivison, R.J., Kneib, J.-P., Cowie, L.L., Blain, A.W., Barger, A.J., Owen, F.N., & Morrison, G. 1999, MNRAS in press (astro-ph/9905246)
- Soifer et al. (1999) Soifer, B.T., Matthews, K., Neugebauer, G., Armus, L. Cohen, J.G. & Persson, S.E. 1999, AJ, 118, 2065
- Steidel et al. (1996) Steidel, C. C., Giavalisco, M., Pettini, M., Dickinson, M. & Adelberger, K. L. 1996, ApJ, 462, L17
- Steidel et al. (2000) Steidel, C.C., Adelberger, K.L., Shapley, A.E., Pettini, M. Dickinson, M. & Giavalisco, G. 2000, ApJ, 532, 170
- Taniguchi & Shioya (2000) Taniguchi, Y. & Shioya, Y. 2000, ApJ, 532, L13
- Teplitz et al. (2000) Teplitz, H.I. et al. 2000, ApJ, 533, 65
- Thompson et al. (1999) Thompson, D. et al. 1999, ApJ, 523, 100
- Thompson et al. (1998) Thompson, R.I., Rieke, M., Schneider, G., Hines, D.C. & Corbin, M.R. 1998, ApJ, 492, L95
- Trauger et al. (1994) Trauger, J.T. et al. ApJ, 435, 3
- Treu & Stiavelli (1999) Treu, T. & Stiavelli, M. 1999, ApJ, 524, 27
- Voges et al. (1999) Voges, W. et al. 1999, A&A, 349, 389
- Voit & Donahue (1997) Voit, G.M. & Donahue, M. 1997, ApJ, 486, 242
- Woodgate et al. (1998) Woodgate, B.E. et al. 1998, PASP, 110, 1183
- Wynne & Worswick (1988) Wynne, L.G. & Worswick, S.P. 1988, The Observatory, 108, 161