The lives and deaths of star clusters near the Galactic center
Abstract
We study the evolution and observability of young, compact star clusters near the Galactic center, such as the Arches and Quintuplet systems. The clusters are modeled by integrating the equations of motion of all stars while accounting for the internal evolution of stars and binaries, as well as the effect of the Galactic tidal field. We find that clusters within 150 pc of the Galactic center dissolve within Myr, but their projected densities drop below the background density in the direction of the Galactic center within only a few Myr, effectively making these clusters undetectable after that time. Detailed observations of the Arches cluster, taken at face value, suggest that its mass function is unusually flat and that the cluster contains an overabundance of stars more massive than 20 . Our dynamical analysis, however, shows that the observed characteristics of the Arches cluster are consistent with a perfectly normal initial mass function. The observed anomalies are then caused by a combination of observational selection effects and the dynamical evolution of the cluster. We calibrate the current parameters of the Arches cluster using a normal initial mass function and conclude that the cluster is more massive than 40 000 , has a half mass radius of about 0.35 pc and is located between 50 and 90 pc from the Galactic center.
⋆ SPZ is a Hubble Fellow
1 Introduction
A number of young, dense star clusters have been observed within the inner few hundred parsecs of the Galactic center. Best known are the Arches cluster (Object 17, Nagata et al. 1995) and the Quintuplet cluster (AFGL 2004, Nagata et al. 1990; Okuda et al. 1990). However, it is likely that others exist, as these clusters lie behind thick layers of obscuring material (Portegies Zwart et al. 2001a). Most are expected to be invisible at optical wavelengths, but should be readily detectable in the infrared (Vrba et al. 2000) or in the 2MASS survey Dutra & Bica 2000).
The Arches and the Quintuplet clusters are the Galactic counterparts of R 136, the central star cluster in NGC 2070: the 30 Doradus region in the Large Magellanic Cloud (Massey & Hunter 1998). The structural parameters of these clusters—masses, radii, and density profiles— are quite similar, as are their ages. R 136, however, is located far from the perturbing influence of the Galaxy and the tidal effect of the LMC is negligible (Portegies Zwart et al. 1999). The Arches and the Quintuplet clusters, on the other hand, lie at projected distances of pc of the Galactic center, and their evolution is strongly affected by the Galactic tidal field.
We study the evolution of clusters like Arches and Quintuplet using a fully self-consistent star-cluster model in which the dynamics of stars are followed by direct N-body integration and the evolution of individual stars and binaries are followed using a stellar and binary evolution program. The importance of the tidal field of the Galaxy is studied by repeating each model calculations at several distances from the Galactic center. We compare the results of our calculations with detailed observations of the Arches cluster and with model calculations performed by others.
We find that, while all our models start with a mass function comparable to that in the solar neighborhood, to an observer the current mass function may well appear to be much flatter. The unusually flat mass functions observed in both the Arches and the Quintuplet clusters may therefore in part be attributed to a combination of observational selection effect, the age of the cluster and the location at which the measurements were taken.
The star clusters studied in this paper experience core collapse within a few million years. During this phase and at later time many stars experience collisions with other stars. The clusters finally dissolve in the tidal field of the Galaxy. The disruption of the cluster is driven mostly by tidal stripping and two-body relaxation. Stellar evolution plays only a minor role in the disruption of the clusters.
The clusters expand as they age, causing their surface densities to decline. Clusters older than about 5 Myr often have surface densities below that of their surroundings, making these clusters virtually undetectable. Since the modeled clusters disrupt at ages greater than 5 Myr, we estimate that there may be many clusters like the Arches and Quintuplet, but only the youngest are observable. This suggests that the formation of Arches and Quintuplet-like clusters may be a continuous process. We cannot exclude, however, that these clusters were formed in a recent burst of star formation and that older counterparts do not exist.
The numerical methods and selection of the initial conditions are discussed in Sec. 2. The results are presented in Sec. 3 and discussed in Sec. 4. We summarize and conclude in Sec. 5.
2 The model
The N-body portion of the simulations is carried out using the kira integrator operating within the “Starlab” software environment. Time integration of stellar orbits is accomplished using a fourth-order Hermite scheme (Makino & Aarseth 1992). Kira also incorporates block time steps (McMillan 1986ab; Makino 1991) special treatment of close two-body and multiple encounters of arbitrary complexity, and a robust treatment of stellar and binary evolution and stellar collisions. The special-purpose GRAPE-4 (Makino et al. 1997) system is used to accelerate the computation of gravitational forces between stars. The treatment of stellar mass loss is described by Portegies Zwart et al. (1998). A concise description of the Starlab environment is given by Portegies Zwart et al. (2001b, paper IV); additional information is available at http://manybody.org.
Evolution of stars and binaries is handled using the prescription given by Portegies Zwart & Verbunt (1996, Sec. 2.1). However, some changes are made to the treatment of main-sequence mass loss in massive stars (see Portegies Zwart et al. 1999, hereafter paper III), and we incorporate a more extended prescription for stellar collisions, as described by Portegies Zwart, Hut & Verbunt (1997).
The system of units used internally in the -body models is defined by , where is the initial internal energy of the stellar system, is the total mass in stars and is the gravitational constant (Heggie & Mathieu 1986).
The time required for a star to cross the clusters’ virial radius is
| (1) |
For the runs considered here, the N-body and physical length scales are connected by the requirement that initially the star cluster is in virial equilibrium and exactly fills its zero-velocity surface in the Galactic tidal field (see Sec. 2.2 below). Once the cluster mass and distance to the Galactic center are known, the clusters’ size scale is determined. The half mass crossing time () can then be expressed in convenient physical units as
| (2) |
For most density profiles the half-mass radius is slightly (%) smaller than .
The half-mass relaxation time is calculated as (Spitzer 1987):
| (3) |
Here is the coulomb logarithm; is a scaling factor introduced to model the effects of the cut-off in the long range Coulomb logarithm (see Giersz & Heggie 1996; 1994). We will also use the relaxation time at the tidal radius , for which we use Eq. 3 but with the tidal radius substituted for .
2.1 Selection of initial conditions
The two clusters on which we concentrate here, the Arches and the Quintuplet, lie in projection within pc of the Galactic center. Table 1 lists some observed parameters of these clusters, along with some other clusters (and cluster candidates) having comparable characteristics. All have masses of , are very compact, pc, and are only a few million years old. However, of the systems listed, only the Arches and Quintuplet are significantly perturbed by external tidal fields.
| Name | ref | Age | M | |||||
|---|---|---|---|---|---|---|---|---|
| [Myr] | [ ] | ——— [pc] ——— | [ /pc3] | [Myr] | ||||
| R 136 | a | 2–4 | 21–79 | LMC | 0.4–1.5 | 70 | ||
| Arches | b | 1–2 | 12–50 | 30 | 1 | 0.2 | 3.6–15 | 12 |
| Quintuplet | c | 3–5 | 10–16 | 35 | 1 | 0.14–0.31 | 12 | |
| NGC 3603 | d | 2–3 | 3–13 | few k | 4–5 | 0.23 | 0.59–2.6 | 44 |
| W43 (=G30.8-0.2) | e | ?⋆ | ||||||
| Norma | f | ?∘ | few k | |||||
| nameless | g | ?∙ | 12-15k | 0.2–0.4 | 0.45–4.5 | |||
References: a) Brandl et al. (1996); Campbell et al. (1992); Massey & Hunter (1998). b) Figer et al. (1999a); c) Glass, Catchpole & Whitelock (1987); Nagata et al. (1990); Figer, Mclean & Morris (1999b). d) Brandl (1999) e) Blum, Daminelli & Conti (1999) f) Moffat (1976) g) Vrba et al. (2000)
⋆ Contains approximately 100 spectral type O and WN stars but further information is not available.
∘ Contains a dozen embedded early-type stars surrounding the M3 Ia star HD 143183.
∙ Contains at least 13 early type O stars, the cluster does not have a name but is located near the soft gamma-ray repeater SGR 1900+14 (also SGR 1806-20 may be associated with a young and compact star cluster [van Kerkwijk et al. 1995; Kulkarni et al. 1995]).
2.2 The tidal field near the Galactic center
A star cluster embedded in the Galactic tidal field is not spherically symmetric. Rather, it is flattened and the stellar velocity distribution is anisotropic, particularly in the outer regions. The initial models which best describe such a cluster are the anisotropic density profiles described by Heggie & Ramamani (1995). As in the usual spherically symmetric King (1966) models, the density profile is described by the dimensionless parameter . Higher values of indicate a more centrally concentrated cluster (see the illustration in Fig. 1).
Following Heggie & Ramamani, we model the tidal potential by the quadrupole formula
| (4) |
The cluster is taken to move on a circular orbit around the Galactic center. The -axis in the rotating frame of reference centered on the cluster always points toward the Galactic center; the -axis is perpendicular to the orbital plane. The quantities and are conveniently expressed in terms of the kinematic Oort constants and (Oort 1927) and the local Galactic density as:
| (5) |
Loosely speaking, we can think of as determining the overall strength of the tidal field, while the ratio determines its geometry.
The Oort constants and are defined as
| (6) |
where is the circular rotational velocity:
| (7) |
Taking the mass of the Galaxy within the cluster’s orbit at distance ( pc) from the Galactic center to be (Mezger et al. 1999)
| (8) |
we find
| (9) |
and hence
| (10) |
Table 2 lists these parameters at selected Galactocentric distances.
| [pc] | [/pc3] | [] | [] | [] |
|---|---|---|---|---|
| Sun | 0.11 | |||
| 34 | 711 | 193 | 2.55 | -3.12 |
| 90 | 123 | 212 | 1.06 | -1.30 |
| 150 | 49 | 224 | 0.67 | -0.82 |
2.3 Initial cluster structure
We adopt initial models comparable to those observed for the Arches and the Quintuplet clusters. By varying the density profile and the distance to the Galactic center we study how the cluster evolution depends on the initial conditions.
Our calculations start with 12k (12288) stars at zero age. We assign stellar masses in the range from the mass function suggested for the Solar neighborhood by Scalo (1986). The median mass of this mass function is about 0.3 ; the mean mass is . For models with 12k stars this results in a total cluster mass of . We adopt a mass function which is applicable to the Solar neighborhood rather than the flatter mass spectrum suggested by observations (Figer et al., 1999a) in order to determine whether the flat mass spectrum can be attributed to cluster dynamical evolution. Initially all stars are single, although binaries do form via three-body encounters, in which one star carries away the excess energy and angular momentum necessary for two other stars to become bound.
We adopt three standard distances from the Galactic center: 34 pc, 90 pc and 150 pc. The shape of the zero-velocity surface in the tidal field of the Galaxy only depends on , which is independent of . However, this does not mean that the models can be scaled with respect to distance from the Galactic center using the relaxation time alone. The time scale on which the stars in the cluster evolve depends on the size of the cluster via Eq. 2; when the cluster is located further from the Galactic center the crossing time increases and the stars evolve relatively more quickly compared to the dynamical evolution of the cluster. This results in a more active mass loss by stellar evolution for clusters which are farther from the Galactic center.
Initial density profiles and velocity dispersions are taken from Heggie & Ramamani (1995) with , and , for a total of 9 models. At birth the clusters are in virial equilibrium and exactly fill their critical zero-velocity surfaces (“Roche lobes”) in the Galactic tidal field. Tab. 3 presents a summary of the adopted initial models. Figure 1 indicates the shape and structure of models with =1, 4 and 7 at pc; models closer to the Galactic center are identical in shape, but the scale is different. The zero-velocity surfaces of the various models are represented as ellipses.
We test the reproducibility of our calculations by performing several calculations per set of selected initial conditions. Each calculation was performed twice with a different random seed. In addition, we performed a set of calculations without stellar evolution for models with , 4 and 7. These same initial realizations were rerun with stellar evolution switched on, for pc, 90 pc and 150 pc. In total, 30 simulations were performed.
| Model | ||||||||||||
|---|---|---|---|---|---|---|---|---|---|---|---|---|
| [pc] | — [Myr] — | [Kyr] | ——— [pc] ——— | — [Myr] — | [Myr-1] | |||||||
| R34W1 | 34 | 1 | 53 | 5.5 | 43 | 0.12 | 0.20 | 0.76 | 5 | 1.9 | 7.4 | 0.68 |
| R34W4 | 34 | 4 | 53 | 3.2 | 27 | 0.05 | 0.14 | 0.76 | 8 | 1.2 | 12.7 | 0.63 |
| R34W7 | 34 | 7 | 53 | 0.36 | 9 | 0.018 | 0.077 | 0.80 | 24 | 0.4 | 12.0 | 2.00 |
| R90W1 | 90 | 1 | 134 | 14.6 | 105 | 0.19 | 0.36 | 1.4 | 7 | 1.9 | 25.6 | 0.27 |
| R90W4 | 90 | 4 | 134 | 8.1 | 68 | 0.09 | 0.26 | 1.4 | 15 | 1.2 | 32.6 | 4.02 |
| R90W7 | 90 | 7 | 134 | 1.0 | 25 | 0.032 | 0.14 | 1.4 | 14 | 1.4 | 32.4 | 32.4 |
| R150W1 | 150 | 1 | 218 | 23.6 | 169 | 0.30 | 0.50 | 1.9 | 5 | 2.0 | 45.8 | 1.94 |
| R150W4 | 150 | 4 | 218 | 13 | 110 | 0.14 | 0.36 | 1.9 | 8 | 2.0 | 53.4 | 4.08 |
| R150W7 | 150 | 7 | 218 | 4.5 | 40 | 0.044 | 0.19 | 2.0 | 14 | 0.4 | 55.0 | 12.2 |

Stars are removed from the N-body system when their distance from the center of the cluster exceeds 3. In N-body calculations it is not always trivial to determine the moment the cluster dissolves, as a few stars may remain bound for an extended period of time (Portegies Zwart et al 1998). In our models we identify the cluster’s disruption as the moment when no stars lie within the zero velocity surface. Typically, a few hundred stars remain in the N-body system (within ) at this time.
3 Results
We first discuss the global parameters of all models. Later (in Secs. 3.5 and 3.6) we will concentrate on a few representative models and compare these with the observed clusters.
3.1 The evolution of the cluster
Figure 2(a) shows the mass evolution of the models listed in Table 3. Not surprisingly, clusters located at larger distances from the Galactic center tend to live longer than those closer to the Galactic center.
Figure 2(b) gives the evolution of the number of stars in several of our models with at various distances from the Galactic center and compares the results with a model in which stellar evolution was not taken into account and in which stars were not allowed to collide. All the calculations presented in this figure were started with identical initial conditions. The only difference between the various runs is the distance from the Galactic center (varying from 34 to 150 pc) and whether stellar evolution is included in the calculation. In this figure, time is scaled with respect to each model’s initial relaxation time, i.e.:
| (13) |
The various lines in Figure 2 do not overlap perfectly, mainly due to stochastic differences in the moments when binaries formed and interacted. The small deviations from the model in which stellar evolution was not taken into account indicate that stellar evolution in these models in unimportant. If stellar evolution were important, clusters at greater distances from the Galactic center should dissolve more rapidly. However, we see the opposite trend: clusters farther from the Galactic center tend to dissolve slightly more slowly; the model without stellar evolution dissolves fastest. We have no ready explanation for this trend. Note that for the models with stellar evolution this trend may be attributed in part to collisions, as they tend to heat the cluster; so clusters with higher collision rates (closer to the Galactic center) would dissolve more quickly in terms of their initial relaxation time. Collisional heating also causes the cluster to become less compact, again reducing the cluster lifetime.
Alternatively the trend of longer lifetime at greater Galactocentric distance may also be explainable in terms of the interplay between stellar evolution, binary formation and stellar collisions. These possibilities require more detailed study, which is beyond the scope of this paper; however, work is in progress to address this point. We emphasize that, although the trend looks like a subtlety, it may play an important role in the dynamical evolution of compact star clusters.
(a) (b)
(b)
Figure 3 shows the time variation of the relaxation time for the models at 34 pc and 90 pc from the Galactic center. Note that the relaxation time measured some time after zero age bears little information about the clusters’ initial conditions. The behavior of the half-mass relaxation time is qualitatively similar to that found in less compact clusters at greater distances (6–12 kpc) from the Galactic center (Portegies Zwart et al. 2001b)—it first rises by a factor of a few as the cluster expands, then slowly decreases as the cluster loses mass.

Figure 4(a) shows the evolution of the mean densities within the half mass radius in models R150W1, R90W4 and R34W7. The initial half mass densities for these models were very different, ranging about three orders of magnitude. At later times the differences in the half mass densities become much smaller; after five million years the difference has decreased by about a factor of 5.
As in Fig. 2, Figure 4(b) also shows the densities of the models as functions of time scaled to the initial relaxation time (see Portegies Zwart et al 2001a and Baumgardt 2001). The trend visible in Fig. 2 is somewhat obscured due to random fluctuations in the density.
(a)  (b)
(b) 
Figure 5 shows the evolution of the core radius, selected Lagrangian radii, and the Jacobi radius , for model R90W4. Core collapse occurs within Myr followed by a gradual overall expansion of the cluster. Similar behavior is evident in the isolated clusters considered by Portegies Zwart et al. (1999). The post-collapse expansion stops after a few million years, by which time the relaxation time has reached its maximum value (see Fig. 3). Subsequently, the Lagrangian radii decrease as the Jacobi radius shrinks and the cluster dissolves.

3.2 Evolution of the binding energy
Figure 6 shows the evolution of the binding energy (, in scaled N-body units) for models R90W4 and R90W7, which are selected for their similar lifetimes. (Some deviations between the solid and the dotted lines are a result of our definition of a binary. Here we consider a binary to be a pair of bound stars for which the internal forces are a hundred times higher than those due to the nearest neighbor.) Initially, each cluster has (see Sec. 2), but due to escapers, binary activity, stellar mass loss, mergers, supernovae, etc., the total energy changes. A cluster ceases to exist when its binding energy becomes positive. The two clusters exhibit quite similar global evolution. Model R90W4 shows an initial “plateau” of a few Myr during which mass segregation occurs, driving the cluster into the core collapse phase (see Fig. 5). For model R90W7 this phase is hardly noticeable as the cluster experiences several strong encounters and a few collisions early in its evolution.
During the first deep core collapse the binding energy fluctuates rapidly because binaries frequently harden and single stars are ejected following three-body encounters. The first collisions happen during this phase (see in Fig. 6) and in both models mass transfer occurs in a dynamically formed binary, giving rise to an excursion in the binding energy (see the dotted line in Fig. 6). Core collapse is followed by the ejection of a hard binary (arrows in Fig. 6).
After the first collapse of the core the binding energies of both clusters decrease steadily with some strong fluctuations caused by close two- and three-body encounters (triangles in Fig. 6), high-velocity escapers (arrows), stellar collisions (), mass transfer in close binaries and supernovae ().
Model R90W7 experiences much more binary activity than model R90W4. This can be seen from the many departures of the dotted line in Fig. 6 from the solid curve. Such excursions are the result of binary activity, such as mass transfer. A stable phase of mass transfer generally results in an increase in the binding energy of the binary. Such binaries first become very hard as the orbital period decreases, then soften when the mass of the donor drops below that of the accreting star. One example of this is clearly visible in panel (b) of Fig. 6, around Myr. The phase of mass transfer stops after about 3 Myr, indicating that it is a case A (Kippenhahn & Weigert 1967), i.e. stable on a nuclear time scale (see also Portegies Zwart et al. 2001b). This episode stops when the donor leaves the main sequence, becomes an envelope-depleted helium burning star and finally explodes in a supernova (filled star). The mass loss in the supernova, forming a black hole, causes the binary to be ejected from the cluster (up pointed arrow).
The spikes to lower binding energy in both models R90W4 and R90W7 are the result of stars which receive a high velocity following a strong encounter. Such a high-energy encounter may decrease the binding energy of the entire cluster for as long as the star is considered a cluster member (within 3 from the cluster center). Model R90W7 produces many more high-velocity escapers than model R90W4, consistent with the greater dynamical activity within the more compact cluster.
(a)  (b)
(b) 
3.3 Evolution of the total luminosity
The total luminosities of the model clusters decrease with time as the clusters dissolve in the Galactic tidal field and the most massive stars evolve off the main sequence and become dark remnants.
Figure 7 presents the integrated visual luminosity for the models R90W4 (see also Fig. 6a) and R150W4 (both models had identical initial stellar masses [in ], positions and velocities [in scaled N-body units]). Initially the luminosity greatly exceeds , then drops steadily by more than two orders of magnitude as the cluster ages. After about 4 Myr the luminosity suddenly drops due to the explosion of the most massive stars (for model R150W4) or because a few massive stars escape from the cluster as the binary in which they reside is ejected (for model R90W4, see also Fig. 6).
Occasionally the luminosity again exceeds as a runaway collision product leaves the main sequence and becomes a Luminous Blue Variable or a Wolf-Rayet star. (Paper III discusses the collision rate in models with comparable initial conditions. A summary is given in Sec. 4.1.) In model R90W4 (Fig. 7a) this happens around 9.5 Myr and 23–25 Myr and for model R150W4 (Fig. 7b) near Myr and 16–22 Myr. In these episodes the total luminosity of the entire star cluster is dominated by a single star. This episode suddenly stops when the star explodes or escapes from the cluster. The regular rises and sudden drops in luminosity (for example near Myr and Myr in Fig. 7b) are caused by single stars which ascend the giant branch and then explode in supernovae (open and filled stars) or form a white dwarf (circles). The essential point, however, is that the cluster is brightest at early times. Later increases in brightness may be caused by the rejuvenation of stars in collisions, but in general the total luminosity decreases steadily until the cluster dissolves completely.
a)  b)
b) 
3.4 Fraction of massive stars in the cluster center
Figure 8 shows the evolution of the fraction of stars having masses greater than 1 , within the 5% Lagrangian radius and near the 50% and 75% Lagrangian radii of model R90W4. Mass segregation causes the central mass function to flatten rapidly, but it takes considerably longer before the outer region of the cluster is significantly affected. After million years, the mass function within the inner 5% Lagrangian radius contains about 4 times as many stars with masses exceeding (relative to the local number density) than does the rest of the cluster. The mass function near the half-mass radius remains comparable to that of the cluster as a whole (see also Vesperini & Heggie 1997). The outer 75% of the cluster becomes slightly depleted of high-mass stars. Within one initial half-mass relaxation time, the fraction of stars having in this region falls by about a factor of 3. At later times, the fraction of high-mass stars throughout the cluster increases due to the preferential escape of low-mass stars; at disruption, the cluster is rich in high-mass stars, while low-mass stars are depleted. This is in agreement with the findings of Takahashi & Portegies Zwart (2000), who concluded that the observed flat mass function in the globular cluster NGC 6712 indicates that this cluster is close to dissolution.

3.5 Has the Arches cluster an unusually flat mass function?
Figer et al. (1999b) studied the mass function of the Arches cluster in two projected annuli, the inner one spanning 2.5 to 4.5 arc seconds from the cluster center (0.098 to 0.18 pc, assuming a distance of 8 kpc), and the outer one extending from from 4.5 to 7.5 arc seconds (0.18 to 0.29 pc). They found that the cluster mass function is much flatter than the Salpeter distribution (a power law with exponent ), and that the mass function in the inner annulus is even flatter ( to ) than that in the outer parts ( to ). They estimate completeness down to 20 in the inner annulus, and down to 10 in the outer one. The total number of stars in the inner annulus is 50 down to 20 , for a total mass of 2173 . The total number of stars in the outer annulus is 122 down to 10 resulting in a total mass of 3164 .
Figure 9 shows the observed mass function in the inner and outer annuli and compares them with the mass functions of our models with at 34 pc (dots), 90 pc (dashes) and 150 pc (solid line) from the Galactic center. The projected distance was kept constant at 34 pc. The comparison in Fig. 9 is performed at an age of 3 Myr. Each calculation was repeated three times to improve statistics. We further compensate for the uncertainty in cluster ages and distances from the Galactic center by using annuli which are somewhat narrower (from 0.098 pc to 0.139 pc and from 0.18 pc to 0.235 pc for the inner and outer annuli, respectively) than the observed annuli (from 0.098 pc to 0.18 pc for the inner annulus and from 0.18 pc to 0.29 pc for the outer annulus). We normalize to match a star cluster with stars111When comparing two stellar systems with a different number of stars a choice must be made about the time at which the comparison is carried out. The time can be expressed in units of the initial crossing time (or in million years as in Fig. 9), or in terms of the initial relaxation time of the cluster. For a purely dynamical comparison the initial relaxation time may be more natural (for a discussion see Portegies Zwart et al. 1998)..
The mass function for the cluster farther from the Galactic center is in better agreement with the observations; the models at pc do not reproduce the observations well. In addition, the inner annulus is much better represented by both sets of models than is the outer annulus, probably because the latter is much more sensitive to the dynamical evolution of the cluster and the adopted distance from the Galactic center. The top end of the mass function ( ) is underrepresented in both annuli. This discrepancy is caused in part by the steep slope at the upper end of our selected initial mass function (which has an exponent -2.8, where Sapleter is -2.35). We simply have not enough massive stars in our simulations. For stars more massive than , the initial mass function in young star clusters may well be flatter than than adopted by Scalo (1986).
This method of comparing mass functions is very sensitive to the total mass of the cluster, its age, and the actual distance between the cluster and the Galactic center. These three parameters are coupled via the relaxation time, and small changes in any of them may have a profound effect on the derived mass function for the real cluster.
a) b)
b)
In order to compare our model calculations more directly with the observations we introduce the ratio of the mean mass in the outer annulus to that in the inner annulus, which for the observations is . By presenting this value as a function of time (measured in units of the initial relaxation time of the cluster), we remove much of the observational bias.
This mean mass ratio is a characteristic of the cluster. For a Scalo (1986) mass function at zero age and in a system with a homogeneous density the value of this fraction is 222The initial value of because of the different lower cutoffs in the nominator and the denominator. The selected cutoffs are identical to those in the observations, which are more affected by crowding in the inner annulus.. As more massive stars sink to the cluster center due to mass segregation the value of changes. The value of also changes due to the variation of the density profile in the cluster, and therefore is also a function of the distances from the cluster center at which is measured. The shapes of these curves, however, are rather insensitive to the initial density profile because the evolution of the cluster mass (Fig. 2b) and density (Fig. 4b) do not depend sensitively on the adopted density profile. Because of the uncertainties in the masses and hence the length scales of our models, we compute at various distances from the centers of our model () clusters as functions of time.
We selected a total of 6 sets of inner and outer annuli, starting close to the cluster center and moving progressively outward. For the innermost annulus we selected , and (in units of the initial virial radius) and we increased the radii by factors of two for subsequent annuli out to , and . For each of our N-body calculations we computed for all combinations of 6 inner and outer annuli. To improve statistics we then combined the values for the inner two (solid line in Fig. 10), the middle two (dashes) and the outer two (dotted line) annuli.
Figure 10 plots these values of as a functions of time for our model calculations with and compares them with the observed mass function. We combined all models with to improve the statistics at the top end of the mass function. We computed a total of 14 models with these parameters, of which 8 were run for only 0.91 initial relaxation times and 6 continued until they dissolved (more than 3 ). The various models were scaled to the initial relaxation time before being superimposed, as explained in Sec. 3. At later times () some effect from stellar evolution may be influencing this scaling, but since we are mostly concerned here with earlier times this does not affect our conclusions. The vertical bar representing the observations may be shifted along the dotted line. The best fit for all annuli is obtained in the interval .
The value of for the inner annulus in Fig. 10 is much lower than for the outer annuli, but steadily increases to match the outer annuli near . In the same time interval for the outer annuli decreases somewhat. This effect is caused by mass segregation, as the most massive stars sink to the cluster center more rapidly than somewhat less massive stars. On their way to the cluster center the most massive stars pass through the various annuli. The loss of a few massive stars has little effect on the value of in the outer part of the cluster as these annuli contains many more stars than the inner annuli. The arrival of a few massive stars in the cluster center, however, carries a relatively larger contribution to the total mass in high mass stars to the inner annulus. The inner rises therefore more quickly than the value in the outer annuli decreases.
At later time the value of rises sharply for the inner annulus while for the outer annuli continues to decrease. The reason for this is the continuing effect of mass segregation; the more massive stars pile up in the cluster center while the clusters’ outer parts become depleted of massive stars. After , for the inner annuli (solid line in Fig. 10) starts to decrease rapidly. The sharp peak in this curve is the result of the two competing effects: mass segregation causing to increase, and stellar evolution resulting in its decline. This strong decline in is caused by the onset of stellar evolution as the model with the longest relaxation time ( Myr at pc, see Tab. 3) starts to run out of massive stars. The first decline starts at , corresponding to an age of 5.2 Myr for the Myr model. This time corresponds to the nuclear lifetime of a 34 star. The lower mass limit used for the outer annuli is 20 . Such a star has a nuclear burning lifetime of about 9.1 Myr i.e.: by the time all stars more massive than 20 have experienced a supernova and has consequently diminished. (The slightly later time at which the outer annuli run out of stars is caused by the inhomogeneous mixture of models used to make Fig. 10.)

The observed value of (vertical bar) may be moved along the horizontal dotted line until it matches any of the curves representing the model calculations. A matching result indicates that the observed mass function at these annuli agrees with a cluster at the appropriate age in units of the initial relaxation time. We illustrate this with a few examples.
At later times () the observations fit quite well with the solid line in Fig. 10, representing the innermost annuli. Initially, high-mass stars are under sampled in the inner part of the cluster, and only at later times does mass segregation cause them to sink to center of the potential well of the system, explaining the initial rise in for the innermost annuli. If indeed the observed value of coincides with the model calculations at the innermost part of the cluster, the observed cluster must be older than about . At an observed age of the Arches cluster of 1–2 Myr the initial relaxation time must then have been Myr. Using the intermediate annulus of pc to set the size scale of the models, the half-mass radius of the Arches cluster is then — pc. A cluster with a half-mass radius of pc and a relaxation time Myr contains less than a hundred stars. Since the number of stars observed easily exceeds this number we can firmly reject this solution: the observed radius of pc then corresponds to .
Alternatively, we may observe the cluster when it is younger in terms of its relaxation time. In the very early evolution of the cluster the observations are quite consistent with (the dashed as well as with the dotted line in Fig. 10), but is inconsistent with . The intermediate radius in the observations corresponds to (or about pc at a distance of 8 kpc). With these values the cluster would be described accurately by –0.9 pc at an age . With an age of the Arches cluster of 1–2 Myr (see Tab. 1) the initial relaxation time of the cluster must be larger than 20–40 Myr. With a half-mass radius (corresponding to pc), the cluster then has a mass of about 4 000 in order to produce a half-mass relaxation time of Myr. If pc, the total mass is and the relaxation time is 20 Myr.
Taking the observed half mass radius of pc and correcting it for the effects of mass segregation and expansion during its early dynamical evolution to pc, a relaxation time of 30 Myr implies a cluster of about 64k stars and a total mass of about 40 000 . These numbers would also agree with the observed number of massive stars (50 stars with in the inner annulus) if a normal Scalo (1986) mass function were adopted. We thus see no reason to invoke a flatter than usual mass function to explain the observations. This is consistent with the suggestion of Serabyn, Shupe & Figer (1998) that the Arches contains stars, far more than the 12k adopted in our models or as suggested by Figer et al. (1999a), as we discuss in Sec. 4.
The limits on the initial parameters for the Arches cluster are summarized in Fig. 11. The shaded ellipse shows the likely initial parameters for this star clusters.
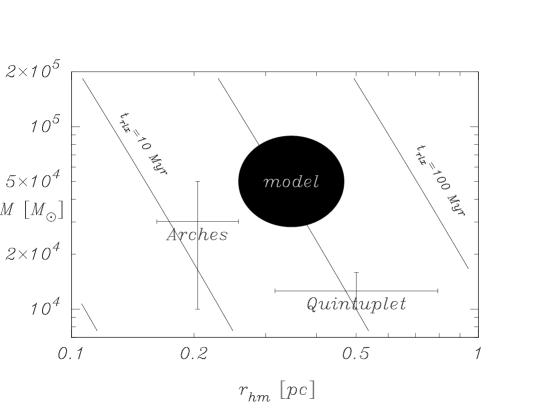
Assuming that the density profile of the cluster is consistent with a King model with –6 and adopting , we derive a Jacobi radius of 1.6 pc–2.5 . Consequently the distance from the Arches cluster to the Galactic center is between 43 pc and 91 pc, for models with =4 and =6, respectively. We conclude that the Arches cluster is likely to be at a distance from the Galactic center somewhat, but not much, greater than its projected distance. Table 4 reviews our conclusions about the Arches system.
| parameter | value |
|---|---|
| stars | |
| 43 – 91 pc | |
| 20 – 40 Myr | |
| age | |
| pc | |
| pc | |
| 4 – 6 | |
| 1.6 – 2.5 pc |
3.6 The density profile

Figure 12 shows the projected density profile of our model clusters with =4 for stars having masses at various instants. The data are presented in virial units (horizontal axis in units of , and the vertical axis in units of stars per ). The various curves (and symbols) represent the density distribution of the model clusters at zero age (solid line), at initial relaxation times (dashes), and at (dotted line). Mass segregation causes the density profile of the older clusters to steepen with time, tidal stripping causes the global density to decrease.
The open squares in Fig. 12 present the observed density distribution for the Arches cluster (Figer et al. 1999a). These data are given in arc seconds (or parsec when scaled to the appropriate distance). We plot them on the same figure assuming that the observed median radius of 0.18 pc (4.5 arc seconds) corresponds to 0.18, i.e.: that the virial radius of the Arches cluster is 1 pc. This may be an overestimate, as discussed in the previous section. There is some freedom in shifting the observed points along the arrow, which then changes the scaling for the cluster.
The observed points fit best with the dashed line and are not consistent with the solid (zero age) or the dotted () lines. The projected density profile of the observed Arches cluster thus suggests an age of about , in agreement with our findings in Sec. 3.5.
3.7 Distances to the Galactic center
The Arches cluster is located at a projected distance of pc from the Galactic center, the Quintuplet at pc. These measurements provide lower limits to the true distances of these clusters from the center.
The mean density within the Jacobi radius of a tidally limited cluster is proportional to the local stellar density. (This is not a matter of definition—it happens to be true for point-mass fields if one averages the point mass over , and for the power-law density profiles we consider here, since the tidal field , but it is not in general the case.) Thus, a cluster closer to the Galactic center is more compact, has a shorter relaxation time, and therefore evolves more rapidly than a similar cluster at a greater distance.
Most of our 34 pc models have densities higher than any of the observed clusters listed in Tab. 1 (see Fig. 4). Only the model with an extremely shallow initial density profile (R34W1) has density comparable to the observed systems. Clusters at greater distances from the Galactic center (but with the same projected distance) have lower densities. Since the densities of the 34 pc models are too high by at least a factor of two, this suggests that the real clusters are somewhat farther out, at pc; a factor of 2 in density corresponds to a factor of in radius, so the true Galactocentric distance should exceed 43 pc.

Figure 13 plots the evolution of the mean surface density within the projected half-mass radius for models R34W7 (dots), R90W4 (dashes) and R150W1 (solid), which brackets the central densities of the models. We view the clusters along the -axis, so we look through the second and first Lagrangian points toward the Galactic center, giving the highest possible cluster density and hence an overestimate of the true density contrast (see Fig. 1). The two error bars give the projected half-mass densities for the Arches (left), and the Quintuplet (right) clusters. The horizontal dotted lines give the background surface densities a projected distances of 34 pc, 90 pc and 150 pc from the Galactic center.
The surface density at projected distance from the Galactic center can be calculated by integrating the local stellar density (Eq. 10) along the line of sight to the cluster:
| (14) |
Integrating Eq. 14 from -100 to 100 pc (the range of validity of the Mezgers’ equation) gives the projected surface densities towards the Arches (at pc) and Quintuplet cluster (at pc). We integrate Eq. 14 numerically. Figures 14 and 15 illustrate this. An extra correction for stars between 100 pc from the Galactic center and Earth adds little (%) to the total (Bahcall & Soneira 1980). The projected densities of the observed clusters are comparable to the background. Clusters with lower background densities may well remain unnoticed among the background stars. Note, however, that the background stellar population is probably older than the star clusters studied here, and may therefore have a smaller mass-to-light ratio, making the clusters stand out somewhat better. This may be the reason that the Quintuplet was found even though its projected density is smaller than that of the background.

The projected density of model R150W1 remains well below the background, and such a cluster could easily remain unseen throughout its entire lifetime. The two initially more concentrated models, R90W4 and R34W7, have projected densities above the background, at least initially. The cluster farther from the Galactic center has a lower initial density because it is more extended; after the first few million years, it may become hard to see. The observation of the Quintuplet provides an upper limit on the critical contrast below which the cluster cannot be detected. We arbitrarily adopt a minimum contrast equals to the surface density of the Quintuplet cluster (i.e. pc-2) as a threshold for distinguishing a star cluster from the background. In that case, the 150 pc cluster would be invisible for its entire lifetime, while the 34 pc and the 90 pc clusters remain visible for about million years (% and % of their respective lifetimes). Thus, although the clusters farther from the Galactic center live much longer, their visible lifetime is actually less than that of a cluster at smaller Galactocentric radius.
Although not shown in Fig. 13, the surface density evolution of model R34W1 is also consistent with the densities of the observed clusters. On these grounds we therefore cannot exclude the possibility that the Arches and Quintuplet systems lie at Galactocentric distances of 34 pc, but in that case they must have been born with very shallow density profiles (which, however, would contradict our earlier analysis from Sec. 3.5, see Tab. 4).

The surface mass density as presented in Fig. 13 may not be the ideal way to express the visibility of these clusters; a luminosity density contrasted with the background would be more appropriate. This, however, requires a detailed study of the observational selection effects, which goes beyond the scope of this paper. Another way to illustrate the visibility of clusters like Arches is by looking at the integrated visual luminosity of these clusters (see Fig. 7).
4 Discussion
The Arches and the Quintuplet are among the youngest star clusters known in the Galaxy. They are not as rich as small globular clusters, but are considerably more compact. Their central densities are comparable to those of the densest—post collapse—globulars, but their life expectancies are only a few tens of millions of years. These clusters are destroyed by tidal forces, accelerated by impulsive mass loss from supernovae (after Myr) and strong binary activity. In the following we first focus on comparison with other calculations; we then discuss the consequences of our results for the inferred distances of the Arches and Quintuplet clusters from the Galactic center, and for the number of such clusters which may be hidden near the Galactic center.
4.1 Comparison with other work
Portegies Zwart et al. (1999, paper III) studied the evolution of R 136 in the LMC using N-body simulations. Their initial conditions were comparable to those adopted here, although small differences exist. They adopted King models with , whereas we selected and .
The calculations in paper III included the effects of stellar evolution and physical collisions between stars, but neglected the effect of the Galactic tidal field and the possible presence of primordial binaries. Both may have a profound effect on a cluster’s dynamical evolution. For R 136 the neglect of a tidal field may be appropriate, but for the Arches and Quintuplet clusters the tidal field is crucial. Our clusters therefore dissolve much more rapidly than the calculations in paper III. The latter models lost only a few percent of their mass within the first relaxation time, where our models lose up to % on this time scale, confirming the strong influence of the Galactic tidal field.
Portegies Zwart et al. (1999) found that physical collisions between stars in their models were frequent, and that the evolution of the most massive stars and the dynamical evolution of the cluster were closely coupled. In all cases, a single star grew steadily in mass through mergers with other stars, forming a very massive () star in less than 3–4 Myr. The growth rate of this runaway merger was much larger than estimates based on simple cross-section arguments, mainly because the star was typically found in the core and tended to form binaries with other massive stars there. We observe the same general behavior in our calculations, in the sense that collisions tend to occur between high-mass ( ) stars and that most collisions occur repeatedly with the same star. Although not discussed in detail in this paper, we find the same trend in our calculations and confirm the findings of Portegies Zwart et al. (1999). Kim, Morris & Lee (1999; KML99) performed 2-D Fokker-Planck calculations of dense star clusters near the Galactic center and studied the lifetimes of the Arches and the Quintuplet clusters. Their calculations are somewhat different than those presented in this paper in the sense that they only solve the two dimensional Fokker-Planck equation instead of the equation of motions for all stars in the stellar system. KML99 include standard binary heating (Lee et al. 1991) in their calculations and neglect stellar collisions.
We selected the most representative cases of KML99 and recalculated these with our model. The Fokker Planck models dissolve much more rapidly (often more than a factor two in lifetime) than the N-body models (see Fig. 16). Similar discrepancies are observed in the comparison between the Fokker-Planck calculations of Chernoff & Weinberg (1990) and the N-body calculations of Fukushige & Heggie (1995) and Portegies Zwart et al. (1998). The discrepancies are the result of the rather simple treatment of escapers in the Fokker-Planck models, which can drive the evaporation of the cluster on a shorter time scale then when a self-consistent tidal field is used (see Takahashi & Portegies Zwart 1998 for details). An extra complication is introduced in the calculations of KML99 by selecting a maximum mass of 150 in the initial mass function. Such stars dominate the early evolution of the star cluster while their behavior cannot accurately be represented with a statistical average as is done in a Fokker-Planck solver. Part of the spread in the Fokker-Planck results in Fig. 16 may be attributed to these effects.

Kim et al. (2000) also perform N-body calculations of several of the models explored by KML99 using Aarseths’ (1999) NBODY6. They also find that the N-body models live longer than the Fokker-Planck models, but arrive at the same conclusion as KML99: the Arches and Quintuplet star clusters must have unusually flat initial mass function and dissolve within about 10 Myr. The results of KML99 are completely understandable from their choice of initial conditions. Many of their calculations start with a Power-law initial mass function with and exponent as flat as -1.5 (Salpeter ) and omitting all stars with a mass smaller than 1 . Together with a small number of stars of only a few thousand, their models have an initial relaxation time at the tidal radius of only to 60 Myr. The lifetime of these clusters is therefore expected to be only a few million years.
Figure 16 compares the results of our calculations ( and triangles) with the Fokker-Plank calculations of KML99 (), the N-body calculations of Kim et al. (2000, squares). For comparison we added the results of the analytic model presented by Portegies Zwart et al. (2001a) as a solid line. The lowest values of our models (lower for each ) are computed with , which dissolve somewhat quicker than the more concentrated models. The lifetime of the N-body models start to depend on via the Coulomb logarithm (see Eq. 3) when the number of stars in the models drops below a few thousand. In this small limit the scaling proposed by Portegies Zwart et al (2001a) probably breaks down. This effect may cause our models with the shortest initial relaxation times to live longer than expected (leftmost triangles in Fig. 16). A similar effect may cause the models of Kim et al. (2000, open squares) to have somewhat shorter lifetimes than expected, as most of their models contain less than 3000 stars. Part of the discrepancy at small and therefore at small relaxation times may also be caused by statistical fluctuations, which become most noticeable at small .
4.2 How many clusters are still hidden near the Galactic center
Although the Arches and Quintuplet clusters are very dense, it may still be difficult to distinguish them near the Galactic center. The three-dimensional density contrast is several orders of magnitude, as can be seen in Fig. 4. In projection on the sky, however, the density contrast is reduced, due mainly to the accumulation of stars along the line of sight (see Fig. 13). The cluster density within the projected half-mass radius also decreases with time, so these clusters are more easily seen at early ages than at later times. As outlined in Sec. 3.7, to estimate the time over which our model clusters would be observable, we simply compare the integrated stellar density along the line of sight to the cluster (Eq. 14) with the projected stellar densities of the models.
In section 3.7 we introduced a limiting density contrast above which a cluster can be discriminated from the background stars, and used this to estimate the time during which our models would be detectable. At a Galactocentric distance of 34 pc, our most compact models (R34W7) remain visible for Myr; at 90 pc they become invisible after about 7 ,Myr and at a distance of 150 pc from the Galactic center they remain invisible for their entire lifetime. Models at greater distances from the Galactic center, or those born with shallower density profiles, remain undetectable for their entire life times. It is therefore not surprising that the clusters we observe near the Galactic center are extremely compact and very young. Less compact or older clusters are unobservable due to their low surface density contrasts.
Portegies Zwart et al. (2001a) studied the time scale over which clusters such as Arches and the Quintuplet systems remain visible. The results of their detailed N-body calculations are used to calibrate a simple analytical model which is applicable over a wider range of cluster initial conditions. They conclude that clusters within 200 pc of the Galactic center dissolve within Myr. However, their projected densities drop below the background density in the direction of the Galactic center within Myr, effectively making these clusters undetectable after that time. Clusters farther from the Galactic center but at the same projected distance are more strongly affected by this selection effect, and may go undetected for their entire lifetimes. Based on these findings, they conclude that the region within 200 pc of the Galactic center could easily harbor some 50 clusters with properties similar to those of the Arches or the Quintuplet systems. The results of our more extended parameter study is consistent with their findings. Given the higher mass we derive for the Arches cluster (see Tab. 4) compared to what was adopted by Portegies Zwart et al (2001a) we argue that their results may even be somewhat conservative.
Another effect which may contribute to the difficulty in detecting clusters like the Arches is the enormous range in luminosity of the brightest stars. CCD cameras have a dynamic range of less than = 64k, causing the brightest stars to saturate the detector and preventing faint stars from being detected. However, these brightest stars are also the least common; only with very deep exposures is the rest of the cluster revealed. Thus, wherever two or more bright blue stars are seen together, there may be an entire star cluster lurking in the background. An example of such a cluster may be the small group of stars identified as R 140333R 140 contains at least two WN stars and one WC star (Moffat 1987) located at a projected distance of 11.5 pc from R 136. One of the WN stars (R 140a) is a bright erg s-1 X-ray source, possibly a colliding wind binary (Portegies Zwart et al. 2001c)..
Figure 7 presented the integrated luminosity for two representative models (R90W4 and R150W4). In these models the total luminosity dropped by more than two orders of magnitude over the lifespan of the cluster. The individual high peaks are the results of single stars which become extremely bright as a result of their rejuvenation in several collisions. Such stars can temporarily outshine the rest of the star cluster. Of course, the luminosity and the lifetime of such a multiple collision product is quite sensitive to details in modeling the collision process.
5 Conclusion
We have studied the evolution of young, dense star clusters near the Galactic center, taking the Arches and Quintuplet clusters as specific examples. These clusters are generally referred to as “young,” because they are only a few million years old, and indeed, even in a dynamical sense both clusters are quite young, having lifetimes considerably smaller than their initial relaxation times. However, by observing only the most massive stars in these clusters the dynamical image sketched by the observers is biased toward greater age, as the massive stars evolve dynamically on shorter time scales than average cluster members. By observing only stars with , one selects a part of the cluster that is dynamically rather mature, being comparable in age to the local initial relaxation time. This makes the Arches cluster (and probably also the Quintuplet) appear dynamically older than it really is. We cannot test this hypothesis for the Quintuplet system because the available data are of lower quality than for the Arches.
The modeled clusters lose mass at a more-or-less constant rate, inversely proportional to the initial relaxation time, i.e. (see also Portegies Zwart et al. 2001a). Star clusters which are born farther from the Galactic center live therefore considerably longer than those closer in. The relaxation time derived from observation, however, contains little information about the initial relaxation time.
Mass segregation in our model clusters quickly causes the most massive stars to sink to the cluster center. As a result core collapse occurs within about two million years, even for models as shallow as =1. During core collapse close binaries are formed and collisions between stars are frequent. The collision rate is much higher than would be expected from simple cross section arguments, due to mass segregation and binary formation. We confirm the finding of Portegies Zwart et al. (1999) that the most massive stars are generally involved in a collision runaway, in which few low mass stars participate. This process continues until the runaway product is ejected by a supernova or a strong encounter with a binary or the cluster dissolves in the tidal field of the Galaxy.
By comparing mass functions from our models at various distances from the cluster center with observations of the Arches mass function, we conclude that the age of the Arches cluster must be about 0.05 . With an age of about 1.5 Myr the initial relaxation time of the cluster is then about 30 Myr. To reconcile the observed mass function with the observed density distribution of the Arches, we conclude that the cluster must be about and lie some 50 – 90 pc from the Galactic center. With these parameters we can reproduce the observed density distribution and the observed mass function for stars between 10 and 50 without requiring an unusually flat initial mass function. The top end of the mass function contains more stars than our adopted mass function and this may require a flatter (Salpeter ) initial mass function for stars . However, we still conclude that the Arches cluster can be explained with a “normal” mass function. Most of the observed flattening of the mass function can be attributed to selection effects caused by the limited range in distance from the cluster center in which the observations were made.
The young clusters we discussed expand as they become older, causing their surface densities and total luminosity to drop. Clusters which are older than about 5 Myr often have surface densities below that of their surrounding, making these clusters virtually undetectable. By comparing the projected density of the model clusters with that of the field stars in the direction of the Galactic center we conclude that the region within 200 pc of the Galactic center could easily harbor some 50 clusters with properties similar to those of the Arches or the Quintuplet systems. To find more clusters like Arches and Quintuplet systems, we urge observers to look for single extremely bright stars. Closer study of the region near such a star may well reveal the underlying star cluster.
Finally, with our estimate of about 50 clusters with a mass of each and dissolving within 100 Myr, we derive a star formation rate near the Galactic center of . Clusters like the Arches and Quintuplet may therefore contribute significantly to the total star formation rate in the Galaxy.
References
- Aarseth (1999) Aarseth, S. J. 1999, PASP, 111, 1333
- Bahcall & Soneira (1980) Bahcall, J. N., Soneira, R. M. 1980, ApJS, 44, 73
- Baumgardt (2000) Baumgardt, H. 2000, in MNRAS in press, 10 pages, 13 figures., 12330
- Blum et al. (1999) Blum, R. D., Damineli, A., Conti, P. S. 1999, AJ, 117, 1392
- Brandl et al. (1999) Brandl, B., Brandner, W., Eisenhauer, F., Moffat, A. F. J., Palla, F., Zinnecker, H. 1999, A&A, 352, L69
- Brandl et al. (1996) Brandl, B., Sams, B. J., Bertoldi, F., Eckart, A., Genzel, R., Drapatz, S., Hofmann, R., Loewe, M., Quirrenbach, A. 1996, ApJ, 466, 254
- Campbell et al. (1992) Campbell, B., Hunter, D. A., Holtzman, J. A., Lauer, T. R., Shayer, E. J., Code, A., Faber, S. M., Groth, E. J., Light, R. M., Lynds, R., O’Neil, E. J., J., Westphal, J. A. 1992, AJ, 104, 1721
- Chernoff & Weinberg (1990) Chernoff, D. F., Weinberg, M. D. 1990, ApJ, 351, 121
- Dutra & Bica (2000) Dutra, C. M., Bica, E. 2000, A&A, 359, L9
- Figer et al. (1999a) Figer, D. F., Kim, S. S., Morris, M., Serabyn, E., Rich, R. M., McLean, I. S. 1999a, ApJ, 525, 750
- Figer et al. (1999b) Figer, D. F., McLean, I. S., Morris, M. 1999b, ApJ, 514, 202
- Fukushige & Heggie (1995) Fukushige, T., Heggie, D. C. 1995, MNRAS, 276, 206
- Giersz & Heggie (1994) Giersz, M., Heggie, D. C. 1994, MNRAS, 268, 257
- Giersz & Heggie (1996) Giersz, M., Heggie, D. C. 1996, MNRAS, 279, 1037
- Glass et al. (1987) Glass, I. S., Catchpole, R. M., Whitelock, P. A. 1987, MNRAS, 227, 373
- Heggie & Mathieu (1986) Heggie, D. C., Mathieu, R. 1986, MNRAS, in P. Hut, S. McMillan (eds.), Lecture Not. Phys 267, Springer-Verlag, Berlin
- Heggie & Ramamani (1995) Heggie, D. C., Ramamani, N. 1995, MNRAS, 272, 317
- Hill et al. (1979) Hill, G., Hilditch, R. W., Barnes, J. V. 1979, MNRAS, 186, 813
- Kim et al. (2000) Kim, S. S., Figer, D. F., Lee, H. M., Morris, M. 2000, ApJ, 545, 301
- Kim et al. (1999) Kim, S. S., Morris, M., Lee, H. M. 1999, ApJ, 525, 228
- King (1966) King, I. R. 1966, AJ, 71, 64
- Kippenhahn & Weigert (1967) Kippenhahn, R., Weigert, A. 1967, Zeitschr. f. Astroph., 65, 251
- Kulkarni et al. (1995) Kulkarni, S. R., Matthews, K., Neugebauer, G., Reid, I. N., van Kerkwijk, M. H., Vasisht, G. 1995, ApJ, 440, L61
- Lee et al. (1991) Lee, H. M., Fahlman, G. G., Richer, H. B. 1991, ApJ, 366, 455
- Makino (1991) Makino, J. 1991, ApJ, 369, 200
- Makino & Aarseth (1992) Makino, J., Aarseth, S. J. 1992, PASJ, 44, 141
- Makino et al. (1997) Makino, J., Taiji, M., Ebisuzaki, T., Sugimoto, D. 1997, ApJ, 480, 432
- Massey & Hunter (1998) Massey, P., Hunter, D. A. 1998, ApJ, 493, 180
- McMillan (1986a) McMillan, S. L. W. 1986a, ApJ, 306, 552
- McMillan (1986b) McMillan, S. L. W. 1986b, ApJ, 307, 126
- Mezger et al. (1999) Mezger, P. G., Zylka, R., Philipp, S., Launhardt, R. 1999, A&A, 348, 457
- Moffat (1976) Moffat, A. F. J. 1976, A&A, 50, 429
- (33) Moffat, A. F. J., Niemela, V. S., Phillips, M. M., Chu, Y., Seggewiss, W. 1987 ApJ 312, 612
- Nagata et al. (1995) Nagata, T., Woodward, C. E., Shure, M., Kobayashi, N. 1995, AJ, 109, 1676
- Nagata et al. (1990) Nagata, T., Woodward, C. E., Shure, M., Pipher, J. L., Okuda, H. 1990, ApJ, 351, 83
- Okuda et al. (1990) Okuda, H., Shibai, H., Nakagawa, T., Matsuhara, H., Kobayashi, Y., Kaifu, N., Nagata, T., Gatley, I., Geballe, T. R. 1990, ApJ, 351, 89
- Olling & Merrifield (1998) Olling, R. P., Merrifield, M. R. 1998, MNRAS, 297, 943
- Oort (1927) Oort, J. 1927, ban, 3, 275
- Portegies Zwart et al. (2001c) Portegies Zwart, S. F., Pooley, D., Lewin, W. 2001, ApJ in press, astro-ph/0106109
- Portegies Zwart et al. (1998) Portegies Zwart, S. F., Hut, P., Makino, J., McMillan, S. L. W. 1998, A&A, 337, 363
- Portegies Zwart et al. (1997) Portegies Zwart, S. F., Hut, P., Verbunt, F. 1997, A&A, 328, 130
- Portegies Zwart et al. (1999) Portegies Zwart, S. F., Makino, J., McMillan, S. L. W., Hut, P. 1999, A&A, 348, 117
- Portegies Zwart et al. (2001a) Portegies Zwart, S. F., Makino, J., McMillan, S. L. W., Hut, P. 2001a, ApJ, 546, L101
- Portegies Zwart et al. (2001b) Portegies Zwart, S. F., McMillan, S. L. W., Hut, P., Makino, J. 2001b, MNRAS, 321, 199
- Portegies Zwart & Verbunt (1996) Portegies Zwart, S. F., Verbunt, F. 1996, A&A, 309, 179
- Scalo (1986) Scalo, J. M. 1986, Fund. of Cosm. Phys., 11, 1
- Serabyn et al. (1998) Serabyn, E., Shupe, D., Figer, D. F. 1998, Nature, 394, 448
- Spitzer (1987) Spitzer, L. 1987, Dynamical evolution of globular clusters, Princeton, NJ, Princeton University Press, 1987, 191 p.35
- Takahashi & Portegies Zwart (1998) Takahashi, K., Portegies Zwart, S. F. 1998, ApJ, 503, L49
- Takahashi & Portegies Zwart (2000) Takahashi, K., Portegies Zwart, S. F. 2000, ApJ, 535, 759
- van Kerkwijk et al. (1995) van Kerkwijk, M. H., Kulkarni, S. R., Matthews, K., Neugebauer, G. 1995, ApJ, 444, L33
- Vesperini & Heggie (1997) Vesperini, E., Heggie, D. C. 1997, MNRAS, 289, 898
- Vrba et al. (2000) Vrba, F. J., Henden, A. A., Luginbuhl, C. B., Guetter, H. H., Hartmann, D. H., Klose, S. 2000, ApJ, 533, L17