Gravitational microlensing of planets: the influence of planetary phase and caustic orientation111Research undertaken as part of a UK Student Fellowship at the Anglo-Australian Observatory.
Abstract
Recent studies have demonstrated that detailed monitoring of gravitational microlensing events can reveal the presence of planets orbiting the microlensed source stars. With the potential of probing planets in the Galactic Bulge and Magellanic Clouds, such detections greatly increase the volume over which planets can be found. This paper expands on these original studies by considering the effect of planetary phase on the form of the resultant microlensing light curve. It is found that crescent-like sources can undergo substantially more magnification than a uniformly illuminated disk, the model typically employed in studying such planets. In fact, such a circularly symmetric model is found to suffer a minimal degree of magnification when compared to the crescent models. The degree of magnification is also a strong function of the planet’s orientation with respect to the microlensing caustic. The form of the magnification variability is also strongly dependent on the planetary phase and from which direction it is swept by the caustic, providing further clues to the geometry of the planetary system. As the amount of light reflected from a planet also depends on its phase, the detection of extreme crescent-like planets requires the advent of 30-m class telescopes, while light curves of planets at more moderate phases can be determined with today’s 10-m telescopes.
keywords:
Gravitational Lensing – Planetary Systems1 Introduction
Recently, there has been a rapid growth in the number of extra-solar planets identified (Vogt et al. 2000; Marcy et al. 2000). Driven by technological advances, most have been found by the identification of a ‘Doppler reflex’, although more novel techniques, such as planetary occultation (Charbonneau 2000), are also proving fruitful. Collier Cameron et al. (1999) claim to have directly detected the starlight reflected from the planet orbiting Boötis (although see Charbonneau et al. 1999). While it now appears that this Boötis measure has not been confirmed in follow-up observations, the identification of planets due to reflected starlight has a firm theoretical foundation (Sudarsky et al. 2000).
All these techniques focus on stars in the vicinity of the sun, over a region of several tens of parsecs. At larger distances, however, planets can be detected orbiting the compact objects responsible for gravitationally microlensing stars in the Galactic Bulge and Magellanic Clouds via their perturbative influence on the microlensing light curve (Wambsganss 1997). More recently, Graff & Gaudi (2000) and Lewis & Ibata (2000)(hereafter LI2000) have considered instead the detection of planets orbiting the microlensed sources. Using the models for ‘hot Jupiter’ type planets as a basis for their studies, these groups demonstrated that the small fraction of light reflected from the planet can be significantly magnified, resulting in an observable per cent deviation in the microlensing light curve. LI2000 also demonstrated how the monitoring of polarization through a microlensing event can probe the composition of the planetary atmosphere.
In studying the microlensing light curve of planets orbiting the source stars, these original studies assumed that the planet undergoing microlensing can be represented by a circularly symmetric source. This situation only occurs at opposition, and at any other point in its orbit the planet will display phases akin to the moon and the inferior planets. This paper considers the influence of these deviations from circular symmetry on the form of the microlensing event with the goal of examining their influence on the detectability of planets via gravitational microlensing. Section 2 describes the numerical approach taken in this paper, and outlines both the microlensing model and the choice of planetary phases. Section 3 describes the results of this study, including an examination of how these results influence the detectability of the planet, while Section 4 presents the conclusions.
2 Method
2.1 Microlensing Model
Several reviews on the physical aspects of microlensing in the Galactic Halo have recently appeared (e.g. Paczyński 1986) and this background material will not be reproduced here. As with the studies of Graff & Gaudi (2000) and LI2000 this paper assumes that the planetary system is microlensed by a binary system. Such systems can result in extended regions of strong magnification in the vicinity of ‘fold caustics’. Due to their extended nature, such caustics have proved useful probes of not only the surfaces of stars (Sasselov 1998; Gaudi & Gould 1999), including the detection of stellar spots (Han et al. 2000), but also the structure at the heart of quasars (Fluke et al. 1999). As with Graff & Gaudi (2000) and LI2000, it is assumed that the planet is swept by a fold caustic during a binary microlensing event.
The magnification induced as a point source is crossed by a fold caustic is given by
| (1) |
Here, is the distance from the source to the caustic and is the Heaviside step function (Schneider et al 1992). The flux factor represents the ‘strength’ of the caustic and is the amplification of all other images of the source far from the critical curve of the caustic (Chang 1984; Witt 1990; Wook et al. 1998)
In general, analytically calculating the light curve of an arbitrary source as it is microlensed by a fold caustic is non-trivial. Numerically, however, the situation is much more tractable. For this study, the magnification distribution due to the fold caustic is defined on a grid of pixels. The grid is chosen such that the pixel size is much smaller than the scale of the magnification map or any planetary structure. In considering pixels, Equation 1 can written (Lewis & Belle 1998)
| (2) |
Here, is the extent of the pixel, and is the distance of the pixel to the caustic. In the following study we assume , although we will concentrate on the magnification due to the caustic.
2.2 Planetary Phase
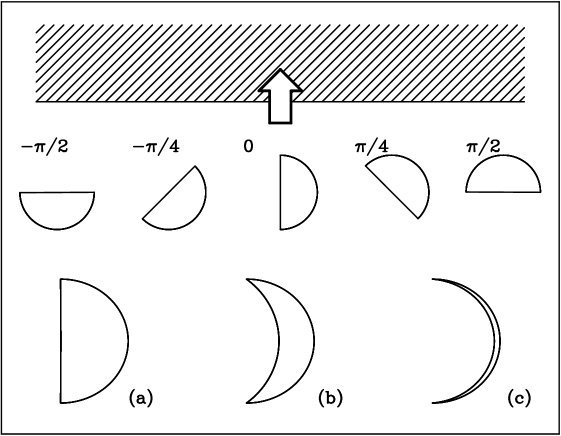
Figure 1 summarizes the planetary phases and orientations employed in this study. The lower panel presents the models for the phase; running from (a) to (c) these go from a quarter moon configuration to an extreme crescent. In the upper part of the Figure, the relative orientation of the planetary phase to the incoming caustic (denoted by the cross-lined region and arrow) is presented. Each model, therefore, is labelled as , where represents the phase (a, b or c) and is the orientation. The crescent is assumed to be uniformly illuminated, neglecting the effects of limb darkening. In studies of stellar microlensing, limb darkening has been found to produce a variations of several percent during the peak of a microlensing event (e.g. Yock 2000) and can be considered a perturbation to the results presented here.
In comparing to previous work it should be noted that due to symmetry considerations, the magnification of model – henceforth referred to as the “uniform, circular source” – is identical to that of the circular source of the same radius. Note also that, to allow a comparison, in the following the “light curves” present the magnification over time, equivalent to assuming that the flux received from each model of the planet is the same, irrespective of the phase of the planet. The effect of planetary phase on the observed flux, and hence detectability of the planetary microlensing event, is addressed in Section 3.3.
2.3 Numerical Approach
In the numerical approach adopted, each source was generated as depicted by models (a), (b) and (c), in Figure 1. As noted previously, the magnification pattern was laid out on a grid of pixels. Similarly, the light distribution over the planets, as illustrated in Figure 1, was also defined on a grid, taking account of the orientation with respect to the incoming caustic. The grid scale was fine enough to ensure insignificant numerical errors, with a comparison to analytic tests. In generating the lensed view of the source, the planetary profiled was convolved with the magnification map, providing the light curve as the source is swept by the caustic. Note that all light curves discussed in Sections 3.1 and 3.2 are normalized such that the unlensed view of the source has unit flux.
3 Results
3.1 Quarter Moon Illumination: Model (a)
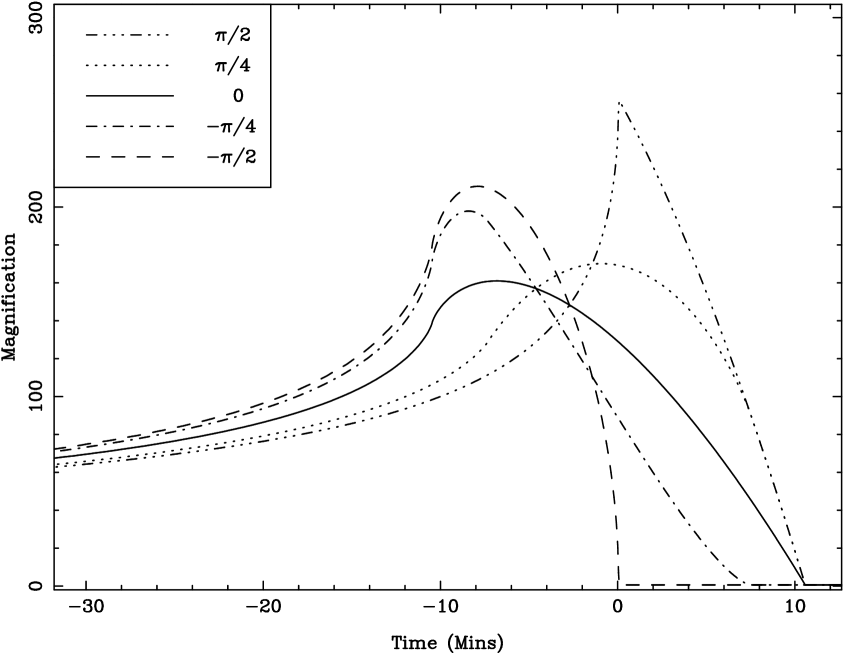
Figure 2 presents the light curves for model (a) at the five fiducial orientations described in Section 2.2. The axes are for the model of LI2000 who considered a planet of radius 1.8 Jupiter located in the Galactic Bulge, a value typical of hot Jupiter systems. The light curves presented in this paper can related to those of differing source size, caustic strength and relative velocities through simple scaling relations. Firstly, both the distances and caustic strength in Equations 1 and 2 are naturally expressed in units of Einstein radii. Given the relative velocities, the crossing time of this scale length is given by (e.g. LI2000);
| (3) |
where M is the mass of the lens (typically taken to be 1) and is the perpendicular velocity of the lensing objects in units of 100. is the distance to the source in kpc, while d is the ratio of the distance to the lens to the distance to the source. The magnification can be scaled using the results of Chang (1984) who demonstrated that when a source of radius is swept by a caustic of strength , it will suffer a maximum magnification of
| (4) |
where is the ‘form factor’ which accounts for the specific shape and brightness profile of the source. For a uniformly illuminated circular disk, .
It is immediately apparent that rotating the source with respect to the caustic radically changes the form of the microlensing light curves. At , the light curve is seen to possess a rapid rise, sharply turning over into a rapid decline. Similarly, also displays a rapid rise, but a more gentle turn over into a decline. The intermediate cases show similar trends between the two extreme orientations.
An examination of the light curves in Figure 2 reveals that the peak magnification in each light curve also depends on the planetary orientation. In investigating this further, one hundred additional light curves at orientations between and were generated. Figure 3 presents the peak of the magnification of these light curves versus the orientation of the planet with respect to the caustic (note that the background magnification, , has been subtracted from the light curves in this analysis). The curve is normalized with respect to the peak magnification of model , the uniform, circular source (equivalent to a circular source of the same radius). Due to the scaling relations outlined previously, this curve is insensitive to the specific values of the caustic strength and planetary radius.

Interestingly, model (a) suffers significantly more magnification at orientations of when compared to an orientation of 0; in the case of this is that of the uniform, circular source. This result clearly demonstrates that such a model undergoes a minimum magnification when compared to model (a) at virtually all other orientations. The degeneracy between model and a circularly symmetric source of the same radius allows further comparison with previous results. Hence, using Equation 4, the form factor for model (a) at the various orientations presented in this paper can be simply calculated by scaling by the values presented in Figure 3 [using Figure 5 for models (b) and (c)].
3.2 Crescent Illumination: Model (b) & (c)
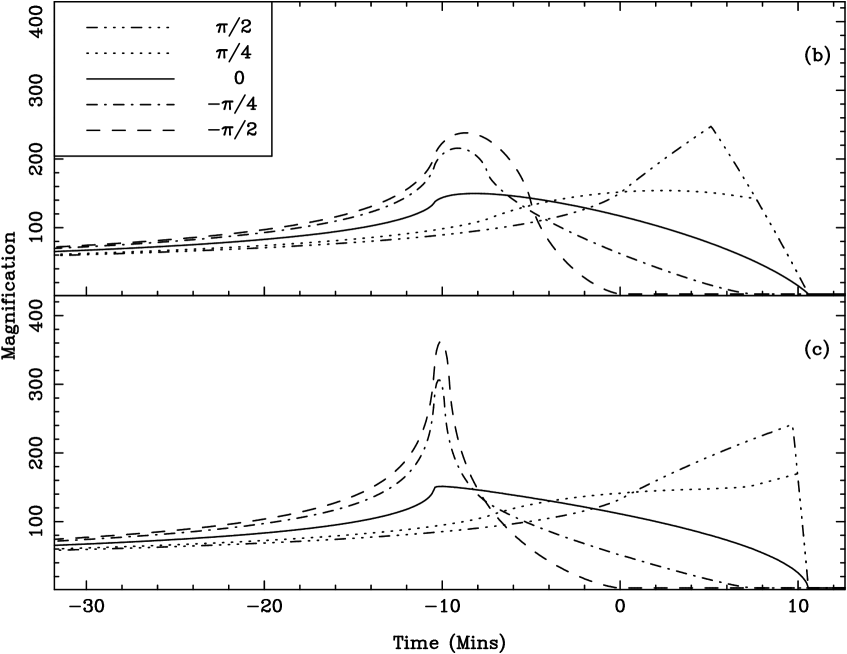
Figure 4 presents the light curves for models (b) and (c). In comparing to Figure 2 it can be seen that the peak magnification of all models at is virtually the same. Both sets of light curves possess the same generic features seen in model (a), although as the planet becomes more crescent-like, the features of the light curve become sharper. This is strikingly apparent for model (c) (lower panel), where the light curve displays an almost vertical rise in and . Correspondingly, and possess substantial peaks in their light curves, although these are accompanied by more gentle rises.
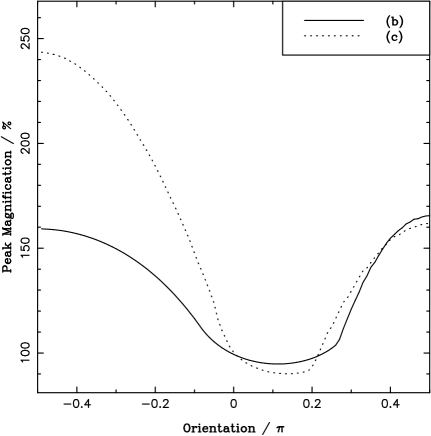
Again, the peak magnification is a function of the planetary orientation with respect to the caustic. As with model (a), a larger sample of light curves for models (b) and (c) were generated to investigate this dependence. The peak magnifications for these samples are presented in Figure 5. Interestingly, while it is apparent that light curves for each model at are different, they possess very similar values of peak magnification. These have been normalized with the peak magnification of the uniform, circular source. As with model (a), the light curves at possess the lowest value of peak magnification, with higher values occurring at , although in model (b) the extremes of the peak magnification are at the minimum value. Model (c) possesses a similar value at , while at the peak magnification climbs to the minimum value.
3.3 Detectability
The preceding sections have discussed the variation in magnification as a planet is swept by a gravitational microlensing caustic. While this eases comparison with previous models, being dependent only upon the size and shape of the source, the observed property during a microlensing event is flux. For a specific planetary system, the fraction of stellar light reflected from a planet is dependent upon its orbital phase. As demonstrated in the previous sections, the details of the microlensing magnification are similarly dependent upon the planetary orbital phase, and it is the combination of the reflected planetary flux and magnification that will determine detectability of the microlensing event.
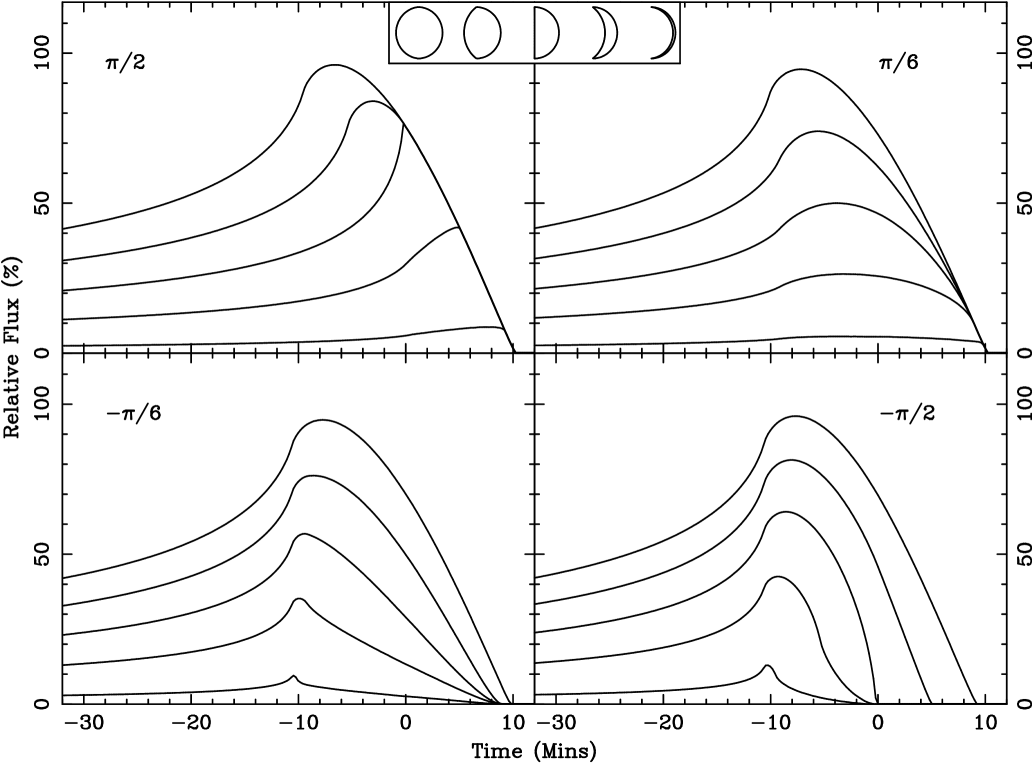
With respect to a circular source, models (a), (b) and (c) reflect 50%, 29% and 5% of the stellar light respectively, assuming isotropic scattering. Figure 6 presents the observed flux for a specific planet at several different phases, including gibbous phases (denoted in the inset box). Four orientations with respect to the sweeping caustic are portrayed, and all light curves are normalised to the flux of a microlensed circular source, which peaks at 100%. The same feature is seen in all light curves, namely that the observed flux drops as the planetary phase changes from full to crescent, even though these latter phases undergo stronger magnification.
Figure 7 presents simulated observations of light curves given in Figures 2 and 4, assuming the host star is V=18, with an extinction of 1.25mags (following the model of LI2000). The three models, (a), (b) and (c) are presented vertically, with each column representing the differing orientations. For each model, two sets of simulated observations are given, assuming a 10-m class (upper panels) and 30-m class (lower panels), using the planetary parameters used by LI2000. The ordinate on each panel represents the fractional light curve deviation due to the presence of the planet, and should be compared to Figure 2 in LI2000. Each telescope is assumed to have a 10% total efficiency, and the data points are subject to photon counting errors only. The integration times for both telescopes are 100, 200 and 400secs for model (a), (b) and (c) respectively.
The 10-m class telescope observations represent the current astronomical technology. The fractional deviation introduced into a light curve by model (a), of order , is clearly detectable, with the photometry accurately revealing the differing light curve profiles at the different planetary orientations. This is also seen with model (b) which, while possessing lower signal-to-noise, still allows recovery of the detailed light curve profile. For model (c), however, the small fraction of reflected light means that the resultant fractional deviations are small, less than 0.5%. As illustrated in Figure 7, while fluctuations at this level are potentially detectable, the details of their profiles are lost in the noise. Plans are currently underway to build the next generation of ground-based telescope, with 30-m telescopes entering operation between 2010-2015. An examination of the lower panels in Figure 7 demonstrate that with the advent of such telescopes, the fractional deviation introduced by a planet planetary companion will be readily identifiable, even for planets presenting only a thin crescent.
It must be remembered that the above discussion is for a particular set of planetary and microlensing parameters, such as planetary radius, albedo, caustic strength and relative velocities, and that the detectability of a planetary companion will depend on the specific values of these for the system under consideration.
4 Discussions & Conclusions
Recent studies have demonstrated that when a star in the Galactic Bulge or Magellanic Clouds is magnified during a microlensing event, any light reflected from an orbiting planet can also be significantly magnified to observable levels. These previous works, however, have assumed a simplified model for the distribution of reflected light from the planet, namely a circularly symmetric disk. The reflected light from any real planet, however, will display phases akin to those seen with the moon and the inferior planets.
This paper has presented a study on the effect of planetary phase on the degree to which the light reflected from a planet is magnified as it is swept by a caustic during a gravitational microlensing event. Considering simple models to represent various planetary phases, this work has demonstrated that these non-circular profiles result in strikingly different light curves that are solely dependent upon their orientation with respect to the sweeping caustic. While this behaviour is different, depending upon the specifics of the light distribution reflected by the planet, all the models display the same generic trends.

Equally interesting is that the peak magnification of a light curve for a model of the planet is also strongly dependent upon the planetary orientation with respect to the caustic. In each model, the planet was substantially more magnified if orientated at , than at 0 (see Figure 1). In the case of the simple ‘quarter moon’ (model a), this resulted in up to per cent more magnification than when compared to planets orientated at . Due to scaling relations, Figures 3 and 5 are insensitive to specific values of caustic strength and planetary radius.
These trends are also seen in models (b) and (c) which are more crescent-like, both possessing peak magnification distributions that possess a minimum at , rising to . In the case of model (c), the light curve at possesses a peak magnification exceeding those at by 140 per cent. Considering that model (a) at is degenerate with the circularly symmetric models typically employed in microlensing studies, these results imply that previous results have underestimated the potential magnification in planetary microlensing events by a factor of a few.
While these results are encouraging, the detectability of a planetary microlensing event will depend on the amount of flux received by an observer. As well as the magnification, this will depend also on the amount of stellar light that is reflected by a planet, a value that decreases as a planet appears more crescent-like. Simulated observations presented in this paper reveal that the microlensing of moderately crecsent-like planets (model b) are detectable with current telescopes at a temporal sampling that allows the detailed recovery of the underlying profile. With more extreme crescents, the planetary event the fractional deviation of occurs too quickly to be effectively sampled by photometric monitoring with a 10-m class telescope, although proposed 30-m class telescopes will resolve the fluctuations. The exact details of the microlensing light curve deviations due to the presence of a planetary companion depend upon a number of parameters, although the results presented here and in previous studies (Graff & Gaudi 2000; LI2000) suggest that this approach should successfully uncover hot Jupiters at kiloparsec-scale distances.
Due to condensed particulate matter in the atmospheres of planets, the light they reflect is expected to be polarized (Seager et al. 2000), although the degree of this polarization is extremely small . LI2000 considered the effect of microlensing magnification on this polarization signature and found that it too can be boosted to detectable levels, although at a fraction of a percent, the measurement of such polarizations still presents observational difficulties. In light of the results of the study presented in this paper, we have begun an extensive investigation into the further effects of the microlensing of planets, especially the expected polarization signatures from crescent-like sources.
Acknowledgements
The anonymous referee is thanked for comments that improved the paper. GFL thanks Eric Agol for discussions that initiated this study. CEA thanks the Anglo-Australian Observatory for hospitality and support for the duration of her UK Student Fellowship.
References
- [Chang (1984)] Chang, K. 1984, A&A. 130, 157
- [Charbonneau et al (1999)] Charbonneau, D., Noyes, R.W., Korzennik, S.G., Nisenson, P., Saurabh, J., Vogt, S.S. & Kibrick, R.I. 1999, ApJ, 522, L145
- [Charbonneau (2000)] Charbonneau, D., Brown, T.M., Latham, D.W. & Mayor, M. 2000, ApJ, 529, L45
- [Collier Cameron, et al(1999)] Collier Cameron, A., Horne, K., Penny, A. & James, D. 1999, Nature, 402, 751
- [Graff Gaudi (2000)] Graff, D. & Gaudi, B.S. 2000, ApJ, 538, L133
- [Gaudi Gould (1999)] Gaudi, B.S. & Gould A. 1999, ApJ, 513, 619
- [Fluke Webster (1999)] Fluke, C.J. & Webster, R.L. 1999, MNRAS, 302, 68
- [Han, et al (2000)] Han, C., Park, S., Kim, H. & Chang, K. 2000, MNRAS, 316, 665
- [Lewis Belle (1998)] Lewis, G.F. & Belle, K.E. 1998, MNRAS, 297, 69
- [Lewis Ibata (2000)] Lewis, G.F. & Ibata, R.A. 2000, ApJ, 539, L63 (LI2000)
- [Marcy, et al (2000)] Marcy, G.W., Butler, R.P. & Vogt, S.S. 2000, ApJ, 536, L43
- [Paczyński (1986)] Paczyński, B. 1986, ARA&A, 34, 410
- [Sasselov (1998)] Sasselov, D. D. 1998, ASP Conf. Ser. 154: Tenth Cambridge Workshop on Cool Stars, Stellar Systems, and the Sun, 10, 383
- [Schneider, et al (1992)] Schneider, P., Ehlers, J., & Falco, E.E. 1992, Gravitational lenses (Berlin: Springer)
- [Seager, et al (2000)] Seager, S., Whitney, B.A. & Sasselov, D.D., 2000, ApJ, 540, 504
- [Sudarsky, et al (2000)] Sudarsky, D., Burrows, A., & Pinto, P. 2000, ApJ, 538, 885
- [Vogt, et al (2000)] Vogt, S.S., Marcy, G.W., Butler, R.P. & Apps, K. 2000, ApJ, 536, 902
- [Wambsganss (1997)] Wambsganss, J. 1997, MNRAS, 284, 172
- [Witt (1990)] Witt, H.J. 1990, A&A, 236, 311
- [Wook et al (1998)] Wook, L.D., Chang, K.Y., & Joon, K.S. 1998, J. Korean Astron. Soc., 31, 27
- [Yock (2000)] Yock, P. 2000, PASA, 17, 35