Radio Properties
of the Shapley Concentration
IV. The A3528 Cluster Complex
Abstract
We report and discuss the results of a 22 cm radio survey carried out with the Australia Telescope Compact Array (ATCA) covering the A3528 complex, a chain formed by the merging ACO clusters A3528-A3530-A3532, located in the central region of the Shapley Concentration. Simultaneous 13 cm observations are also presented. Our final catalogue includes a total of 106 radio sources above the flux density limit of 0.8 mJy. By cross correlation with optical and spectroscopic catalogues we found 32 optical counterparts, nine of them belonging to the A3528 complex.
We explored the effects of cluster mergers on the radio emission properties of radio galaxies by means of the radio luminosity function (RLF) and radio source counts. We found that the radio source counts are consistent with the background counts, as already found for the A3558 complex (Paper III). The RLF for this complex is consistent, both in shape and normalisation, with the general cluster luminosity function for early-type galaxies derived by Ledlow & Owen (LO96). This result is different from what we obtained for the A3558 merging complex, whose RLF is significantly lower than LO96.
We propose that the different stage of the merger is responsible for the different RLFs in the two cluster complexes in the core of the Shapley Concentration. The early stage of merger for the A3528 complex, proposed by many authors, may have not yet affected the radio properties of cluster galaxies, while in the more much advanced merger in the A3558 region we actually see the effects of this process on the radio emission.
keywords:
Radio continuum: galaxies - Clusters: general - galaxies: clusters: individual: A3528 galaxies: clusters: individual: A3530 galaxies: clusters: individual: A35321 Introduction
Cluster mergers are the most energetic and common phenomena in the Universe, leading to an energy release of ergs on a timescale of the order of Gyrs. However, it is still unclear how this enormous energy release is dissipated. While the effects of merging on the large scale properties of the hot intracluster medium (shocks, gradients in the temperature and changes in the gas distribution profiles) seem to be reasonably well understood (see for example Roettiger, Burns & Loken 1996), a key question is whether it has important consequences also on the galaxy population properties. Bekki (1999) suggested that merging could be important in driving gas towards the centres of galaxies and, therefore, in fuelling the star formation. Owen et al. (1999), in a comparative study of the two clusters A2125 and A2645, suggested that cluster merging could be responsible both for the high fraction of blue (i.e. star-forming) galaxies and for the excess in the radio source population in A2125.
In order to explore in detail the astrophysical consequencies of merging on galaxy radio emission, Venturi et al. (2000, Paper III in this series) carried out a detailed multifrequency study of the A3558 cluster complex, at the centre of the Shapley Concentration. This structure is formed by three Abell clusters and two poor groups. Bardelli et al. (1998b) suggested that it is the remnant of a cluster-cluster collision, seen just after the first core-core encounter. This hypothesis is supported by the dynamical state of clusters (Bardelli et al. 1998a) and by a filament of hot gas connecting the clusters (Bardelli et al. 1994, Kull & Böhringer 1999). Moreover, there is marginal evidence of an excess of blue galaxies at the expected shock position. Substructure analysis (Bardelli et al. 1998b) and the detailed dynamical study of a possible relic source (Venturi et al. 1998, Paper II) show that this complex is far from a relaxed state.
Rather unexpectedly, the bivariate radio-optical luminosity function of the A3558 complex shows a significant deficiency of radio sources in comparison with the cluster sample studied by Ledlow & Owen 1996 (hereinafter LO96), suggesting that merging may have “switched-off” pre-existing radio sources. These results suggest that the role of cluster mergers on the radio properties of galaxies is not well understood yet, and other parameters, such as, for example, the evolutionary stage of the merger and the initial conditions (such as for example cluster masses) are likely to play a major role.
Very few merging clusters are as well studied at optical, X–ray and radio wavelengths as done for the A3558 complex, therefore it is of crucial importance to increase their number, in order to throw light on such a complex phenomenon and better understand the relation between cluster mergers and the radio properties of galaxies. With this aim in mind, we surveyed another region of merging clusters in the core of the Shapley Concentration, dominated by A3528. This structure is formed by the ACO (Abell, Corwin & Olowin 1989) clusters A3528, A3530, A3532 and A3535. These clusters have been observed with ROSAT (Schindler 1996; Henriksen & Jones 1996; White, Jones & Forman 1997); moreover, Bardelli, Zucca & Baldi (2000) performed a redshift survey of galaxies in order to determine the dynamics of the complex.
We observed the complex simultaneously at 22 cm and 13 cm with the Australia Telescope Compact Array (ATCA). We covered the whole region, an area of deg2 in the sky. In this paper, the fourth of a series of papers dedicated to this study, we present the results of our observations. In Section 2 we summarize the global properties of the Abell clusters in this region; in Section 3 we describe the observations, data reduction and give a catalogue of the radio sources; optical identifications for the detected sources are also presented in this section. The properties of the extended radio galaxies in the A3528 complex are given in Section 4; our statistical analysis and conclusions are given in Section 5 and 6 respectively.
As in previous papers in this series, we assume a Hubble constant H0 = 100 h km s-1Mpc-1. At the average redshift of the Shapley Concentration, , = 0.67 kpc.
2 The A3528 cluster complex in the Shapley Concentration
The A3528 cluster complex is a group of galaxy clusters located in the core of the Shapley Concentration, northwest of the A3558 complex, the dominant structure of the supercluster, and it is formed by the three ACO clusters A3528, A3530, A3532. It is at an average redshift of ( 16000 km s-1) and has an elongation of in the North-South direction ( 8 h-1 Mpc). The poor cluster A3535, located northeast of A3528, although close in projection to the other clusters of the complex, is at a larger redshift, i.e. ( 20000 km s-1).
Figure 1 shows the isodensity contours of the distribution of the optical galaxies with magnitude b 19.5; the levels have been chosen in order to highlight the clusters. The figure shows two interesting features: a) the distance between the centres of A3530 and A3532 is smaller than their Abell radii, an indication at least of tidal interactions; b) the contours of A3528 appear to be elongated in the North-South direction, pointing toward the A3530-A3532 system. A substructure analysis done by Bardelli, Baldi & Zucca (2000) led to the conclusion that the whole chain is in a very complex dynamical state. Table 1 summarizes the most important features of the three clusters: in columns 1, 2 and 3 we give respectively name and J2000 coordinates; in column 4 the Bautz-Morgan type and richness; columns 5 and 6 show the mean heliocentric velocity and velocity dispersion; mass, X–ray luminosity and gas temperature are reported respectively in columns 7, 8 and 9.

A3528 is the dominant cluster in this region, with richness class 1 (Abell, Corwin & Olowin 1989) and a cD galaxy with bJ = 13.6 located at its centre. X-ray observations (Raychaudhury et al. 1991; Schindler 1996) revealed that the X-ray emission in A3528 is bimodal, and actually consists of two components, called A3528N and A3528S, whose centres are separated by 13 arcmin ( 570h-1 kpc).
It has been proposed that A3528 is an early merger. This hypothesis is supported by the X-ray temperature gradient in the regions facing the two structures (Schindler 1996, hereinafter S96), and by the complex results emerging from the substructure analysis (Bardelli et al., 2000).
22 cm radio observations carried out by Reid, Hunstead and Pierre (1998, hereinafter RHP98) show that five extended radio sources are associated with cluster galaxies. They proposed that the head-tailed source located near the centre of A3528N was triggered on its first orbit around the cluster centre. They therefore concluded that the pre-merging stage of the cluster is responsible for the nuclear activity of the central radio galaxies.
| Cluster | RAJ2000 | DECJ2000 | B-M Type (R) | Mass | LX | TX | ||
|---|---|---|---|---|---|---|---|---|
| km s-1 | km s-1 | 1014h-1M⊙ | 1043 erg s-1 | kT | ||||
| A3528 | 12 54 34 | 29 08 30 | II (1) | 16332 | 955 | N: 3.1a | N: 3.2a | N: 2.7a |
| S: 3.9a | S: 4.1a | S: 2.9a | ||||||
| A3530 | 12 55 31 | 30 19 53 | I-II (0) | 16274 | 730 | 1.1b | 2.4c | 3.2c |
| A3532 | 12 57 22 | 30 22 03 | II-III (0) | 16605 | 447 | 1.7b | 7.2c | 4.4c |
Notes to Table 1.
and for all clusters are taken from Bardelli et al. (2000).
a Henriksen & Jones (1996);
b Ettori, Fabian & White (1997)
c White, Jones & Forman (1997).
A3530 and A3532 are aligned approximately east-west, perpendicular to the projected extension of A3528. They are both richness class 0 clusters. A3530 is dominated by two very bright elliptical galaxies, each surrounded by an extended envelope, and probably interacting, while a dumbell galaxy is located at the centre of A3532.
Both clusters are characterised by X-ray emission, which peaks at the optical density peak. No radio observations exist in the literature. However, the dumbell galaxy located at the centre of A3532 is a well known radio source with extended morphology (Gregorini et al. 1994).
3 The A3528 radio survey
3.1 22 and 13 cm observations and data reduction

The observations of the A3528 complex at 22 and 13 cm were carried out with the Australia Telescope Compact Array (ATCA). At 22 cm (1.38 GHz) the region was well covered with 4 pointings, characterised by different array configurations and exposure times. The details of the observations are summarized in Table 2, while the spatial coverage is shown in Figure 2, overlaid on the optical isodensities. Note that the overlapping regions between adjacent fields ensure an almost perfect coverage of the whole cluster chain.
| Field | RAJ2000 | DECJ2000 | Array | Min. Max. Baseline | Time | rms (22 cm) | rms (13 cm) |
|---|---|---|---|---|---|---|---|
| # | m | hr | mJy/beam | mJy/beam | |||
| 1 | 12 54 24 | 29 01 19 | 6C | 153 - 6000 | 2 | 0.10 | 0.20 |
| 2 | 12 54 30 | 29 29 59 | 1.5B + 6C | 31 - 6000 | 0.17 | 0.12 | |
| 3 | 12 55 00 | 30 22 00 | 1.5B + 6C | 31 - 6000 | 0.10 | 0.10 | |
| 4 | 12 57 13 | 30 23 44 | 6C | 153 - 6000 | 2 | 0.10 | 0.14 |
Fields #1 and #4 are archive ATCA data and refer to observations carried out in March 1994 (see RHP98) which we re-analysed starting from the original uncalibrated u-v data. We observed fields #2 and #3 in May and July 1995 with the ATCA in two different array configurations (see Table 2) which we combined in order to improve the u-v coverage and sensitivity. The resolution in each field is . However, thanks to the better u-v coverage at short spacings, the sensitivity to extended structure is higher in fields #2 and #3.
Each observation was carried out with a 128 MHz bandwidth, using a correlator configuration with 32 4-MHz wide channels to minimise bandwidth smearing at large distances from the field centre. B1934638 was used as primary flux calibrator, with an assumed flux density S22cm = 14.9 Jy. The data reduction was carried out with the MIRIAD package (Sault, Teuben & Wright 1995), which is particularly suited for the ATCA observations. The image analysis was carried out with the AIPS package. The average noise in the final images is 0.1 mJy/beam in all fields except field #2, where the presence of two strong sources at the field edge increases the rms to 0.17 mJy/beam.
We consider as reliable all detections with peak flux density S 0.8 mJy/beam, which corresponds to confidence level in field #2.
In order to compensate for the sensitivity loss towards the field edge due to the primary beam attenuation, we corrected the flux densities using the analytical formula of the ATCA primary beam attenuation given by Wieringa & Kesteven (1992).
The uncertainty in the flux density measurement is a function of the map noise, the source flux density and the residual calibration error. We have assumed that
where is the map noise, is the residual calibration error, estimated to be of the order of 1%, and is the source flux density. We point out however that a detailed analysis on the internal accuracy of the flux density measures for the sources in the ATESP survey (Prandoni et al. 2000a), carried out with the ATCA at 1.4 GHz at resolution comparable with the data presented in this paper, showed that the uncertainties in the flux density measures obtained from Gaussian fits for sources with low signal to noise ratio, i.e. SNR , can be as high as 1015 %.
The radio position error depends on the beam size and the source flux density. With the parameters of our observations the position uncertainty for the weakest sources in the sample is and in right ascension and declination respectively.
Simultaneous 13 cm (2.38 GHz) observations were carried out in each configuration, and the data reduction and image analysis were carried out as for the 22 cm dataset. The adopted flux density for the primary calibrator B1934638 is S13cm = 11.6 Jy. The field of view of the ATCA at 13 cm is 22′, so only the central part of the 22 cm fields was covered by the 13 cm observations. The 13 cm rms in each field is reported in Table 2. The resolution of our 13 cm images is . On the basis of the rms reported in Table 2 we placed a detection limit of S13cm = 0.8 mJy.
3.2 The sample of radio sources at 22 cm
We detected a total of 106 radio sources at 22 cm above the flux density limit of 0.8 mJy. We point out that the 22 cm mJy survey presented here and in Paper III of this series is the deepest wide area surveys available in a cluster of galaxies type environment (see Prandoni et al. 2000b for a review of the mJy and sub-mJy surveys available at this frequency).
The source list is reported in Table 3, where we give name and position (columns 1, 2 and 3), integrated flux density at 22 cm and 13 cm corrected for the primary beam attenuation (columns 4 and 5), and the radio morphology in column 6. From our 22 cm images we classified the radio morphology of the sources in our sample as follows: unresolved, resolved, D=double; HT=head tail; WAT=wide angle tail. For the double sources in the sample we give the position of the radio barycentre, and for the remaining extended sources we give the position of the radio peak.
The 13 cm flux density measurements are available only for a fraction of sources in our list, i.e. all sources with a distance smaller than arcmin from the respective field centre. As clear from Table 3, another fraction of the 22 cm sources surveyed at 13 cm has a flux density S13cm below the sensitivity limit of our 13 cm observations. Finally a few sources have S 0.8 mJy/beam (before the primary beam correction), but they are undoubtely real. We marked these flux densities with .
Most of the sources detected in the 22 cm survey are unresolved; there are 18 extended radio sources, corresponding to % of the total. Among these extended radio sources we identify three wide-angle tail (WAT) sources, three head-tails (HT) and five doubles. The remaining extended sources have more complex morphologies, and require observations at other frequencies and resolutions for a clear morphological classification.
We note that the flux densities reported in Table 3 for 12 sources were also given in RHP98. The values we derived for those sources after re-analysis of the archive data set are a few percent higher than those already published. For all sources in our sample we also compared our flux density measurements with those obtained from the NRAO VLA Sky Survey (NVSS) images (Condon et al. 1998), and found that the ratio is in the range 0.851, depending on the source structure, consistent with the lower resolution and different u-v coverage of NVSS. Given the better agreement between our values and those obtained from NVSS and our more homogeneous analysis of the radio data, we now prefer the flux densities reported in Table 3 for all sources in the A3528 complex.
| Name | RAJ2000 | DECJ2000 | S22cm | S13cm | R Morph |
|---|---|---|---|---|---|
| mJy | mJy | ||||
| J12522927 | 12 52 04.5 | 29 27 54 | 77.7 | - | unres. |
| J12522928a | 12 52 04.7 | 29 28 24 | 149.6 | - | unres. |
| J12522902 | 12 52 17.9 | 29 02 10 | 10.1 | - | unres. |
| J12522908 | 12 52 33.2 | 29 08 05 | 101.1 | 0.8 | D |
| J12522917 | 12 52 48.3 | 29 17 01 | 10.3 | 0.8 | unres. |
| J12522928b | 12 52 56.7 | 29 28 00 | 12.6 | 0.8 | unres. |
| J12532902 | 12 53 05.4 | 29 02 36 | 6.0 | 0.8 | unres. |
| J12533018a | 12 53 06.6 | 30 18 45 | 141.7 | - | unres. |
| J12532853a | 12 53 10.7 | 28 53 26 | 35.4 | 18.3 | unres. |
| J12533018b | 12 53 15.4 | 30 18 07 | 16.6 | - | unres. |
| J12532836 | 12 53 16.0 | 28 36 47 | 6.5 | - | unres. |
| J12532850 | 12 53 18.1 | 28 50 20 | 4.2 | 0.8 | unres. |
| J12533007 | 12 53 19.2 | 30 07 23 | 6.6 | - | unres. |
| J12532859 | 12 53 19.5 | 28 59 52 | 78.4 | 82.2 | unres. |
| J12532937 | 12 53 25.6 | 29 37 00 | 29.2 | 19.5 | unres. |
| J12532921 | 12 53 28.7 | 29 21 18 | 30.1 | 15.2 | D |
| J12532936 | 12 53 29.6 | 29 36 49 | 6.9 | 4.0 | unres. |
| J12532938 | 12 53 32.3 | 29 38 30 | 36.4 | 25.0 | unres. |
| J12533025 | 12 53 40.5 | 30 25 33 | 29.6 | - | unres. |
| J12532900 | 12 53 44.3 | 29 00 00 | 1.5 | 2.0 | unres. |
| J12532930 | 12 53 46.5 | 29 30 10 | 2.1 | 1.9 | unres. |
| J12533010 | 12 53 47.1 | 30 10 07 | 11.7 | 0.8 | unres. |
| J12532854 | 12 53 47.3 | 28 54 20 | 18.3 | 20.4 | unres. |
| J12533013 | 12 53 48.6 | 30 13 55 | 2.3 | 0.8 | unres. |
| J12532841 | 12 53 49.1 | 28 41 57 | 3.0 | 0.8 | unres. |
| J12533012a | 12 53 49.6 | 30 12 38 | 16.2 | 0.8 | unres. |
| J12532853b | 12 53 49.7 | 28 53 30 | 4.4 | 5.4 | unres. |
| J12533012b | 12 53 50.1 | 30 12 57 | 12.8 | 0.8 | unres. |
| J12532848 | 12 53 54.8 | 28 48 54 | 1.4 | 0.8 | unres. |
| J12533017 | 12 53 57.7 | 30 17 51 | 3.5 | 2.4 | unres. |
| J12532935 | 12 53 58.6 | 29 35 33 | 23.4 | 17.8 | unres. |
| J12542858a | 12 54 01.8 | 28 58 13 | 3.9 | 3.2 | unres. |
| J12542927 | 12 54 03.2 | 29 27 22 | 59.3 | 44.2 | res. |
| J12542858b | 12 54 05.7 | 28 58 03 | 3.2 | 0.8 | unres. |
| J12543049 | 12 54 20.3 | 30 49 26 | 45.4 | - | unres. |
| J12543025 | 12 54 20.8 | 30 25 10 | 2.0 | 1.1 | unres. |
| J12542904 | 12 54 21.2 | 29 04 16 | 295.9 | 142.8 | HT |
| J12543011 | 12 54 21.4 | 30 11 53 | 2.6 | 2.2 | unres. |
| J12542900 | 12 54 22.1 | 29 00 48 | 230.9 | 142.4 | D |
| J12542901a | 12 54 22.9 | 29 01 02 | 110.5 | 57.9 | HT |
| J12542859 | 12 54 23.2 | 28 59 39 | 8.7 | 7.2 | unres. |
| J12542933 | 12 54 37.2 | 29 33 32 | 3.1 | 1.8 | unres. |
| J12543012 | 12 54 38.2 | 30 12 46 | 2.0 | 1.6 | unres. |
| J12543015 | 12 54 38.7 | 30 15 13 | 1.1 | 1.2 | unres. |
| J12543045a | 12 54 40.1 | 30 45 54 | 7.9 | - | unres. |
| J12542901b | 12 54 40.2 | 29 01 46 | 14.2 | 0.8 | res. |
| J12542939 | 12 54 40.6 | 29 39 15 | 5.4 | 3.1 | unres. |
| J12542913 | 12 54 41.0 | 29 13 39 | 936.7 | 538.4 | WAT |
| J12543019 | 12 54 42.6 | 30 19 28 | 5.7 | 3.5 | unres. |
| J12543045b | 12 54 42.9 | 30 45 23 | 15.3 | - | unres. |
| J12543008 | 12 54 43.8 | 30 08 39 | 1.6 | 0.8 | unres. |
| J12543028 | 12 54 46.7 | 30 28 35 | 2.7 | 1.8 | unres. |
| J12542949 | 12 54 50.4 | 29 49 24 | 292.6 | 153.0 | res. |
| J12543042 | 12 54 50.4 | 30 42 11 | 122.6 | 63.1 | WAT |
| J12542916 | 12 54 51.4 | 29 16 20 | 62.1 | 49.6 | HT |
| J12543046 | 12 54 51.6 | 30 46 53 | 60.0 | 0.8 | unres. |
| Name | RAJ2000 | DECJ2000 | S22cm | S13cm | R Morph |
|---|---|---|---|---|---|
| mJy | |||||
| J12552907 | 12 55 00.7 | 29 07 13 | 2.7 | 1.9 | unres. |
| J12553024 | 12 55 03.9 | 30 24 33 | 3.0 | 2.1 | unres. |
| J12553019 | 12 55 06.1 | 30 19 05 | 2.2 | 1.6 | unres. |
| J12553018 | 12 55 06.8 | 30 18 11 | 2.0 | 1.3 | unres. |
| J12553007 | 12 55 09.1 | 30 07 53 | 2.4 | 0.8 | unres. |
| J12552934 | 12 55 09.9 | 29 34 06 | 60.1 | 36.6 | D |
| J12553023 | 12 55 13.2 | 30 23 53 | 1.2 | 0.9 | unres. |
| J12552908 | 12 55 14.2 | 29 08 19 | 3.2 | 2.2 | unres. |
| J12552924 | 12 55 14.9 | 29 24 43 | 2.8 | 2.0 | unres. |
| J12552933 | 12 55 16.4 | 29 33 32 | 2.3 | 2.0 | unres. |
| J12552919 | 12 55 21.1 | 29 19 53 | 5.3 | 0.8 | unres. |
| J12553034 | 12 55 22.1 | 30 34 45 | 2.1 | 0.8 | unres. |
| J12553041 | 12 55 24.2 | 30 41 15 | 12.8 | - | unres. |
| J12553005 | 12 55 28.1 | 30 05 53 | 35.0 | 19.9 | unres. |
| J12552939 | 12 55 30.9 | 29 39 25 | 5.7 | 6.7 | unres. |
| J12553022 | 12 55 34.9 | 30 22 17 | 1.8 | 1.0 | unres. |
| J12552923 | 12 55 35.4 | 29 23 43 | 14.6 | 12.4 | unres. |
| J12553040a | 12 55 35.6 | 30 40 31 | 9.6 | - | unres. |
| J12552855 | 12 55 37.8 | 28 55 56 | 31.2 | 15.5 | unres. |
| J12552919 | 12 55 44.8 | 29 19 58 | 20.8 | 26.7 | unres. |
| J12552943 | 12 55 46.8 | 29 43 06 | 40.2 | - | unres. |
| J12553042 | 12 55 47.3 | 30 42 59 | 41.4 | - | unres. |
| J12553012 | 12 55 53.6 | 30 12 45 | 74.9 | 37.4 | D |
| J12553040b | 12 55 58.0 | 30 40 19 | 6.7 | - | unres. |
| J12553008 | 12 55 59.8 | 30 08 51 | 3.1 | 0.8 | unres. |
| J12563009 | 12 56 10.6 | 30 09 57 | 27.5 | see text | D? |
| J12562909a | 12 56 10.9 | 29 09 57 | 10.8 | - | unres. |
| J12562851a | 12 56 15.7 | 28 51 03 | 13.8 | - | unres. |
| J12562851b | 12 56 17.0 | 28 51 46 | 81.4 | - | res. |
| J12562852 | 12 56 17.8 | 28 52 15 | 17.1 | - | unres. |
| J12563014 | 12 56 19.2 | 30 14 39 | 3.6 | - | unres. |
| J12562909b | 12 56 24.8 | 29 09 40 | 23.2 | - | unres. |
| J12563039 | 12 56 27.3 | 30 39 05 | 3.7 | - | unres. |
| J12562912 | 12 56 28.3 | 29 12 22 | 19.5 | - | unres. |
| J12562926 | 12 56 38.9 | 29 26 40 | 31.5 | - | unres. |
| J12563040 | 12 56 48.3 | 30 40 47 | 7.1 | 0.8 | unres. |
| J12573022 | 12 57 04.3 | 30 22 29 | 17.0 | 9.3 | unres. |
| J12573026 | 12 57 08.2 | 30 26 17 | 10.1 | 16.3 | unres. |
| J12573012 | 12 57 08.3 | 30 12 05 | 2.1 | 0.8 | unres. |
| J12573047 | 12 57 13.6 | 30 47 46 | 70.0 | - | unres. |
| J12573020 | 12 57 19.6 | 30 20 47 | 3.6 | 0.8 | unres. |
| J12573021 | 12 57 22.5 | 30 21 45 | 1056.5 | 651.7 | WAT |
| J12573013 | 12 57 28.6 | 30 13 07 | 23.6 | 2.6 | res. |
| J12573011 | 12 57 33.5 | 30 11 19 | 3.2 | 0.8 | unres. |
| J12573021 | 12 57 36.3 | 30 21 45 | 1.3 | 0.8 | unres. |
| J12573030 | 12 57 53.9 | 30 30 11 | 12.1 | 3.6 | unres. |
| J12583034 | 12 58 19.5 | 30 34 30 | 46.9 | 49.9 | unres. |
| J12583027 | 12 58 26.2 | 30 27 56 | 44.3 | 25.0 | res. |
| J12583012 | 12 58 36.4 | 30 12 05 | 9.2 | - | unres. |
| J12583016 | 12 58 57.3 | 30 16 19 | 12.7 | - | unres. |
3.3 Optical identifications
We carried out the optical identifications of the radio sources in our 22 cm sample by cross-correlating the source positions with galaxies listed in the COSMOS/UKST Southern Sky Object Catalogue (Yentis et al 1992), which contains objects down to bJ = 21 and has a claimed positional accuracy of 0.25 arcsec. Given that the uncertainty due to the transposition of the sky image on the plate frame may lead to larger errors, for our study we assume a mean optical positional error of 1.5 arcsec. Since COSMOS is incomplete at faint magnitudes and could miss bright galaxies, all the radio sources were overplotted on the Digitized Sky Survey (DSS) and scrutinized by eye, so as to make sure no faint identification was missed.
Given the uncertainties in the radio and optical positions we adopt the parameter , defined as:
to assess the reliability of the optical identifications. In the above formula, is the positional offset, is the galaxy position error and is the uncertainty in the radio position. For point-like radio sources we consider as reliable identifications all matches with . The list of the radio-optical identifications is given in Table 4, where we report the radio and optical name (column 1), J2000 radio and optical coordinates (columns 2 and 3), radio flux densities and bJ mag (column 4), 22 cm radio power logP22cm and absolute magnitude BJ (column 5), radio morphology and optical type (column 6), and the radial velocity (column 7).
For five extended radio sources we found (see notes to Table 5 and Section 4.1). However, we consider them reliable identifications, given the extension of the radio emission and the large extent of the underlying galaxy.
We found 32 optical counterparts i.e. 30% of our sample. Nine radio galaxies are located in the Shapley Concentration, one is a background galaxy aligned with A3528 but located in A3532, and the distance of the remaining 22 counterparts is unknown. Figure 3 shows the distribution of the radio sources in the A3528 complex while in Figure 4 we report the distribution of the A3528 optical galaxies in velocity space (versus declination).

| Radio Name | RAJ2000 | DECJ2000 | S22cm | logP22cm | Radio Type | |
|---|---|---|---|---|---|---|
| mJy | W Hz-1 | |||||
| Opt. Name | RAJ2000 | DECJ2000 | BJ | Opt. Type | v (km s | |
| J12532859 | 12 53 19.5 | 28 59 52 | 78.4 | 0.89 | ||
| 12 53 19.4 | 28 59 53 | 19.64 | ||||
| J12532937 | 12 53 25.6 | 29 37 00 | 29.2 | 0.91 | ||
| 12 53 25.7 | 29 37 01 | 19.21 | ||||
| J12532938 | 12 53 32.3 | 29 38 30 | 36.4 | 1.33 | ||
| 12 53 32.3 | 29 38 33 | 19.87 | ||||
| J12533025 | 12 53 40.5 | 30 25 33 | 29.6 | 0.88 | ||
| 12 53 40.4 | 30 25 34 | 20.38 | ||||
| J12532841 | 12 53 49.1 | 28 41 57 | 3.0 | 1.47 | ||
| 12 53 48.9 | 28 41 57 | 19.34 | ||||
| J12542858b | 12 54 05.7 | 28 58 03 | 3.2 | 2.39 | ||
| 12 54 05.6 | 28 58 07 | 17.33 | ||||
| J12542904 | 12 54 21.2 | 29 04 16 | 295.9 | 23.96 | Ext | 7.88 (a) |
| #2063 | 12 54 20.3 | 29 04 08 | 16.88 | 19.21 | 16521 | |
| J12542900 | 12 54 22.1 | 29 00 48 | 230.9 | 23.84 | D | 0.67 (b) |
| #2209 | 12 54 22.1 | 29 00 47 | 14.61 | 21.46 | db | 16336 |
| J12542901a | 12 54 22.9 | 29 01 02 | 110.5 | 23.52 | HT | 1.39 (c) |
| 12 54 22.9 | 29 01 00 | 16.5 | 19.56 | db | 16319 | |
| J12542859 | 12 54 23.2 | 28 59 39 | 8.7 | 0.89 | ||
| 12 54 23.2 | 28 59 41 | 20.23 | ||||
| J12542901b | 12 54 40.2 | 29 01 46 | 14.2 | 22.62 | 3.03 (d) | |
| #2354 | 12 54 40.6 | 29 01 48 | 17.29 | 18.71 | 15849 | |
| J12542913 | 12 54 41.0 | 29 13 39 | 936.7 | 24.48 | WAT | 0.33 (e) |
| #2370 | 12 54 41.0 | 29 13 39 | 14.32 | 21.82 | 16923 | |
| J12543019 | 12 54 42.6 | 30 19 28 | 5.7 | Ris | 1.33 | |
| 12 54 42.6 | 30 19 31 | 14.08 | S0? | |||
| J12543042 | 12 54 50.4 | 30 42 11 | 122.6 | WAT? | (f) | |
| 12 54 50.1 | 30 42 14 | 23.04 | 2.60 | |||
| 12 54 50.3 | 30 42 12 | 20.12 | 0.45 | |||
| J12542916 | 12 54 51.4 | 29 16 20 | 62.1 | 23.17 | HT | 7.61 (g) |
| #2616 | 12 54 52.4 | 29 16 16 | 15.82 | 19.98 | 14443 | |
| J12552907 | 12 55 00.7 | 29 07 13 | 2.7 | 22.14 | 1.23 | |
| #2607 | 12 55 00.6 | 29 07 15 | 18.49 | 18.14 | 21193 | |
| J12553018 | 12 55 06.8 | 30 18 11 | 2.0 | 1.06 | ||
| 12 55 06.7 | 30 18 12 | 21.65 | ||||
| J12552934 | 12 55 09.9 | 29 34 06 | 60.1 | D | (h) | |
| 12 55 10.6 | 29 34 06 | 21.87 | Q? | 5.10 | ||
| 12 55 09.3 | 29 34 06 | 19.61 | Q? | 4.37 |
| Radio Name | RAJ2000 | DECJ2000 | S22cm | logP22cm | Radio Type | |
|---|---|---|---|---|---|---|
| mJy | W Hz-1 | |||||
| Opt. Name | RAJ2000 | DECJ2000 | BJ | Opt. Type | v (km s | |
| J12552933 | 12 55 16.4 | 29 33 32 | 2.3 | 2.09 | ||
| 12 55 16.2 | 29 33 35 | 19.78 | ||||
| J12552919 | 12 55 21.1 | 29 19 53 | 5.3 | 2.71 | ||
| 12 55 21.4 | 29 19 56 | 20.04 | ||||
| J12553040a | 12 55 35.6 | 30 40 31 | 9.6 | 0.79 | ||
| 12 55 35.5 | 30 40 32 | 21.62 | ||||
| J12553012 | 12 55 53.6 | 30 12 45 | 74.9 | 1.48 | ||
| 12 55 53.4 | 30 12 44 | 20.00 | ||||
| J12553040b | 12 55 58.0 | 30 40 19 | 6.7 | 2.23 | ||
| 12 55 58.1 | 30 40 15 | 22.63 | ||||
| J12562851a | 12 56 15.7 | 28 51 03 | 13.8 | 0.79 | ||
| 12 56 15.8 | 28 51 03 | 20.41 | ||||
| J12562851b | 12 56 17.0 | 28 51 46 | 81.4 | 2.18 | ||
| 12 56 17.2 | 28 51 49 | 20.58 | ||||
| J12562852 | 12 56 17.8 | 28 52 15 | 17.1 | 1.94 | ||
| 12 56 17.8 | 28 52 11 | 20.71 | ||||
| J12563014 | 12 56 19.2 | 30 14 39 | 3.6 | 22.02 | 1.00 | |
| #3577 | 12 56 19.2 | 30 14 41 | 17.19 | 18.82 | 15950 | |
| J12563040 | 12 56 48.3 | 30 40 47 | 7.1 | 1.32 | ||
| 12 56 48.4 | 30 40 49 | 21.89 | ||||
| J12573022 | 12 57 04.3 | 30 22 29 | 17.0 | 22.71 | 0.05 | |
| #4182 | 12 57 04.3 | 30 22 29 | 16.48 | 19.57 | 16251 | |
| J12573047 | 12 57 13.6 | 30 47 46 | 70.0 | 2.34 | ||
| 12 57 13.3 | 30 47 47 | 18.89 | ||||
| J12573021 | 12 57 22.5 | 30 21 45 | 1056.5 | 24.51 | WAT | 8.90 (i) |
| #4327 | 12 57 21.3 | 30 21 48 | 14.49 | 21.60 | db | 16540 |
| J12583034 | 12 58 19.5 | 30 34 30 | 46.9 | 1.19 | ||
| 12 58 19.4 | 30 34 31 | 18.17 |
Notes to Table 4.
and see the comments on the radio properties of the radio galaxies in the A3528 complex in Section 4.1.
R = 3.03 for this identification, however we consider it reliable since the radio emission is extended (see Table 3) and the optical counterpart falls within the radio isodensity contours.
(f) This identification is unclear. We tentatively classified the radio source as a WAT. See comments on the extended background sources in the A3528 region in Section 4.2.
(h) On the basis of the 13 cm image we classify this radio source as a background FRII. The two optical counterparts given here are located in the vicinity of the assumed core (see Section 4.2).

4 The radio emission in the A3528 region
Most of the Shapley radio galaxies (6/9) belong to A3528, two are located in A3532, and the remaining one is located in a peripheral region between A3530 and A3532. It is noteworthy that we detect no radio emission from the core of A3530, despite the presence of optically peculiar galaxies in its centre. We also note the lack of radio sources between the centres of A3530 and A3532. Given the good spatial coverage of our survey, this can not be attributed to a decrease in sensitivity in this region. From Figure 3 and Figure 4 it is clear that most radio galaxies in the A3528 complex are located in the densest optical regions.
All radio galaxies in the A3528 chain have logP22cm (W Hz 22, and the radio power for two of them, namely J12542913 in A3528S and J12573021 in A3532, is close to the transition between FRI and FRII radio galaxies (Fanaroff & Riley 1974).
4.1 Extended radio galaxies in the A3528 complex
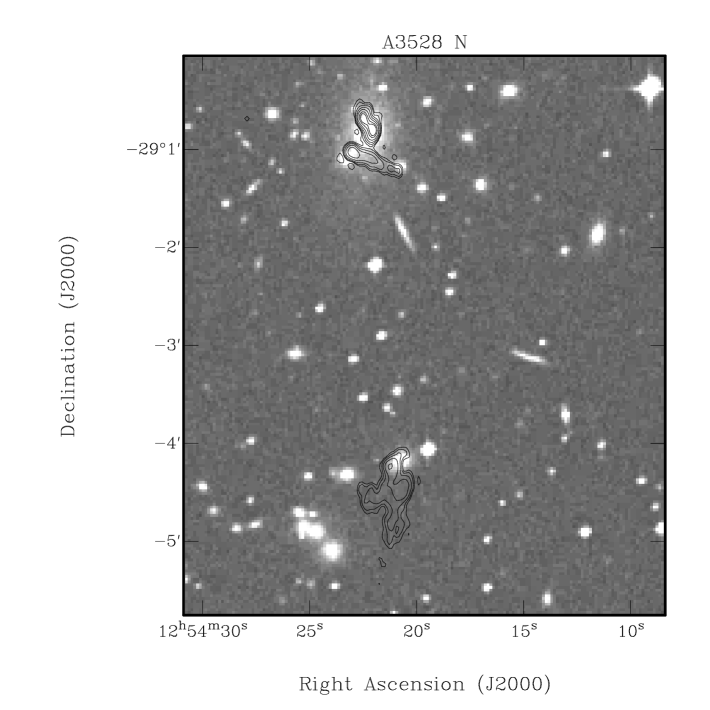
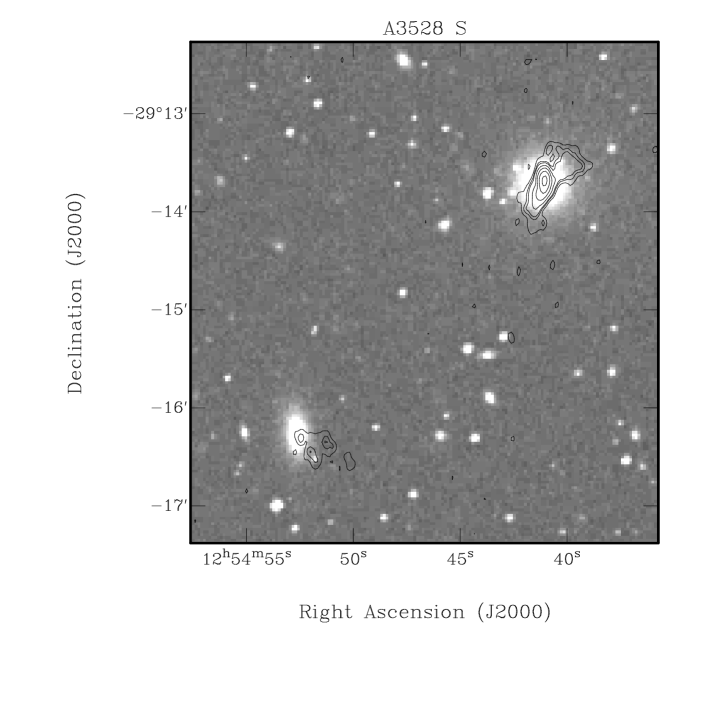
In Figures 5 and 6 we show the 13 cm images of the central regions of A3528N and A3528S respectively, overlaid on the DSS optical image. Three extended radio galaxies are located in the northern component A3528N, namely J12542904, J12542900 and J12542901a, and two more are located in A3528S, i.e. J12542913 and J12542916. While all radio galaxies in A3528N are very close in velocity space, the two in A3528S are separated by 2500 km s-1 and possibly belong to two different groups in A3528S (see Table 4).
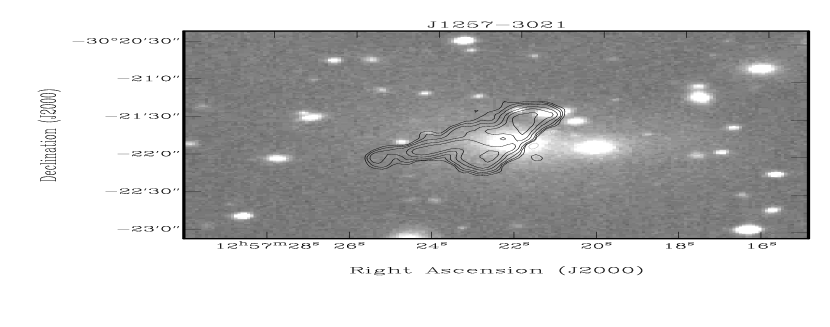
Another extended radio galaxy, J12573021, is associated with one of the two nuclei in the dumb-bell system dominating A3532.
Here we will briefly summarise the most relevant physical properties of these six extended radio galaxies on the basis of our 22 cm and 13 cm observations and then compare them with the properties of the intracluster gas as derived from the X-ray observations.
4.1.1 Morphologies and radio properties
J12542900 (Fig. 5) is associated with the dominant cD galaxy in A3528N and is completely embedded within the envelope of the optical galaxy. RHP98 classified this source as double, and high resolution and high frequency observations carried out with the VLA and ATCA (Venturi et al., in preparation) confirm that it is a mini-FRII radio source, with a radio nucleus and two jets culminating in hot spots, though its total power falls within the range of FRI radio galaxies. The source has a moderately steep spectrum over the frequency range of our observations, i.e. .
J12542901a was classified as a head-tail radio galaxy by RHP98, who also postulated that the radio source may have been triggered by the galaxy’s passage close to the cluster centre. Inspection of the superposition between the radio image and the Digitised Sky Survey (Fig. 5) reveals that the radio peak is displaced from the centre of the optical counterpart. This is most likely a resolution effect, i.e. the nucleus of the radio emission is not coincident with the peak of our 22 cm and 13 cm images, but it could also be interpreted as an extreme effect of ram pressure exerted on the radio emission due to the galaxy motion through the very dense medium in the centre of A3528N. The source is extended kpc east-west. The total spectral index of this source, computed in the range of frequencies presented in this paper, is . We point out that it should be considered an upper limit, since the lack of short spacings at 13 cm is likely to lead to an underestimate of the extended flux density. Furthermore the incomplete separation of this source from J12542900 at 22 cm adds uncertainties in the 22 cm flux density.
J12542904 (Fig. 5) is a very interesting radio galaxy in A3528N. The source is 4 arcmin away from the cluster centre, in the region where the shock front between the two merging systems A3528N and A3528S is expected to be located (S96). The 13 cm image shows an extension in the direction of the galaxy #2063 (see also Figure 3 in RHP98). On the assumption that this is the host galaxy we classify the radio source as a narrow-angle tail. This hypothesis is confirmed by observations at higher frequency and resolution (Venturi et al., in preparation), where the radio core is clearly detected. We therefore confirm the reliability of the tentative optical identification proposed by RHP98. The source is extended 1.5 arcmin (i.e. kpc). Its spectrum is steep in the range 1322 cm, i.e. , and flattens at lower frequencies. If we consider the VLA 92 cm flux density (S96) and the MOST 36 cm data (RHP98) we derive and . We stress that the spectral index should be considered only an upper limit to its true value, since its extended morphology suggest that we may have lost extended flux at 13 cm due to the poor short spacing u-v coverage of the present observations.
J12542913 (Fig. 6) is the second most powerful radio galaxy in the A3528 complex and it is associated with the dominant cD galaxy in A3528S. The radio source is dominated by a strong compact component surrounded by extended emission whose shape is reminiscent of wide-angle tail sources (see also RHP98). Its size, kpc, barely exceeds the optical extent of the associated galaxy. Using the data at other wavelengths available in the literature (RHP98 and S96) we derive a spectral index , constant within the errors, in the range 9213 cm.
J12542916 is the weakest extended radio galaxy in the A3528 complex. The higher resolution 13 cm image (Fig. 6), together with the 92 cm VLA image from S96, suggests that the source is a head-tail, with a faint compact component coincident with the associated cluster galaxy. Higher frequency and resolution observations (Venturi et al. in preparation) confirm that this is the nucleus of the radio galaxy. From our flux density measurements we derived a total flat spectrum with . The source has low surface brightness and diffuse morphology in both bands presented in this paper, and comparison with the 20 cm total flux density obtained from inspection of the NVSS suggests that we may have lost extended flux both at 22 cm and 13 cm. For this reason we believe that the derived spectral index should be taken with care. We point out that for the other extended sources we are presenting in this section, the NVSS 20 cm and the ATCA 22 cm flux density measurements are in good agreement (see Section 3.2). Given the uncertainty in the spectral index value, we defer any estimate of the physical parameters in J12542916 to a future paper.
J12573021 is the most powerful radio galaxy in the A3528 complex, and is associated with the brighter nucleus of the dumbell galaxy located at the centre of A3532 (see Figure 7). Its radio morphology is intermediate between FRI and FRII radio galaxies, consistent with its 22 cm total radio power. The peculiar asymmetric shape of the tails suggests that it could be a wide-angle tail source with its emission in a plane closely aligned with the line of sight to the observer. The core of the radio emission is undetectable both at 22 cm and in the full resolution 13 cm image. We used the 6 cm flux density value for this source given in Gregorini et al. (1994), and computed the spectral index over the range 622 cm, obtaining , typical for this type of radio source.
4.1.2 Comparison with the properties of the intracluster gas
In order to derive estimates of the physical conditions in the relativistic plasma for the radio galaxies presented in this section, we computed the equipartition values of the magnetic field Beq, energy density Ueq and internal non-thermal pressure Peq assuming a cylindrical geometry, a filling factor =1 and a ratio between protons and electrons K=1. The values we computed are given in Table 5. We point out that these are global values, and refer to the whole source. We did not include J12542916 because of the major uncertainties in the spectral index value. For all the remaining extended sources we adopted the value given above for each source. The dependance of Beq and Peq on the spectral index is not critical, so even though the values we derived for should be considered upper limits, the estimates of the intrinsic physical parameters are not affected significantly.
| Source | Beq | Peq | Pgas |
|---|---|---|---|
| 10-6 G | 10-11 dyn cm-2 | 10-11 dyn cm-2 | |
| J12542900 | 4.5 | 0.13 | 5.2 |
| J12542901a | 2.7 | 0.047 | 4.5 |
| J12542904 | 1.6 | 0.016 | 1.0 |
| J12542913 | 4.3 | 0.11 | 7.5 |
| J12573021 | 4.5 | 0.13 | * |
Our estimates for the equipartition parameters for all radio galaxies given in Table 5 fall within the range of values found for a sample of tailed radio galaxies in clusters (Feretti, Perola & Fanti 1992). We note that in the case of J12542904 the values we found are amongst the lowest.
For comparison with the equipartition parameters, in Table 5 we also report the thermal pressure of the intracluster gas at the projected distance of the radio galaxies with respect to the cluster centre, derived from Henriksen & Jones (1996) and scaled for our choice of cosmological parameters. None of the radio galaxies is in pressure equilibrium with the external thermal gas. For J12542900 and J12542913 projection effects are expected to be negligible, since they are both associated with the dominant galaxies in A3528N and A3528S respectively, so we believe that the derived unbalance is real. The case for J12542904 is most dramatic even accounting for projection effects, since Peq and Pgas differ by almost two orders of magnitude. Assuming the gas distribution given by Henriksen & Forman (1996), J12542904 would be in pressure equilibrium with the external gas at arcmin from the cluster centre, i.e. 1.3 Mpc. No information is available in the literature for the temperature and gas density distribution in A3532.
A more detailed analysis will be possible with XMM observation already awarded for this cluster complex.
4.2 Extended background sources in the A3528 region
Among the extended background sources revealed in the A3528 field, three exhibit a peculiar morphology. In this section we describe them and present their global properties.
4.2.1 J12543042 and J12552934
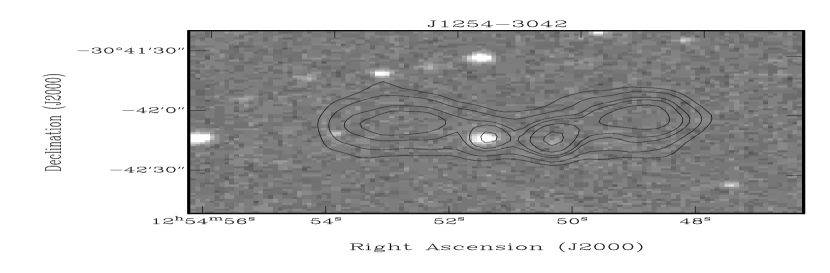
The 22 cm image of the radio source J12543042, shown in Figure 8, is suggestive of a double-double type morphology (Lara et al. 1999) in the shape of a wide-angle tail, however the optical identification is unclear, since two very faint objects coincide with the two inner peaks of the radio emission (see Table 4). From the 13 cm natural weighted image shown in Figure 9, it is clear that the source is very asymmetric in this band, with the eastern lobe much fainter than the western one.
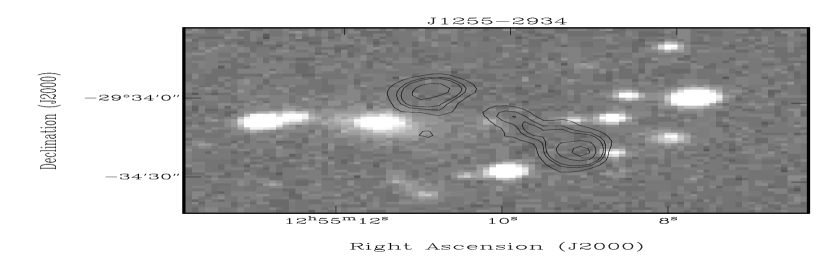
J12552934 has a typical FRII morphology, with a one-sided jet and two hotspots with similar flux density. The full resolution 13 cm image is given in Figure 10. A very faint optical counterpart (see Table 4) is visible, close to the central radio peak between the two hot spots, but the identification with this object is uncertain. It is possible that the counterpart responsible for the radio emission is an absorbed high redshift galaxy.

4.2.2 The extended unidentified radio source J12563009
The 22 cm radio density contours of J12563009 are shown in Figure 11, superimposed on the DSS optical frame.
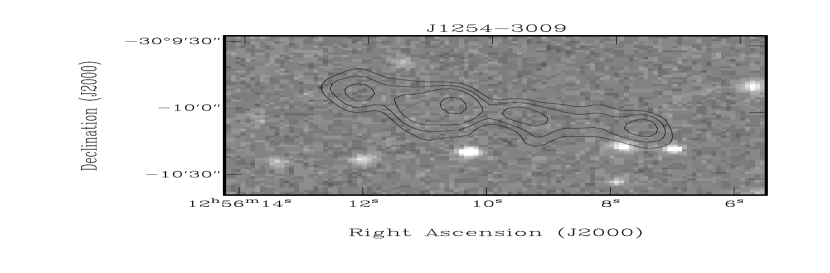
This radio source has a linear morphology, with an extension of 1.5 arcmin. It is located north of the axis connecting the centres of A3530 and A3532, at a distance of from the centre of A3530 and from the centre of A3532. The DSS optical image shows the presence of a few faint optical objects in the vicinity of the radio emission, but none of them is obviously associated with the radio source. Unfortunately the source was not detected at 13 cm, possibly because of its low surface brightness combined with lower sensitivity at its distance from the field centre (field #3), therefore no hint on its nature can be derived from the spectral index information. The source could be a double-double powerful radio galaxy associated with a distant object fainter than the DSS limit. Another possibility is that J12563009 is diffuse cluster emission within the Shapley Concentration. On this hypothesis the source would be 60 kpc in extent, with a power logP22cm (W Hz-1) = 22.87. We point out that J12563009 lies in the region where a merging shock due to the interaction between A3530 and A3532 is expected. We plan to extend our study of this source in order to disentangle its nature.
5 Statistical Investigations
5.1 Radio source counts
Because of the primary beam attenuation, the sensitivity of our observations is a function of the distance from the centre of each field. For this reason our survey is not complete at a flux density limit of 0.8 mJy. In order to carry out our statistical investigations, we restricted our study to all radio sources within a radius of 17.5 arcmin from each field centre, with flux density S 1.6 mJy. At such distance, the primary beam attenuation implies a flux density correction of a factor of 2, so sources with uncorrected S22cm = 0.8 mJy have a true flux density of 1.6 mJy. This complete sample contains 58 radio sources detected within an area of 1.04 deg2.
The LogN-LogS for the A3528 complex, computed in the flux density range 11440 mJy, is shown in Figure 12. The errors are poissonian. The solid line in Figure 12 represents the normalized LogN-LogS for the background (Prandoni et al. 1999) taken from a 22 cm ATCA survey, covering an area of 25.82 deg2 and counting a total of 1752 radio sources above the flux density limit S22cm = 1 mJy.
Inspection of Figure 12 suggests that the two distributions have similar shapes, and we conclude that the number of radio sources in the A3528 complex is in good agreement with the background radio source counts. We found 54 sources above a flux density of 2 mJy, consistent with the 48 expected from the background counts.
We note that the optical bidimensional overdensity of the A3528 complex, with respect to the background in a nearby region, is 2.5. This means that if the radio emission probability per galaxy remained constant in the Shapley Concentration with respect to the field, we would expect to detect a significant excess at above the background.
We conclude that the radio source counts in the A3528 complex are dominated by the background counts. This result is similar to that obtained for the A3558 complex (Paper III), the other major cluster merger in the core of the Shapley Concentration.

5.2 Radio luminosity function
The influence of the environment on the radio properties of galaxies should reflect on the radio luminosity function (RLF), changing either its shape or the normalisation. In order to test if the merger in the A3528 complex affects the probability of a galaxy to develop a radio source, we computed the RLF for the early-type galaxies in this region, for comparison with the RLF computed by LO96 for a complete sample of Abell clusters, and with that derived for the A3558 complex in the Shapley Concentration (Paper III).
All nine radio galaxies in this region satisfy the criteria adopted in Paper III for a straightforward comparison with LO96, i.e. optical counterpart brighter than B and S 2.2 mJy (see Paper III for details). Therefore, we could use all of them in the computation of the RLF. At the distance of the A3528 complex S mJy corresponds to logP22cm(W Hz-1) = 21.78.
For the galactic absorption we adopted a mean value of 0.3, obtained from the maps of Burnstein & Heiles (1984). The corresponding magnitude limit for the A3528 complex is therefore bJ = 17.70.
Inspection of Table 4 shows that two radio sources with S mJy are associated with galaxies with b 17.40 but without redshift information. In particular, J12542858b is associated with a bJ = 17.33 magnitude galaxy and J12543019 with a bJ = 14.08 object. Given their optical magnitudes and using the spectroscopic data available in this region, we determined the probability that these two galaxies belong to the Shapley Concentration as 70% and 66% respectively. We therefore consider them Shapley galaxies and include them in the computation of RLF. Assuming they are located at the average redshift of the A3528 complex, i.e. v = 16000 km s-1 (see Section 2), we derived power of logP22cm (W Hz-1) = 21.98 and 22.24 for J12542858b and J12543019 respectively. To summarise, we used 11 radio galaxies for the computation of RLF.
For the normalisation of the RLF we counted all galaxies brighter than bJ = 17.70 and 13000 19000 km s-1 within a radius of 32 arcmin from each pointing centre, and covered the whole region of our radio observations (see Figure 2). There are two sources of errors in the proper number of galaxies.
(a) Of the 124 candidate galaxies in our surveyed region, only 114 have a measured redshift. Of these, the number with a measured velocity in the range of the Shapley Concentration is 89. Assuming that the fraction of Shapley galaxies remains the same for the remaining 10 galaxies without redshift, we conclude that there are 97 galaxies.
(b) Another problem concerns the fraction of early-type galaxies, since a morphological classification is uncertain at this distance. A galaxy-type classification based on the optical spectra carried out on a subsample of galaxies in the A3528 complex (Baldi et al., in preparation), shows that only half of them are early type.
For these reasons we computed two RLFs, the first assuming that all 97 galaxies are early type, and the second assuming that only a fraction of 50%, i.e. 49, is early type. We are aware these are two extreme cases. However, it seems reasonable that the true RLF lies within these two limits. The results of our analysis are given in Table 6, where the fractional and integral RLF for the two cases is reported. The RLF is plotted in Figure 13, where the shaded region represents the area where the true RLF is located. The lower envelope represent the case where all galaxies are early type, while the upper envelope corresponds to the case of 50% early-type galaxies.
| logP22 | Fractional RLF | Integral RLF | Fractional RLF | Integral RLF |
|---|---|---|---|---|
| (no late type) | (no late type) | (50% late type) | (50% late type) | |
| 21.7822.18 | 0.113 | 2/49 | 0.224 | |
| 22.1822.58 | 0.093 | 1/49 | 0.184 | |
| 22.5822.98 | 0.082 | 2/49 | 0.163 | |
| 22.9823.38 | 0.062 | 1/49 | 0.122 | |
| 23.3823.78 | 0.052 | 1/49 | 0.102 | |
| 23.7824.18 | 0.041 | 2/49 | 0.082 | |
| 24.1824.58 | 0.021 | 2/49 | 0.041 |
For comparison, the luminosity function derived by LO96 for Abell clusters is also given in Figure 13 (triangles). The two RLFs are in good agreement in the power range 21.78 logP 24.58, both in shape and normalisation. We note a lack of radio galaxies with logP22 (W Hz 24.58 in the A3528 complex.

6 Discussion and Conclusions
This work is part of a larger ongoing project, whose main purpose is to study the effects of cluster mergers on the statistical properties of radio galaxies, and on the formation of cluster-type radio sources, such as radio halos and relics, which are believed to be related to major merger events. The target of our study is the central region of the Shapley Concentration, the largest supercluster in the nearby Universe, where spectroscopic and X-ray observations lend support to earlier suggestions that cluster mergers play a major role (see for instance Raychaudhury 1991, Zucca et al. 1993, Ettori et al. 1997, Bardelli et al. 1998, Bardelli et al. 2000).
The results of our 22 cm ATCA survey in the A3528 complex can be summarised as follows:
(a) The radio properties of the three clusters in the chain differ markedly from one other. A3528, considered to be a pre-merging cluster, is very active at radio wavelengths, with five extended and distorted radio galaxies located at the centres of its two subcondensations. Conversely, we detected no radio sources from A3530 or from the region between the cores of A3530 and A3532, where a merger shock is expected.
(b) The radio source counts are consistent, within the uncertainties, with the background counts down to the mJy level, implying that the radio source density does not scale with the optical density, which is a factor of 2.5 higher in the A3528 complex compared to the local background. This result is similar to what we obtained for the merging cluster complex A3558 (Paper III), and confirms our earlier conclusions that the radio source counts do not trace the underlying optical density. Therefore, very high density regions would not be spotted on the basis of radio surveys.
(c) The radio luminosity function for early-type galaxies is consistent, within the errors, with the RLF derived by LO96 for a large sample of cluster ellipticals. This suggests that the dense and unrelaxed environment of the A3528 region has no influence on the probability of an elliptical galaxy to become a radio source.
It is interesting to compare this result with the RLF obtained for the A3558 merging complex, which is significantly lower than LO96 (Paper III). We propose that the different shapes and normalisations of the RLF in these two complexes of merging clusters are due to the different stages of the merger itself.
On the basis of the gas temperature gradients within A3528, S96 first proposed that A3528 is an early merger, where A3528N and A3528S have not yet undergone a major core-to-core encounter. More recently Bardelli et al. (2000) reinforced this assessment from a bi- and tri-dimensional analysis of clusters and groups in this region, emphasising that the central parts of the individual galaxy clusters in the chain are not far from virialization, and further suggesting that the effects of the merger are not yet evident on the galaxy population and cluster dynamics. The good agreement between the RLF derived in this paper for the A3528 cluster region and that for early type galaxies in Abell clusters could be interpreted in the light of Bardelli et al. (2000), i.e. the early stage of the merger has not yet affected the radio properties of cluster galaxies, which behave remarkably similarly to ellipticals in other environments.
The situation in the A3558 region is quite different, since the observational evidence suggests that the cluster complex has already undergone the first core-to-core encounter for two massive clusters, and further accretion of small groups is at an advanced stage (Bardelli et al. 1998b). The excess of blue galaxies in the position where a shock front in the merging structure is expected, and the RLF lower than LO96, could be interpreted as the effects of the advanced merger, which has already had time to affect the galaxy optical and radio emission properties. One implication of this interpretation is that a cluster merger ultimately anticorrelates with the probability of a galaxy developing a radio source, either by switching off previously existing radio galaxies or inhibiting the formation of radio-loud AGNs.
Aknowledgments
We warmly thank Dr. Isabella Prandoni for insightful discussions and for providing data before publication.
T.V. acknowledges the receipt of the CNR-CSIRO grant Prot. N. 088864. The Australia Telescope Compact Array is operated by the CSIRO Australia Telescope National Facility.
The Australia Telescope Compact Array is operated by the Australia Telescope National Facility.
References
- [1] Abell G.O., Corwin H.G. Jr, Olowin R.P., 1989, ApJS, 70, 1
- [2] Bardelli S., Zucca E., Malizia A., Zamorani G., Vettolani G., Scaramella R., 1996, A&A 305, 435
- [3] Bardelli S., Zucca, E., Zamorani, G., Vettolani, G., Scaramella, R., 1998a, MNRAS, 296, 599
- [4] Bardelli S., Pisani A., Ramella M., Zucca E., Zamorani G., 1998b, MNRAS 300, 598
- [5] Bardelli S., Zucca E. & Baldi A., 2000, MNRAS, in press
- [6] Bardelli S., Zucca E., Zamorani G., Moscardini L., Scaramella R., 2000, MNRAS 312, 540
- [7] Bekki K., 1999, ApJL, 510, L15
- [8] Burnstein D., Heiles C., 1984, ApJS 54, 33
- [9] Condon J.J., Cotton W.D., Greisen E.W., F. Yin, 1998, AJ 115, 1693
- [10] Dwarakanath K.S., Owen F.N., 1999, AJ 118, 625
- [11] Gregorini L., de Ruiter H.R., Parma P., Sadler E.M., Vettolani G., Ekers R.D., 1994, A&A, 106, 1
- [12] Ettori S., Fabian A.C., White D.A., 1997, MNRAS 289, 787
- [13] Fanaroff B.L., Riley J.M., 1974, MNRAS, 167, 31
- [14] Feretti L., Perola G.C. & Fanti R., 1992, A&A 265, 9
- [15] Henriksen M. & Jones C., 1996, ApJ, 465, 666
- [16] Kull A., Böhringer H., 1999, A& A, 341, 23
- [17] Lara L., Marquez I., Cotton W.D., Feretti L., Giovannini G., Marcaide J.M., Venturi T., 1999, A&A, 348, 699
- [18] Ledlow M.J. & Owen F.N., 1996, AJ, 112, 9 (LO96)
- [19] Owen F.N., Ledlow M.J., Keel W.C., Morrison G.E., 1999, AJ 118, 633
- [20] Prandoni I., Gregorini L., Parma P., de Ruiter H., Vettolani G., Wieringa M.H., Ekers R.D., 1999, in Looking Deep into the Southern Sky, Eds. R. Morganti & W.J. Couch, Springer, p. 114
- [21] Prandoni I., Gregorini L., Parma P., de Ruiter H., Vettolani G., Wieringa M.H., Ekers R.D., 2000a, A&AS, 146, 41
- [22] Prandoni I., Gregorini L., Parma P., de Ruiter H., Vettolani G., Wieringa M.H., Ekers R.D., 2000b, A&AS, 146, 31
- [23] Quintana H., Ramirez A., Melnick J., Raychaudhury S., Szelak E., 1995, AJ, 110, 463
- [24] Raychaudhury S., Fabian A.C., Edge A.C., Jones C., Forman W., 1991, MNRAS, 248, 101
- [25] Reid A.D., Hunstead R.W., Pierre M.M., 1998, MNRAS, 296, 531 (RHP98)
- [26] Roettiger K., Burns J.O., Loken C., 1996 ApJ 473, 651
- [27] Sarazin C.L., 1999, ApJ 520, 529
- [28] Sault R.J., Teuben P.J. & Wright M.C.H., 1995 in Astronomical Data Analysis Software and Systems IV eds. R. Shaw, H.E.Payne and J.J.E.Hayes, Astronomical Society of the Pacific Conference Series 77, 433
- [29] Schindler S., 1996, MNRAS, 280, 309 (S96)
- [30] Venturi T., Bardelli S., Morganti R., Hunstead R.W., 1997, MNRAS, 298, 1113 (Paper II)
- [31] Venturi T., Bardelli S., Morganti R., Hunstead R.W., 2000, MNRAS, 314, 594 (Paper III)
- [32] White D.A., Jones C., Forman W., 1997, MNRAS 292, 419
- [33] Wieringa M.H. & Kesteven M.J., 1992, ATCA Technical Document Series, 39.2010
- [34] Yentis D.J., Cruddace R.G., Gursky H., Stuart B.V., Wallin J.F., MacGillivray H.T., Collins C.A., 1992, in MacGillivray H.T., Collins C.A. eds, Digitized Optical Sky Surveys, Kluwer, Dordrecht, p.67