Hi deficiency in the galaxy cluster ACO 3627
ATCA 21 cm Hi observations of the rich galaxy cluster ACO 3627 in the Great Attractor region are presented. Three fields of 30′ diameter located within one Abell radius of ACO 3627 were observed with a resolution of 15′′ and an rms noise of 1 mJy/beam. Only two galaxies were detected in these fields. We compare their Hi distribution to new optical R-band images and discuss their velocity fields. The first galaxy is a gas-rich unperturbed spiral whereas the second shows a peculiar Hi distribution. The estimated 3 Hi mass limit of our observations is M⊙ for a line width of 150 km s-1. The non-detection of a considerable number of luminous spiral galaxies indicates that the spiral galaxies are Hi deficient. The low detection rate is comparable to the Hi deficient Coma cluster (Bravo-Alfaro et al. 2000). ACO 3627 is a bright X-ray cluster. We therefore suspect that ram pressure stripping is responsible for the Hi deficiency of the bright cluster spirals.
Key Words.:
Galaxies: interactions – Galaxies: ISM – Galaxies: kinematics and dynamics1 Introduction
Spiral galaxies in clusters are Hi deficient compared to similar galaxies (equivalent size and morphological type) in the field (see, e.g., Chamaraux et al. 1980). In the Virgo cluster, the Hi gas is stripped in the outer regions of spiral galaxies, an effect which is more pronounced for central spirals (Cayatte et al. 1990). The same tendency was observed for galaxies in the Coma cluster (Bravo-Alfaro et al. 2000). Hi deficiency seems correlated with the X-ray luminosity of clusters (Giovanelli & Haynes 1985; see however Solanes et al. 2000).
In this context, the cluster ACO 3627 provides an excellent probe for further studies of environmental effects. ACO 3627 has recently been identified as a nearby massive galaxy cluster behind the Milky Way (Kraan-Korteweg et al. 1996). Its position in velocity space of (km s-1) – only 9o from the predicted center of the Great Attractor (Kolatt et al. 1995) – makes ACO 3627 the most massive known cluster in the Great Attractor region. It is comparable in cluster mass and richness to the Coma cluster (Woudt 1998) but located one and a half times closer to us.
ACO 3627 also has an X-ray luminosity comparable to that of the Coma cluster (Böhringer et al. 1996). Its X-ray distribution is not spherically symmetric, but shows indications of an ongoing cluster merger (Böhringer et al. 1996, Tamura et al. 1998). We therefore expect that its spiral galaxies might be Hi deficient – similar to the spirals of the Coma cluster. This suspicion and the existence of a fairly large number of spiral galaxies make this cluster an ideal candidate for Hi deficiency studies of its cluster population.
The proximity of ACO 3627 to the Galactic plane impedes a complete and unbiased study of ACO 3627 in the optical (Woudt 1998). 21 cm observations are, however, not affected by the dust in the cluster area. Various pointed Hi observations have been obtained for the optically identified spiral galaxies in the ACO 3627 area to noise levels of typically 3-5 mJy (Kraan-Korteweg et al. 1997). In addition, the southern Zone of Avoidance is being searched systematically for galaxies in Hi with the multi-beam receiver on the 64 m Parkes radiotelescope (cf. Henning et al. 1999, Henning et al. 2000 for results from the shallow survey, and Kraan-Korteweg & Juraszek 2000 for first results in the Great Attractor region from the full-sensitivity survey). As this survey is limited to Galactic latitudes of it covers, however, only a very small fraction of the ACO 3627 cluster within its Abell radius.
To complement the above described single dish observations, we obtained detailed 21 cm line images using the Australia Telescope Compact Array (ATCA). Three fields were observed within the Abell radius of the cluster ACO 3627, plus an additional field in the outskirts of the cluster (to a noise level of about 1 mJy/beam) to study the effects of the cluster environment on its members in different parts of the cluster. Unfortunately, one of the strongest known extragalactic radio sources is located at the center of the cluster, i.e. the wide-angle-tail (WAT) radio galaxy B1610–608 (see Jones & McAdam 1996 for a detailed discussion), making the analysis of the data of the central ATCA field quite difficult.
The observations and the data reduction procedures are presented in Sect. 2. The Hi detections are shown and discussed in Sect. 3. In Sect. 4, we compare our detection rate with the detection rate of the Coma cluster as derived from VLA observations (Bravo-Alfaro et al. 2000). The conclusions are given in Sect. 5.
We assume a distance of 79 h Mpc for all galaxies in the ACO 3627 cluster as derived from the Tully-Fisher relation by Woudt (1998).
2 Observations and data reduction
We observed three fields inside the Abell radius of ACO 3627 (cf. Fig. 1) and one comparison field well outside the cluster, each in 4 different ATCA configurations (Table 1).

The observing time for each field was 12 hr per configuration. The baselines employed spanned the range from 31 m to 6000 m. Details of the observations can be found in Table 2. The first column is the name of the field followed by the coordinates of the field center, the HPBW () of the synthesized beam, and the rms noise.
The effective size of each field is the individual antenna HPBW=30′. We used a bandwidth of 32 MHz (6900 km s-1), divided into 256 channels of 125 kHz (27 km s-1) each and centered on a frequency of 1.397 GHz (corresponding to an heliocentric velocity of 5023 km s-1). Thus, the effective velocity coverage ranges from 1530 km s-1 to 8510 km s-1 with a spectral resolution of km s-1. The primary ATCA calibrator, PKS B1934–638, was observed at least once per 12 h run. Each 40 minute observation of a field was bracketed by short observation of a nearby secondary calibrator: PKS B1718–649. Each database for a given configuration and a given field was processed separately using the NRAO Astronomical Image Processing System (AIPS) package. The subtraction of the continuum was found to be the main difficulty for the cluster fields due to the presence of the very strong [55 Jy] continuum source, B1610-608. This will therefore be discussed in detail.
(i) Comparison field: As there is a point source with a flux density of 180 mJy near the field center, we CLEANed and subtracted the CLEAN components directly in the plane (AIPS task: UVSUB). The remaining continuum was then removed by linear interpolation with respect to frequency (AIPS task: UVLIN).
(ii) Eastern field: We made a CLEANed image of the WAT galaxy, B1610–608 shifting the phase center to coincide with the center of this galaxy and subtracted the CLEAN components directly in the plane. In a second step another three fainter point sources were subtracted in the way described in (i). The remaining continuum was then removed by a linear interpolation with respect to frequency.
(iii) South-eastern field: As B1610–608 lies just beyond the upper western edge of the image, its sidelobes dominate the image. We reconstructed this very extended (14′) source shifting the phase center again to coincide with the galaxy center and subtracting the CLEAN components directly in the plane. Two point sources were then removed using the technique described in (i). As the sidelobes of B1610–608 then still dominated the image we repeated the procedure removing the WAT galaxy. At the end two linear interpolation procedure were applied, the first with a shift on B1610–608, the second with a zero shift.
(iv) Central field: B1610–608 is located in the center of this field. We reconstructed this source and subtracted the CLEAN components directly in the plane. The CLEANed flux is 57 Jy for configuration 0.375 and still 55 Jy for configuration 0.75A. The main problem in this field is that the frequency baselines are not flat and even show some discontinuities. The subtraction of a polynomial fit of order 4 in the image cube (AIPS task: IMLIN) resulted in an acceptable rms noise which is only a somewhat higher () than those attained in the other fields.
After combining the databases of the four configurations for each field, images were obtained using the AIPS task IMAGR applying different weightings. In the case of uniform weighting this resulted in a final resolution of 15′′ and rms noises of 1 mJy/beam. As expected, the rms noise in the different fields increases with decreasing distance to B1610–608.
3 Results
In order to detect possible galaxy candidates, we applied two different strategies.
Since the optical galaxy diameters are known to range from 20′′ to 100′′, we analysed our data at different resolutions. We used the full resolution data as a search for an optimized study of small size galaxies. For an optimized study of larger objects () we degraded the resolution to about 30′′, applying a taper of 10k and a weighting close to a natural weighting, resulting in beamsizes of about . This increases the sensitivity to extended sources with diameters greater than 15 kpc by factors up to 4 compared with uniform weighting. The main galaxy search was made in a data cube with a degraded resolution of . First, for each of the four fields we added the emission of all velocity channels at this resolution above a threshold of 3. We then made spectra for all peaks in the integrated Hi maps exceeding the 3 level.
In order to double check the results of these two search techniques we made small sized data cubes ( km s-1) centered on the position and velocity of all Woudt (1998) galaxies in the fields. The relatively small size of the cubes allow a simple, reliable continuum subtraction. We found no additional detections using this method.
Woudt (1998) identified 80 spiral galaxies in the three fields, out of which 20 have extinction-corrected blue luminosities B mag. In total, we found two galaxies, one in eastern field and one in south-eastern field. Their properties are listed in Table 3. The columns are: (1) galaxy name (2) RA(2000) of the optical center (3) DEC(2000) of the optical center (4) diameter of the major axis (5) diameter of the minor axis (6) extinction-corrected diameter of the major axis (7) extinction-corrected apparent B magnitude (the extinctions were taken from the Schlegel et al. 1998 maps) (8) range of morphological type (9) optical heliocentric velocity (10) central Hi velocity (11) Hi linewidth at 20% (12) Hi mass (13) MHI/LB.
For further analysis we made images of the best possible spatial resolution (15′′) for the detected galaxies. For the determination of integrated spectra and the total flux we use the 30′′ resolution cubes which are more sensitive for these extended sources. We will now discuss the detected galaxies in detail.
3.1 WKK 6801
This Hi detection in the field East coincides with the optical identification WKK 6801 (see Fig. 4a). It is located at a projected distance of 2.6o=3.5 Mpc from the cluster center. This spiral galaxy has an extinction-corrected B magnitude of =15.7, an extinction-corrected diameter of , and a radial velocity of 35197 km s-1 (Woudt 1998). Fig. 2 shows the full resolution (15′′) channel maps. The galaxy is visible over a range of 6 channels.
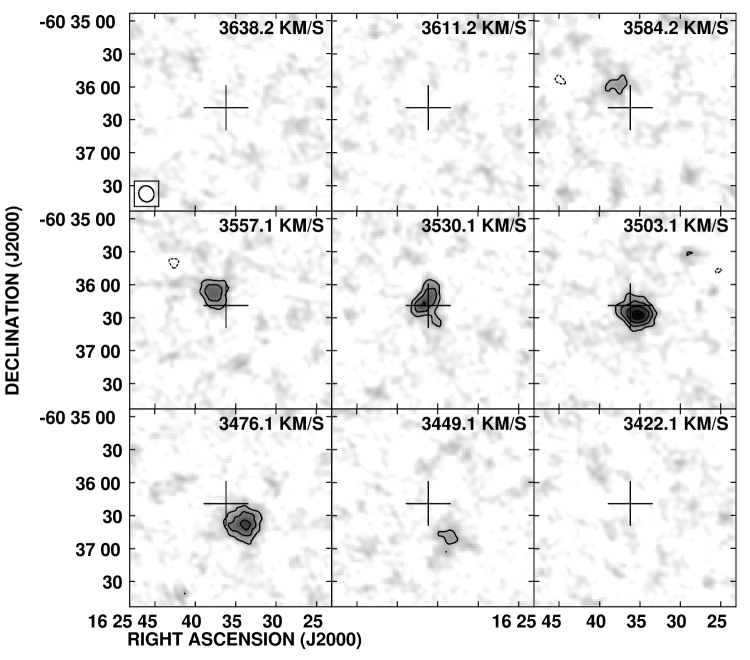
The integrated Hi spectrum measured over a 60 area centered on the optical center, using the 30′′ resolution data can be seen in Fig. 3. It does not show the usual double horn feature of inclined disk galaxies but only a single peak. The derived total line flux corrected for beam attenuation is 8.9 Jy km s-1. This corresponds to a total Hi mass of 1.3 1010 M⊙ (for a distance of 79 Mpc). The velocity channel separation is 27 km s-1. We measured full widths at, respectively, 20% and 50% of the maximum profile height of =160 km s-1 and =110 km s-1. The error on the width is of the order of the channel separation. Hi spectra of extreme late type galaxies can show this kind of profile (Matthews et al. 1998) with comparable linewidths.

The Hi distribution map can be seen in Fig. 4(b).
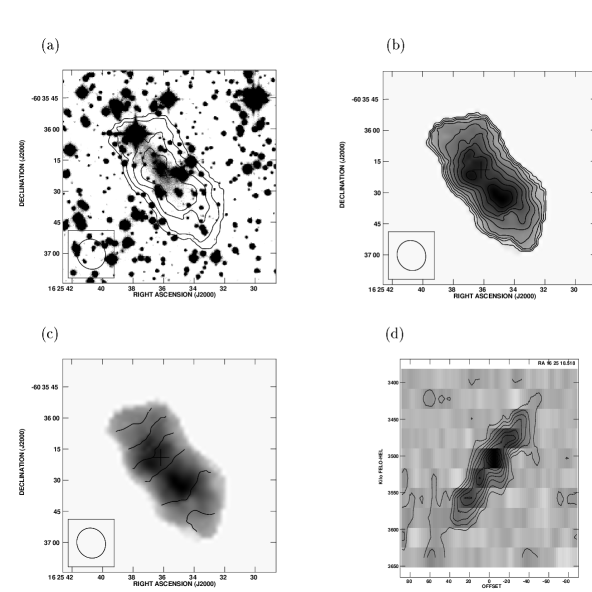
The galaxy has a symmetric Hi distribution in the outer parts of its highly inclined disk, whereas the inner part shows two asymmetric maxima with respect to the optical galaxy center. The main maximum is located in the south-west. The maximum surface density in the center is 38 M⊙/pc2. The profile corresponds to those of field spirals which do not show signs of perturbation in their Hi content (Cayatte et al. 1994). The derived Hi diameter at a column density of 2.3 1020 cm-2 is =31 kpc, leading to a mean Hi surface density of 17 M⊙/pc2. Woudt (1998) gives an extinction-corrected optical diameter of 47′′ (E(B-V)=0.199; Schlegel et al. 1998). This means that the Hi diameter exceeds the optical diameter by almost a factor 2.
The velocity field is shown in Fig. 4(c). Its regular form is only perturbed at the location of the south-western maximum which could be a spiral arm. The position-velocity plot along the major axis can be seen in Fig. 4(d). It shows a linearly rising rotation curve which is perturbed in the galaxy centre. We fitted a rotation curve to the data excluding around the minor axis. The systemic velocity is 35187 km s-1. The kinematical center coincides within 2′′ with the optical center given by Woudt (1998). The position angle is PA=35o, the inclination i60o, and the maximum rotation velocity 75 km s-1.
The galaxy has an extinction-corrected magnitude of 15.7 (Woudt 1998). This gives an absolute magnitude of leading to an Hi mass-to-light ratio 2.43 M⊙/L⊙,B (using a distance of 79 Mpc). This corresponds to the median value for an Sd or Sdm galaxy (Roberts & Haynes 1994). The maximum velocity of the rotation curve of 75 km s-1 and the line profile are also representative of a very late type galaxy.
3.2 WKK 6489
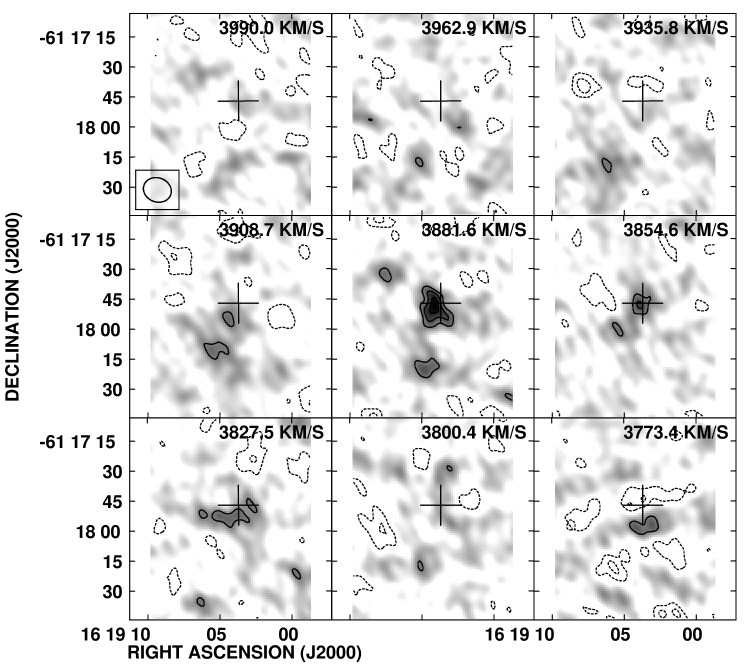
This Hi detection in the south-eastern field matches with the optical identification of WKK 6489 (Fig. 7a). This spiral galaxy has an extinction-corrected B magnitude of =15.1, an extinction-corrected diameter of , and a velocity of 379458 km s-1 (Woudt 1998). A very weak detection is seen in co-added 2MASS near-infrared (J,H,K-band) images, whose center lies only 2′′ NW of Woudt’s optical position. Its estimated total magnitude in K is about 14.5-15, no near-infrared colors could be derived. Its apparent major axis diameter is about 20′′, and its orientation and axial ratio appear consistent with the R-band image. The channel maps are shown in Fig. 5. The galaxy is clearly detected in 4 channels. The Hi spectrum integrated over an area of (Fig. 6) shows that this galaxy has a 21 cm line flux which is 10 times smaller than that of WKK 6801. The derived total flux is 1.07 Jy km s-1, corresponding to a total Hi mass of 1.6 109 M⊙.
WKK 6489 has a corrected magnitude of 15.1 (Woudt 1998). This corresponds to an absolute magnitude of mag leading to an Hi mass-to-light ratio 0.17 M⊙/L⊙,B.
The channel width is 27 km s-1, the beam size used here is 30′′. The measured full widths at, respectively, 20% and 50% of the maximum profile height are km s-1 and =80 km s-1.

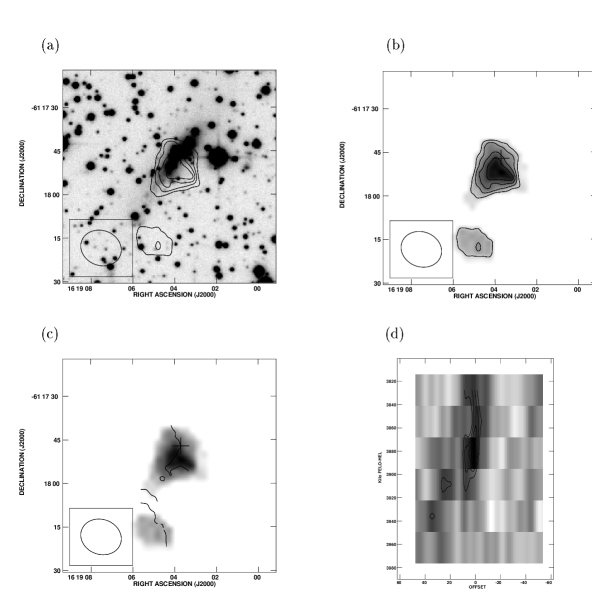
Fig. 7(b) shows the Hi brightness distribution. The cross indicates the optical center determined by Woudt (1998). The main Hi emission lies south-east of the optical galaxy center. Its velocity coincides with the optical velocity within the errors. A second blob is located at a distance of 30′′ under the south-eastern end of the major axis. Woudt (1998) gives an extinction-corrected optical diameter of 61′′. This means that the south-eastern blob lies at the edge of the optical disk. The velocity field can be seen in Fig. 7(c). Its peculiar behaviour could partly be due to the high noise level in the data. The position-velocity along the major axis is shown in Fig. 7(d). We observe a continuous velocity field between the two distinct Hi emission blobs. Thus, the two blobs are possibly connected but our data does not permit to draw a firm conlusion. In principle the observed asymmetric Hi morphology could be due to:
-
•
a galaxy–galaxy interaction,
-
•
an interaction between the cluster’s gravitational potential,
-
•
ram pressure exerted by the hot intracluster medium on the fast moving galaxy (Gunn & Gott 1972).
Since there is no optical companion, a gravitational interaction is unlikely. Moreover, its asymmetric Hi gas distribution reminds that of NGC 4848 located in Coma (Bravo-Alfaro et al. 2000), a cluster which is very similar to ACO 3627 (see Sect. 4.2). N-body models simulating the gas disk of spiral galaxies falling into the Virgo cluster (Vollmer et al. 2001) show the importance of ram pressure stripping in this cluster. We expect this effect to be still more pronounced in bigger clusters as ACO 3627 or Coma. We therefore think that ram pressure is the most probable mechanism which caused the observed asymmetry.
3.3 Number of detections
The 3 detection limit in each field is 3 mJy/beam in one velocity channel with a beamsize of 30′′. WKK 6801 and WKK 6489 represent thus 9 and 3 detections. If we assume an average MHI/LB=0.2 M⊙/L⊙,B (Roberts & Haynes 1994) and a limiting Hi mass of 7 108 M⊙ (see Sect. 4.1), we obtain a limiting luminosity L L⊙,B. With a distance of 79 Mpc this leads to B=16.2. The number of cluster spiral galaxies with B16.2 within the Abell radius is 214 (Woudt 1998). The fraction between the search area (the three inner fields) and the area within an Abell radius is . If the spiral galaxies in ACO 3627 had MHI/LB comparable to those of field galaxies, we should have detected more than 10 galaxies.
4 Discussion
4.1 Detection rate
With an Hi column density sensitivity limit of cm-2 we are not able to detect dwarf galaxies nor low surface brightness galaxies (Pickering et al. 1997) in our fields. The galaxies we expect to be detectable will thus have linewidths of at least 100 km s-1. We can estimate the Hi mass detection limit in the following way: an assumed flat-topped spectrum of intrinsic width , due to the galaxy’s inclination has an observed velocity range of , where is the optical diameter along the major axis and is the minor axis diameter. We further assume a spatial extent of one beamsize or less per velocity channel. At a distance of 79 Mpc this implies an Hi mass limit of
| (1) |
where is in km s-1. Assuming =150 km s-1 gives a limit of 7 108 M⊙, for example.
We can estimate the Hi linewidth of individual objects using the B-band Tully Fisher (TF) relation. Adopting the Virgo cluster B-band TF relation found by Yasuda et al. (1997), and using a distance of 17 Mpc for the Virgo cluster and 79 Mpc for ACO 3627, we obtain as TF relation for ACO 3627:
| (2) |
We have calculated a limiting Hi mass-to-blue light ratio, MHI/LB, for each individual spiral galaxy identified in our three ACO 3627 ATCA fields by Woudt (1998), using the linewidth obtained with the TF relation and relation (1).
The high extinction makes it difficult to identify the exact morphological type of any individual object. Woudt (1998) made an attempt to classify the detected galaxies where it was possible. We decided to separate the galaxies detected and classified by Woudt (1998) into three different groups according to their morphology: group I: 22 early-type galaxies (S0/a–Sb), group II: 15 late-type galaxies (Sbc–Sd), and group III: 31 spiral galaxies without further morphological subclassification (S type). The mean limits to the mass-to-light ratio and their dipersions for these groups are
-
•
Group I: MHI/LB=0.170.10 M⊙/L⊙,B
-
•
Group II: MHI/LB=0.220.09 M⊙/L⊙,B
-
•
Group III: MHI/LB=0.340.11 M⊙/L⊙,B
The global limit to the mass-to-light ratio for all galaxies is MHI/LB=0.250.13 M⊙/L⊙,B.
For comparison, Roberts & Haynes (1994) give the following average Hi mass-to-blue light ratios and dispersions as function of morphological types: S0: 0.030.02 M⊙/L⊙,B, Sa/Sb: 0.10.07 M⊙/L⊙,B, and Sc/Sd: 0.30.15 M⊙/L⊙,B. Our mean limit to the mass-to-light ratio for the late-type (Sbc–Sd) galaxies in ACO 3627 is below the mean value given for Sc-Sd spirals by Roberts & Haynes. Moreover, we find 8 galaxies (or 36%) in group I (S0/a–Sb) with MHI/L M⊙/L⊙,B, the average for Sa-Sb spirals found by Roberts & Haynes, and 7 galaxies (or 47%) in group II (Sbc–Sd) with MHI/L M⊙/L⊙,B, while 0.3 is the mean value for Sc-Sd spirals by Roberts & Haynes. We should have detected at least some of the spirals identified in the ACO 3627 cluster, if they have MHI/LB ratios comparable to those found by Roberts & Haynes.
In principle there are three possible explanations why they are not detected:
-
1.
The galaxies with unknown velocities are outside the velocity range. This is, however, quite unlikely considering the velocity range covered with the ATCA observations being ( km s-1) compared to the mean velocity and velocity dispersion of ACO 3627 of = 4844 km s-1, respectively = 848 km s-1 (cf. also Column 9 in Table 3).
-
2.
Some early type galaxies are misclassified as spirals. Since it is very difficult to determine morphological types due to the high extinction in the Galactic plane, misclassifications are always possible. Nevertheless, there should not be a systematic trend to misclassify lenticular galaxies with intrinsically featureless disks as spirals.
-
3.
They are Hi deficient.
We conclude that even if we take the two former points into account there is evidence that a significant fraction of the central spiral galaxies are Hi deficient.
4.2 Comparison with the Coma cluster detection rate
The X-ray luminosity, velocity dispersion, galaxy magnitude distribution of ACO 3627 all are comparable to that of the Coma cluster (Woudt 1998). We will therefore compare our detection rate with that measured with the VLA in Coma by Bravo-Alfaro et al. (2000). Even if their data do not cover the whole velocity range of the cluster, they should not have missed a considerable number of galaxies, because their fields where centered on the galaxies with the highest B luminosity (B). They detected 19 galaxies in a search area of 2.3 with an rms noise of 0.4 mJy/beam. With our sensitivity (2 1020 cm-2) they would have detected 9 galaxies. This gives a detection rate of =3.9 galaxies/. We have detected 2 galaxies in a search area of 0.75 (the three central fields) leading to =2.67 galaxies/.
In the case of spatially resolved Hi emission the Hi flux density of galaxies of the same physical size and the same total Hi mass is the same for both clusters. Therefore, we only have to correct the Coma detection rate for the search area in ACO 3627. If the Hi emission is not resolved an additional correction for beam dilution effect must be taken into account. Since the galaxies in both clusters should be spatially resolved in Hi, we will consider only the first case. If we correct the Coma detection rate for the distance of ACO 3627 we get
| (3) |
where =4844 km s-1 and =6853 km s-1. The expected number of detection for our survey is galaxies. Thus, we have a reasonable detection rate compared to that of the Coma cluster.
Moreover, out of 21 galaxies in the three inner fields with B (this corresponds to the B in the Coma cluster) we detected two galaxies. Bravo-Alfaro et al. (2000) would have detected 9 galaxies out of 44 in the Coma cluster with our sensitivity. On the other hand, the cluster ACO 262 located at nearly the same distance as ACO 3627 and similar to the Virgo cluster, i.e. only mildly Hi deficient, has been mapped with the Westerbork array by Bravo-Alfaro et al. (1997). They detected 11 out of 25 galaxies (B) with a sensitivity comparable to ours. Clearly, the Hi detection rate in ACO 3627 is similar to that of the Hi deficient Coma cluster and not that of A 262, indicating that the bright spiral galaxies in ACO 3627 are Hi deficient.
5 Conclusions
We have observed three different fields of 30′ diameter each within the Abell radius of the galaxy cluster ACO 3627 as well as one comparison field outside the cluster with an rms noise of 1 mJy/beam. We have detected 2 galaxies for the first time: WKK 6801, located at a projected distance of 2.6o=3.5 Mpc east of the cluster center, seems to be a very late type spiral. For WKK 6489, located 1o=1.3 Mpc south east of the cluster center, our data does not permit to draw firm conclusions about its exact nature but it is probably an Hi deficient galaxy.
The detection rate is in reasonable agreement with that obtained for the Coma cluster (Bravo-Alfaro et al. 2000). There is evidence that a large fraction of spiral galaxies in the inner area are Hi deficient. This deficiency is probably due to the interaction of the atomic gas in the galaxies with the hot intracluster gas detected in X-rays by Böhringer et al. (1996). We therefore expect that ram pressure stripping is a probable cause for the Hi deficiency of the spiral galaxies in ACO 3627.
Acknowledgements.
We particularly would like to thank B. Koribalski for doing one observing run and for giving important advise on the observing procedure. We also wish to thank the ATCA and ATNF staff for their kind support during the observations.BV is supported by a TMR Programme of the European Community (Marie Curie Research Training Grant). The research of P.A.H. is supported by NSF Faculty Early Career Development (CAREER) Program award AST 95-02268.
References
- (1) Böhringer, H., Neumann, D.M., Schindler, S., Kraan-Korteweg, R.C. 1996, ApJ 467, 168
- (2) Bravo-Alfaro, H., Szomoru, A., Cayatte, V., Balkowski, C., Sancisi, R. 1997, A&AS, 126, 537
- (3) Bravo-Alfaro, H., Cayatte, V., van Gorkom, J.H., Balkowski, C. 2000, AJ, 119, 580
- (4) Cayatte, V., van Gorkom, J.H., Balkowski, C., Kotanyi, C. 1990, AJ 100, 604
- (5) Cayatte, V., Kotanyi, C., Balkowski, C., van Gorkom, J.H. 1994, AJ, 107, 1003
- (6) Chamaraux, P., Balkowski, C., Gérard, E. 1980, A&A 83, 38
- (7) Giovanelli, R., Haynes, M.P. 1985, ApJ 292, 404
- (8) Gunn, J.E., Gott, J.R. 1972, ApJ 176, 1
- (9) Henning, P.A., Staveley-Smith, L., Kraan-Korteweg, R.C., Sadler, E.M. 1999, PASA 16, 35
- (10) Henning, P.A., Staveley-Smith, L., Ekers, R.D., Green, A.J., Haynes, R.F., Juraszek, S., Kesteven, M.J., Koribalski, B.S., Kraan-Korteweg, R.C.,Price, R.M., Sadler, E.M., Schröder, A. 2000, AJ, 119, 2686
- (11) Jones, P.A., McAdam, W.B. 1996, MNRAS 282, 137
- (12) Kolatt, T., Dekel, A., Lahav, O. 1995, MNRAS 275, 797
- (13) Kraan-Korteweg, R.C., Woudt, P.A., Cayatte, C., Fairall, A.P., Balkowski, C., Henning, P.A. 1996, Nat 379, 519
- (14) Kraan-Korteweg, R.C., Woudt, P.A., Henning, P.A. 1997, PASA 14, 15
- (15) Kraan-Korteweg, R.C., Juraszek, S. 2000, PASA 17, 6
- (16) Matthews, L.D., van Driel, W., Gallagher, J.S.III 1998, AJ 116, 1169
- (17) Pickering, T.E., Impey, C.D., van Gorkom, J.H., Bothun, G.D. 1997, AJ 114, 1858
- (18) Roberts, M.S., Haynes, M.P. 1994, ARA&A 32, 115
- (19) Schlegel, D.J., Finkbeiner, D.P., Davis, M. 1998, ApJ 500, 525
- (20) Solanes, J.M., García-Gómez, C., Manrique, A., González-Casado, G., Giovanelli, R., Haynes, M.P. 2000, in: Dynamics of Galaxies: from the Early Universe to the Present, Eds.: Francoise Combes, Gary A. Mamon, and Vassilis Charmandaris ASP Conference Series, Vol. 197
- (21) Tamura, T., Fukazawa, Y., Kaneda, H., Makishima, K., Tashiro, M., Tanaka, Y., Böhringer, H. 1998, PASJ 50, 195
- (22) Woudt, P.A. 1998, Ph.D. thesis, University of Cape Town
- (23) Vollmer, B., Cayatte, V., Balkowski, C., Duschl, W.J. 2001, ApJ, submitted
- (24) Yasuda, N., Fukugita, M., Okamura, S. 1997, ApJS, 108, 417