Abstract
Accurate photometry was obtained for all programme stars during the 3.3-year HIPPARCOS mission. The final observing programme included several hundred Mirae (M), semiregular (SR) long-period and irregular (L) variables. A detailed calibration of the aging of the optics allowed the evaluation of very precise magnitudes over the whole range of star colours.
Since the time coverage of the satellite observations was not sufficient to describe the behaviour of M, SR, or L type variables, smooth curves were fitted statistically to the dense AAVSO observations. These curves were then transformed to the HIPPARCOS system in order to complement the HIPPARCOS photometry and thus produce precise light curves with fuller time coverage, for a set of several hundred late-type variables, including most Carbon stars brighter than V = 12.4 at minimum luminosity.
A preliminary discussion of the behaviour of C stars, as observed from the space in the broad Hp band, is given.
1 The LPVs in HIPPARCOS programme
During the compilation of the HIPPARCOS Input Catalogue (HIC), special attention was given to obtain a uniform all sky coverage of late type variables, including the poorly known ones in the Southern hemisphere. The inclusion in HIC of long period variables (LPVs) was possible only for those brighter than HIPPARCOS magnitude Hp 12.5 (the detection threshold) at least 80 % of their cycle. One of prerequisites of the HIPPARCOS mission was that the brightness of the targets needed to be known in advance to allocate the appropriate observing time. However LPVs are not strictly periodic in their amplitudes, phases, and even periods. Thus the prediction of the brightness and of the observability windows (time intervals when Hp was 12.4) could not be achieved without performing complementary ground-based observations before and during the mission on about 340 LPVs. The responsibility of monitoring the HIPPARCOS LPVs was taken by the AAVSO, both by continuing long term observations and adding new variables to the AAVSO observing programme (Mattei 1988). About one million longterm AAVSO observations, together with about 70000 yearly continuing observations were used to prepare and refine the ephemerides produced by the variable star coordinator at Montpellier, France in collaboration with the AAVSO.
2 The photometric reduction of LPVs
The main-mission photometry was performed in the wide Hp band extending from 380 to 900 nm. Due to irradiation by energetic solar and cosmic particles, the transmission of the detection chain suffered a severe wavelength-dependent deterioration during the mission. The standard Hp system was re-defined for an epoch near mid-mission. A photometric reduction to a subset of 22000 standard stars allowed to fix the zero point of the Hp magnitude scale better than 0.001 mag twice per day. The very red stars were a difficult case for the reduction to a standard Hp system. The reddest non-variable standards have V-I colour less than 1.8 whereas the mean V-I of most LPVs lies in a range from 2 to 6 magnitudes. Note that the dominant flux for late type Carbon stars is emitted in the 700 to 900 nm domain. The early reduction algorithms were polynomial relations between the instrumental magnitudes and the standard Hps as function of B-V. This approach failed to model the aging effects for late type stars, especially M and S type giants, inducing spurious long term drifts and short term flickering when the reduction relations were extrapolated to red variables.
The technique to accurately define the chromatic aging from red variables, i.e. Hp versus V-I as a function of time, was accomplished by forcing Hp - VAAVSO to be constant, at given light-curve phase and VAAVSO, throughout the mission. The Hp /(V-I) relation is a non- linear function of V-I. For reduction purposes, a linear pseudo-index was defined as given in Table 1.3.2 of The Hipparcos and Tycho Catalogues (HIP), Vol. 1 (ESA 1997). This linearization procedure is nearly exact for stars with V-I less than 2, but may leave reduction residuals of the order of few percent on individual magnitudes.
Simultaneous observations, visual by AAVSO observers and photoelectric, with CCD camera and classical Geneva photometer, were performed to tie the Hp, the and , scales for red semiregular and Mira type LPVs. For M,S,C stars a unique relation exists between Hp and the Johnson , as function of V-I. Note that M and C stars have a very distinct behaviour (Hp-V)/(B-V) or (Hp-)/(- plane, see Fig. 1.3.7 in The Hipparcos and Tycho Catalogues (HIP), Vol. 1 (ESA 1997).
The adopted relation Hp-V versus V-I from the Cousin’s system, is given
below:
V-I : 2.00 2.50 3.00 3.50 4.00 4.50 5.00 5.50 6.00 Hp-V : 0.08 0.02 -.09 -.28 -.53 -.81 -1.10 -1.38 -1.66
3 The light-curves of Carbon stars
All R,N,C type stars observed by HIPPARCOS turned out to be variable either irregular, semi-regular or nearly periodic. Since is larger than , the amplitude in the Hp band is generally smaller than that in B and V bands. This behaviour is illustrated in Fig.1 for HIP 59844, the pulsating star BH Cru.

The ratio Q = is around 0.7 for early type C and M giants. It shows a slight decrease for the reddest stars, see Fig.2.

Large amplitude periodic variables often show nearly sine folded light-curves, e.g. HIP 109089 in Fig.3.
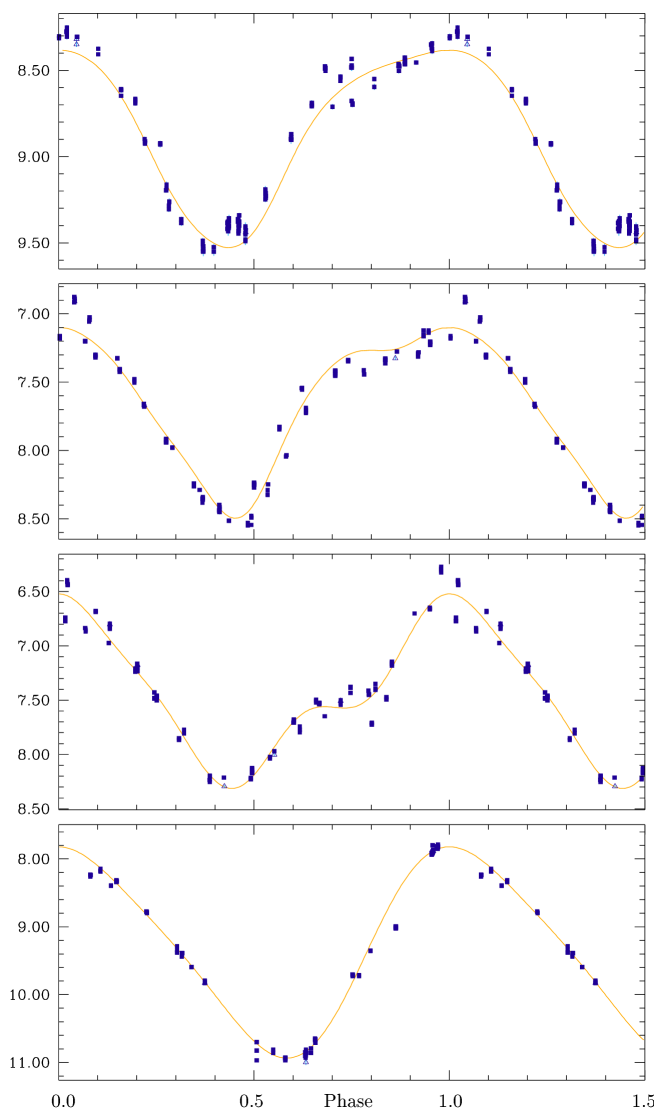
The bump near phase 0.7 is present in many light-curves as shown for HIP 106583, 99653 or 26753. Semi-regulars and stars pulsating on the first overtone show rather noisy folded light curves due to the their varying amplitude and not so periodic behaviour. For small amplitude irregulars, the time coverage during the HIPPARCOS mission was sufficient to describe their behaviour in terms of peak to peak amplitudes and time scales for variations, cf. Eyer et al.(1997).
The Hp amplitudes show two regimes for periodic R,N,C variables. R stars and part of C,N stars show a linear relation between the period and the amplitude which may be expressed as = 1.3E-03Period. For the classical C-rich Mirae with typical in the range 1.2 to 2.4 mag, the amplitude shows little if any dependence on the period, ranging between 200 and 480 days. The global behaviour is displayed in Fig.4.

4 The HIPPARCOS-AAVSO light-curves
The visual estimates are obtained by interpolating the brightness of the variable star using a series of reference stars of known magnitude in its field. The difference between the response of the eye and of the band leads to an offset between the visual and the photoelectric , proportional to the colour difference between the comparison stars and the red variable.
The monitoring by AAVSO observers generally produces a dense time coverage but because observations of different observers are combined, and because the accuracy of the individual observation is only between 0.1 and 0.3, the light curves are noisy. Thus, average light curves were obtained by fitting curves to the individual observations by Fourier, polynomial or quintic splines methods. These fitted curves were then transformed to Hp magnitudes and HIPPARCOS photometry was then superimposed to them.
The difference Hp-V is a function of the star’s temperature and of the circum- and inter- stellar extinction. Since the colour change as function of the phase is generally unknown, the technique to reduce AAVSO magnitudes to Hp is to plot versus . For LPVs the relation is often S-shaped as shown for the C0ev type star HIP 4284, see Fig.5.

The fine structure of / diagrams depends mainly on the Teff and log g variations and on the corresponding absorption changes due to TiO, VO or CN, C2, SiC molecular bands. Emission lines and dust extinction introduce departures from the mean relation.
Although distinct relations seem to exist for rising and falling parts of the light-curve, a unique third degree polynomial was used to transform fitted AAVSO magnitudes to Hp magnitudes with an uncertainty of 0.1- 0.2 mag in most cases.This uncertainty is generally small compared to the peak-to-peak Hp amplitude. Errors on comparison stars magnitudes are automatically corrected by this process.
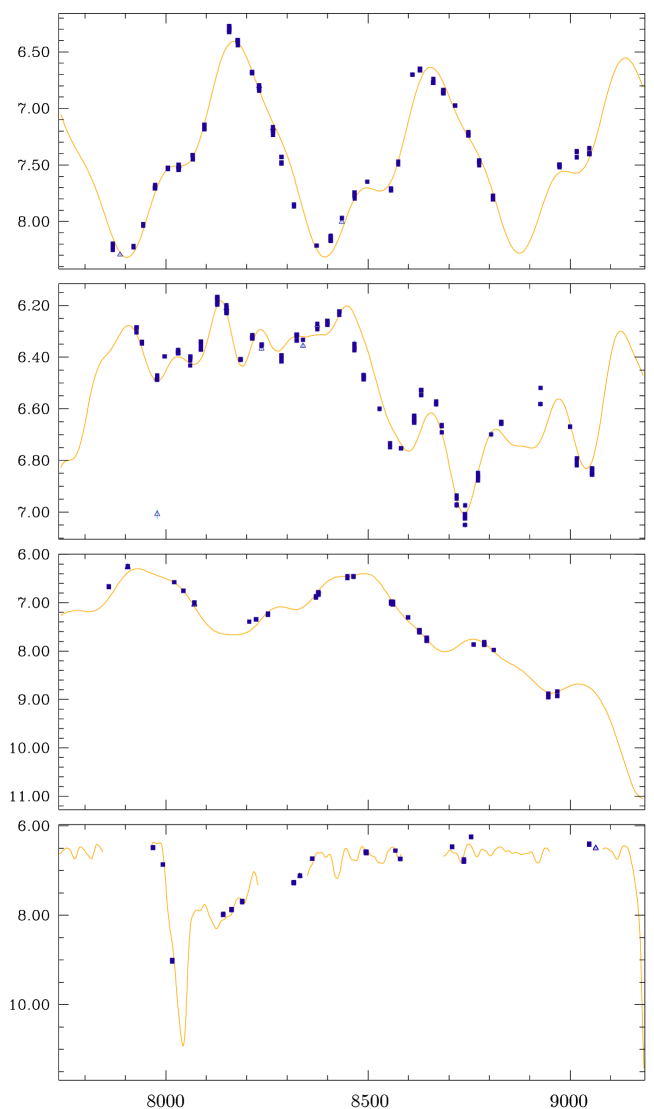
The Atlas of HIPPARCOS-AAVSO light-curves, part B (ESA 1997), contains 274 stars in common. Here we show few representative cases of C stars light-curves which would be difficult to interpret with HIPPARCOS data alone. This is especially true for RCB variable RY Sgr, where the main minima were missed due to the peculiar HIPPARCOS time sampling, and the semiregular variable V Hya with a 530-day and over a 6000-day period where HIPPARCOS observations were obtained while the star was slowly fading to the minimum of its longer period, see Fig.6.
5 Acknowledgements
We sincerely thank variable star observers around the world whose dedicated observations provided vital support in the observations of LPVs. We gratefully acknowledge the support of NASA under grant NAGW-1493 which made it possible for the AAVSO to provide data support to the HIPPARCOS mission and the Swiss National Science Foundation for its support to activities at Geneva Observatory.
6 References
European Space Agency (ESA). 1997, in The Hipparcos and Tycho
Catalogues, ESA SP-1200, Vol. 1 and 12, The Netherlands.
Eyer, L. and Grenon M. 1997, in Hipparcos - Venice ’97, 13-16 May,
Venice, Italy, ESA SP-402 (July 1997), 467.
Mattei, J.A. 1988, in Scientific Aspects of the Input Catalogue
Preparation II, Sitges, 25-29 January, J. Torra, C. Turon Eds., 376.