The extraordinarily bright optical afterglow of GRB 991208 and its host galaxy
Abstract
Broad-band optical observations of the extraordinarily bright optical afterglow of the intense gamma-ray burst GRB 991208 started 2.1 days after the event and continued until 4 Apr 2000. The flux decay constant of the optical afterglow in the R-band is 2.30 0.07 up to 5 days, which is very likely due to the jet effect, and after that it is followed by a much steeper decay with constant 3.2 0.2, the fastest one ever seen in a GRB optical afterglow. A negative detection in several all-sky films taken simultaneously to the event, that otherwise would have reached naked eye brightness, implies either a previous additional break prior to 2 days after the occurrence of the GRB (as expected from the jet effect) or a maximum as observed in GRB 970508. The existence of a second break might indicate a steepening in the electron spectrum or the superposition of two events, resembling GRB 000301C. Once the afterglow emission vanished, contribution of a bright underlying supernova is found on the basis of the late-time R-band measurements, but the light curve is not sufficiently well sampled to rule out a dust echo explanation. Our redshift determination of z = 0.706 indicates that GRB 991208 is at 3.7 Gpc (for H0 = 60 km s-1 Mpc-1, = 1 and = 0), implying an isotropic energy release of 1.15 erg which may be relaxed by beaming by a factor 102. Precise astrometry indicates that the GRB coincides within 0.2′′ with the host galaxy, thus given support to a massive star origin. The absolute magnitude of the galaxy is MB = 18.2, well below the knee of the galaxy luminosity function and we derive a star-forming rate of (11.5 7.1) M⊙ yr-1, which is much larger than the present-day rate in our Galaxy. The quasi-simultaneous broad-band photometric spectral energy distribution of the afterglow is determined 3.5 day after the burst (Dec 12.0) implying a cooling frequency below the optical band, i.e. supporting a jet model with = 2.30 as the index of the power-law electron distribution.
Key Words.:
Gamma rays: bursts - Galaxies: general - Cosmology: observations1 Introduction
Gamma–ray bursts (GRBs) are flashes of cosmic high energy ( keV–10 GeV) photons (Fishman and Meegan 1995). For many years they remained without any satisfactory explanation since their discovery in 1967, but with the advent of the Italian–Dutch X–ray satellite BeppoSAX, it became possible to conduct deep counterpart searches only a few hours after a burst was detected. This led to the first detection of X-ray and optical afterglow for GRB 970228 (Costa et al. 1997, van Paradijs et al. 1997) and the determination of the cosmological distance scale for the bursts on the basis of the first spectroscopic measurements taken for GRB 970508, implying 0.835 (Metzger et al. 1997).
Subsequent observations in 1997-2000 have shown that about a third of the well localized GRBs can be associated with optical emission that gradually fades away over weeks to months. Now it is widely accepted that long duration GRBs originate at cosmological distances with energy releases of 1051–1053 ergs. The observed afterglow satisfies the predictions of the ”standard” relativistic fireball model, and the central engines that power these extraordinary events are thought to be the collapse of massive stars (see Piran (1999) and van Paradijs et al. (2000) for a review).
The detection of GRB host galaxies is most essential in order to understand the nature of hosts (morphology, star forming rates) and to determine the energetics of the bursts (redshifts) and offsets with respect to the galaxy centres. About 25 hosts galaxies have been detected so far, with redshifts in the range 0.43-4.50 and star-forming rates in the range 0.5-60 M⊙ year-1. See Klose (2000), Castro-Tirado (2001) and references therein.
Here we report on the detection of the optical afterglow from GRB 991208 as well as its host galaxy. This GRB was detected at 04:36 universal time (UT) on 8 Dec 1999, with the Ulysses GRB detector, the Russian GRB Experiment (KONUS) on the Wind spacecraft and the Near Earth Asteroid Rendezvous (NEAR) detectors (Hurley et al. 2000) as an extremely intense, 60 s long GRB with a fluence 25 keV of erg cm-2 and considerable flux above 100 keV. Radio observations taken on 1999 December 10.92 UT with the Very Large Array (VLA) at 4.86 GHz and 8.46 GHz indicated the presence of a compact source which became a strong candidate for the radio afterglow from GRB 991208 (Frail et al. 1999).
2 Observations and data reduction
We have obtained optical images centered on the GRB location starting 2.1 days after the burst (Table 1). Photometric observations were conducted with the 1.04-m Sampurnanand telescope at Uttar Pradesh State Observatory, Nainital, India (1.0 UPSO); the 1.2-m Schmidt telescope at Tautenburg, Germany (1.2 TBG); the 1.5-m telescope at Observatorio de Sierra Nevada (1.5 OSN), Granada, Spain; the 2.5-m Isaac Newton Telescope (2.5 INT), the 2.56-m Nordic Optical Telescope (NOT), the 3.5-m Telescopio Nazionale Galileo (3.5 TNG) and the 4.2-m William Herschel Telescope (4.2 WHT) at Observatorio del Roque de los Muchachos, La Palma, Spain; the 1.23-m, 2.2-m and 3.5-m telescopes at the German-Spanish Calar Alto Observatory (1.2, 2.2 and 3.5 CAHA respectively), Spain; the 3.5-m telescope operated by the Universities of Wisconsin, Indiana, Yale and the National Optical Astronomical Observatories (3.5-m WIYN) at Kitt Peak, USA; and the 6.0-m telescope at the Special Astrophisical Observatory of the Russian Academy of Sciences in Nizhnij Arhyz, Russia.
For the optical images, photometry was performed by means of SExtractor (Bertin and Arnouts 1996), making use of the corrected isophotal magnitude, which is appropriate for star-like objects. The DAOPHOT (Stetson 1987) profile-fitting technique was used for the magnitude determination on the later epoch images, when the source is much fainter. Zeropoints, atmospheric extinction and color terms were computed using observations of standard fields taken throughout the run. Magnitudes of the secondary standards in the GRB fields agree, within the uncertainties, with those given in Henden (2000). Zeropoint uncertainties are also included in the given errors.
Prompt follow up spectroscopy of the OA was attempted at several telescopes (Table 2), but we only got a reasonable good signal-to-noise ratio (S/N) at the 6-m telescope SAO RAS using an integral field spectrograph MPFS (Dodonov et al. 1999a). One 2700-sec spectrum and one 4500-sec spectrum were obtained on 13 and 14 Dec 1999 UT. On the latter, the observing conditions were good: the seeing was 1.5 (at a zenithal distance of 60∘), and there was good transparency. We used 300 lines/mm grating blazed at 6000 Å giving a spectral resolution of about 5 Å/pixel and effective wavelength coverage of 4100 - 9200 Å. The spectrophotometric standards HZ44 and BD+75∘325 (Oke et al. 1995) were used for the flux calibration.
| Date of | Telescope | Filter | Integration | Magnitude |
|---|---|---|---|---|
| 1999 (UT) | time (s) | |||
| 10.2708 Dec | 2.5 NOT | R | 300 | 18.7 0.1 |
| 10.2917 Dec | 2.5 INT | I | 240 | 15.5 |
| 11.2111 Dec | 1.3 TBG | I | 900 | 18.75 0.11 |
| 11.2111 Dec | 2.2 CAHA | R | 600 | 19.60 0.03 |
| 11.2507 Dec | 2.2 CAHA | R | 600 | 19.61 0.04 |
| 11.2792 Dec | 2.5 INT | R | 300 | 19.70 0.08 |
| 11.2833 Dec | 2.5 INT | I | 300 | 19.2 0.1 |
| 12.0208 Dec | 1.0 UPSO | I | 2 x 200 | 19.9 0.3 |
| 12.2000 Dec | 1.2 CAHA | B | 300 | 20.3 |
| 12.2056 Dec | 1.2 CAHA | V | 300 | 20.5 |
| 12.2181 Dec | 1.2 CAHA | R | 300 | 20.0 0.3 |
| 12.2229 Dec | 1.2 CAHA | V | 500 | 20.7 0.4 |
| 12.2299 Dec | 1.2 CAHA | B | 500 | 21.3 0.2 |
| 12.2500 Dec | 1.5 OSN | R | 2 x 600 | 19.9 0.5 |
| 12.2535 Dec | 1.2 CAHA | U | 6 x 500 | 19.8 |
| 12.2576 Dec | 1.5 OSN | I | 300 | 19.8 0.5 |
| 12.2604 Dec | 2.5 NOT | R | 3 x 300 | 20.37 0.05 |
| 12.2694 Dec | 2.5 NOT | I | 3 x 300 | 19.95 0.05 |
| 12.2757 Dec | 2.5 INT | B | 500 | 21.40 0.05 |
| 12.2792 Dec | 2.5 NOT | V | 300 | 20.85 0.05 |
| 12.2806 Dec | 2.5 INT | V | 300 | 20.78 0.06 |
| 12.2840 Dec | 2.5 INT | I | 180 | 20.00 0.17 |
| 12.2882 Dec | 3.5 TNG | R | 500 | 20.0 0.3 |
| 13.0000 Dec | 1.0 UPSO | I | 3 x 600 | 20.3 0.2 |
| 13.2604 Dec | 2.5 NOT | R | 3 x 300 | 20.89 0.04 |
| 13.2715 Dec | 2.5 INT | B | 500 | 22.03 0.06 |
| 13.2729 Dec | 2.5 NOT | I | 3 x 300 | 20.34 0.06 |
| 13.2764 Dec | 2.5 INT | V | 180 | 21.36 0.07 |
| 13.2799 Dec | 2.5 INT | I | 300 | 20.26 0.11 |
| 13.2833 Dec | 2.5 NOT | V | 300 | 21.38 0.07 |
| 13.2910 Dec | 3.5 TNG | R | 360 | 20.8 0.3 |
| 14.2708 Dec | 2.5 NOT | R | 3 x 300 | 21.43 0.04 |
| 14.2743 Dec | 2.5 INT | B | 1,000 | 22.31 0.08 |
| 14.2778 Dec | 2.5 INT | U | 535 | 23.0 |
| 14.2792 Dec | 2.5 NOT | I | 3 x 300 | 20.91 0.07 |
| 14.2847 Dec | 3.5 TNG | R | 600 | 21.40 0.10 |
| 14.2875 Dec | 2.5 NOT | V | 300 | 21.68 0.10 |
| 15.2708 Dec | 2.5 NOT | R | 3 x 300 | 21.97 0.08 |
| 15.2833 Dec | 2.5 NOT | I | 3 x 300 | 21.46 0.16 |
| 15.2938 Dec | 2.5 NOT | V | 2 x 300 | 21.8 |
| 03.5319 Jan | 3.5 WIYN | R | 600 | 23.0 |
| 03.5507 Jan | 3.5 WIYN | I | 600 | 22.0 |
| 04.2292 Jan | 2.2 CAHA | R | 2 x 900 | 23.5 |
| 05.2292 Jan | 3.5 CAHA | R | 2 x 1,200 | 23.23 0.13 |
| 06.2083 Jan | 2.2 CAHA | V | 9 x 1,200 | 23.83 0.10 |
| 13.2097 Jan | 3.5 CAHA | R | 3 x 1,200 | 23.1 |
| 13.2528 Jan | 3.5 CAHA | V | 2 x 1,200 | 22.5 |
| 19.2604 Jan | 2.5 NOT | R | 7 x 600 | 23.65 0.13 |
| 29.2431 Jan | 4.2 WHT | I | 2 x 900 | 22.5 |
| 29.2604 Jan | 4.2 WHT | B | 986 | 23.6 |
| 13.2556 Feb | 3.5 TNG | B | 3 x 1,200 | 24.65 0.04 |
| 17.2882 Feb | 3.5 TNG | V | 2 x 1,200 | 24.22 0.09 |
| 31.8403 Mar | 6.0 SAO | V | 1,490 | 24.55 0.16 |
| 31.8715 Mar | 6.0 SAO | I | 360 | 23.46 0.49 |
| 31.9028 Mar | 6.0 SAO | B | 1,795 | 25.19 0.17 |
| 31.9583 Mar | 6.0 SAO | R | 1,260 | 24.27 0.15 |
| 04.2083 Apr | 2.5 NOT | I | 3,800 | 23.3 0.2 |
| 11.2708 Feb | 3.5 TNG | J | 42 x 60 | 22.0 |
| Date of | Telescope | Wavelength range | Exposure |
|---|---|---|---|
| 1999 (UT) | (A) | time (s) | |
| 12.2306 Dec | 2.2 CAHA | 3,550–4,510 | 1,800 |
| 12.2347 Dec | 3.5 CAHA | 6,000–10,000 | 1,800 |
| 13.2083 Dec | 6.0 SAO | 4,100–9,200 | 2,700 |
| 14.2083 Dec | 6.0 SAO | 4,100–9,200 | 4,500 |
| 18.2431 Dec | 4.2 WHT | 4,000–9,000 | 3,600 |
3 Results and discussion
3.1 The optical afterglow
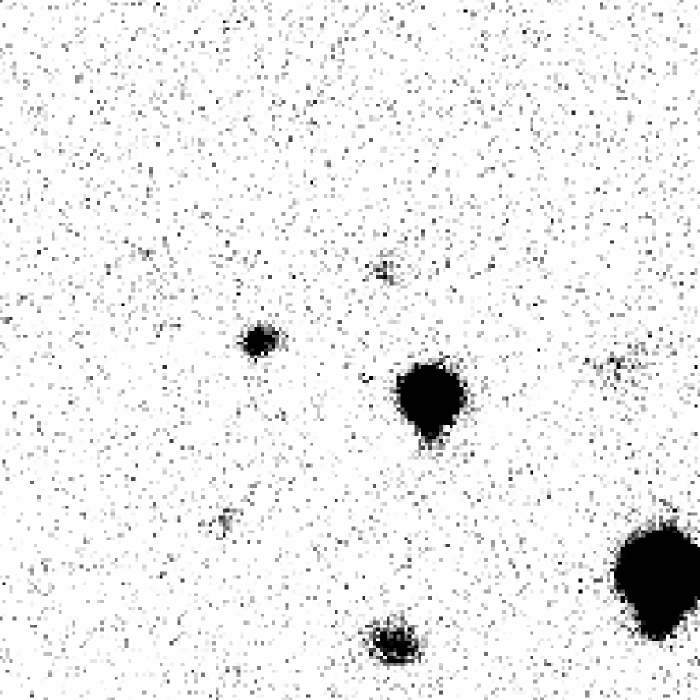
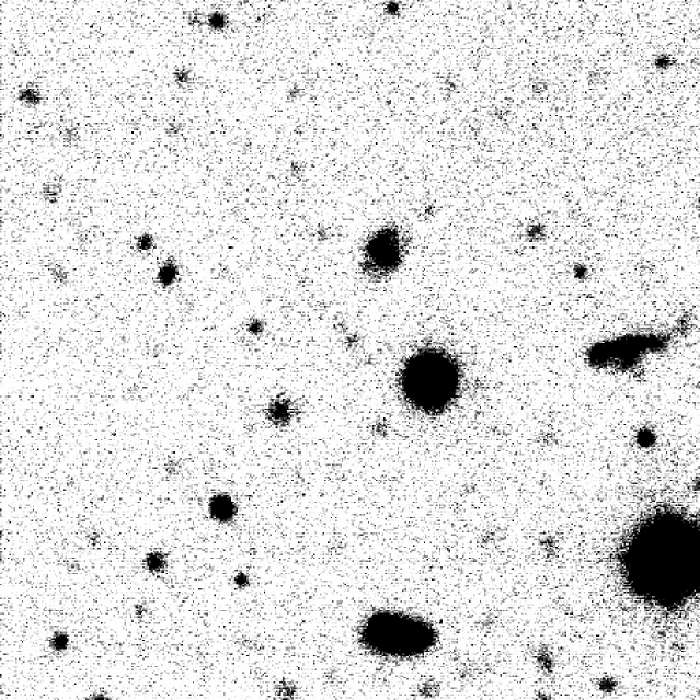
At the same location of the variable radiosource, a bright optical afterglow (OA) was identified on the images taken at Calar Alto, La Palma and Tautenburg (Castro-Tirado et al. 1999a,b). The astrometric solution was obtained using 16 USNO-A stars, and coordinates were (). A comparison among optical images acquired on 10 and 11 Dec allowed us to confirm the variability in intensity of the proposed OA. About 2.1 d after the burst, we measured R = 18.7 0.1 for the OA, and 19 h later we found R = 19.60 0.03. In these images the object is point-like (resolution 1′′) and there is no evidence of any underlying extended object as seen at later epochs (Fig. 1). Coincident (within errors) with the location of optical and radio afterglows, Shepherd et al. (1999) detected at millimeter wavelengths the brightest afterglow of a GRB reported so far. At 15 GHz and 240 GHz, the GRB 991208 afterglow was observed at Ryle (Pooley et al. 1999) and Pico Veleta (Bremer et al. 1999a,b), respectively.
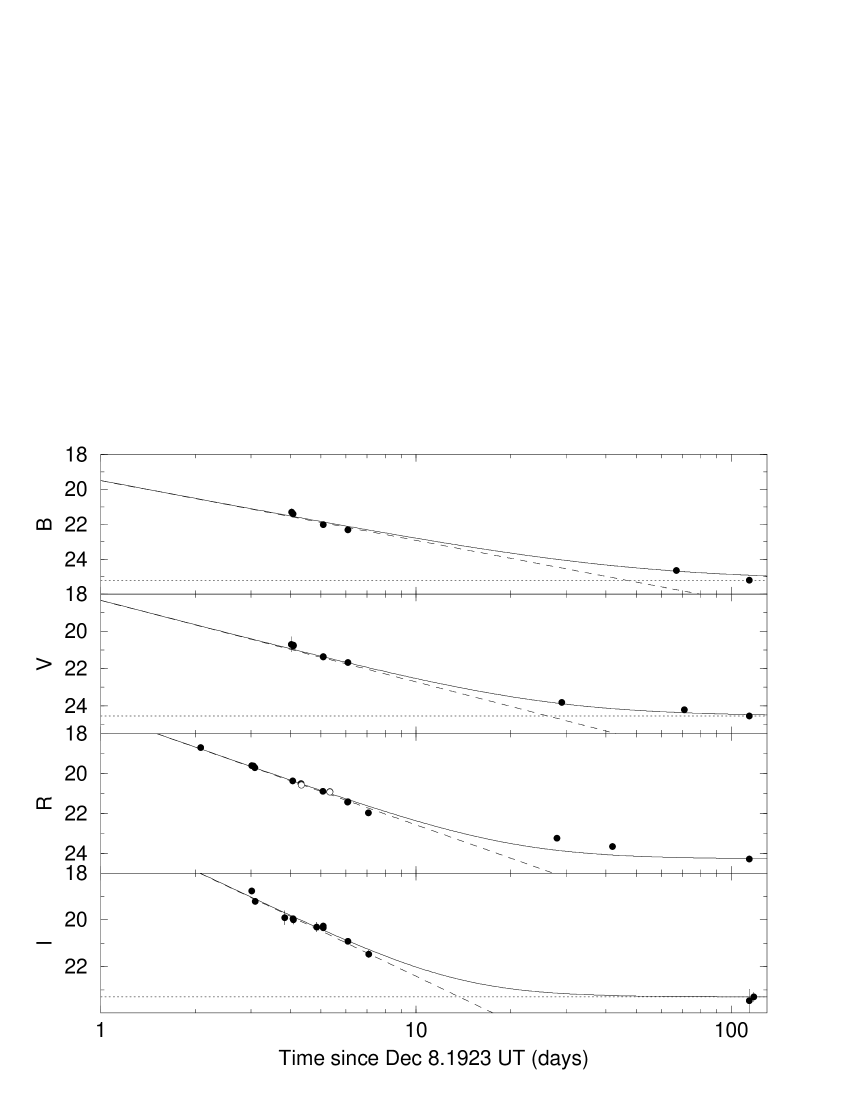
Our light curve (Fig. 2) shows that the source was declining in brightness. The optical decay slowed down in early 2000, indicating the presence of an underlying source of constant brightness: the host galaxy. The decay of previous GRB afterglows appears to be well characterized by a power law (PL) decay , where is the flux of the afterglow at time since the onset of the event at and is the decay constant. Assuming this parametric form and by fitting least square linear regressions to the observed magnitudes as function of time, we derive below the value of flux decay constant for GRB 991208. The fits to the , , and light curves are given in Table 3, but the poor quality of the PL fit is reflected in the relatively large reduced chi-squared values. This is specially noticeable in the R-band light curve, due to the data obtained after one month, that will be discussed in Section 3.1.2.
3.1.1 The existence of two breaks
The and -band data up to + 10 days are better fit by a broken PL with a break time 5 days. For the B and V-band such a fit is not possible due to the scarcely of the data in these bands. See Table 4. Hence we adopt a value of = 2.300.07 for 2 days 5 days and = 3.20.2 for 5 days 10 days as flux decay constants in further discussions.
Further support for the existence of an additional break at 2 days in GRB 991208 comes from the extrapolation of the R-band data towards earlier epochs (Fig. 3), that predicts an optical flux that should have been seen at naked eye by observers in Central Europe.
| Filter | dof | |
|---|---|---|
| B | 24.6/3 | |
| V | 16.0/6 | |
| R | 91.5/11 | |
| I | 19.3/8 |
| Filter | dof | dof | ||
|---|---|---|---|---|
| R | 3.9/6 | 5.7/3 | ||
| I | 0.4/3 | 1.1/3 |
The optical event exceeding magnitude 11 could be detected by the Czech stations of the European Fireball Network. Unfortunately, it was completely cloudy during the night of Dec 8/9 in the Czech Republic, so none of the 12 stations of the network was able to take all-sky photographs. The first photographs after the GRB trigger were taken on Dec 8, 16:25 UT, i.e. nearly 12 h after the event, and shows no object at its position brighter than mag 10. However, sky patrol films taken for meteor research were exposed in Germany during Dec 8/9, 1999 but no OA exceeding 4 with a duration of 10 s or more is detected simultaneously to the GRB event. This upper limit derived from the films implies that this additional break in the power-law decay of GRB 991208 has to be present at 0.01 days 2 days although a maximum in the light curve similar to GRB 970508 (Castro-Tirado et al. 1998) cannot be excluded.
The flux decay of GRB 991208 is one of the steepest of all GRBs observed so far (Sagar et al. 2000). Before deriving any conclusion from the flux decays of these GRBs, we compare them with other well studied GRBs. Most OAs exhibit a single power-law decay index, generally 1.2, a value reasonable for spherical expansion of a relativistic blast wave in a constant density interstellar medium (Mészáros and Rees 1997, Wijers et al. 1997, Waxman 1997, Reichart 1997) . For other bursts, like GRB 990123, the value of = 1.130.02 for the early time (3 hr to 2 day) light curve becomes 1.750.11 at late times (2-20 day) (Kulkarni et al. 1999, Castro-Tirado et al. 1999c, Fruchter et al. 1999) while the corresponding slopes for GRB 990510 are 0.760.01 and 2.400.02 respectively with the 1.57 day (Stanek et al. 1999, Harrison et al. 1999). If the steepening observed in both cases is due to beaming, then one may conclude that it occurs within 2 days of the burst.
Rapid decays in OAs have been seen in GRB 980326 with = 2.00.1 (Bloom et al. 1999a), GRB 980519 with = 2.050.04 (Halpern et al. 1999), GRB 990510 with = 2.40 0.02 (Stanek et al. 1999, Harrison et al. 1999) and GRB 000301C with = 2.2 0.1 (Masetti et al. 2000, Jensen et al. 2001, Rhoads and Fruchter 2001), and have been interpreted by the sideways expansion of a jet (Rhoads 1997, 1999, Mészáros and Rees 1999). For GRB 991208, = 2.300.07 and we therefore argue that the observed steep decay in the optical light curve up to 5 days may be due to a break which occurred before our first optical observations starting 2.1 day after the burst. The break is expected in several physical models, but beaming is the most likely cause in GRB 991208 taking into account that the rapid fading of optical afterglows is considered as an evidence for beaming in GRBs (Huang, Dai and Lu 2000).

According to the current view, the forward external shock wave would have led to the afterglow as observed in all wavelengths. The population of electrons is assumed to be a power-law distribution of Lorentz factors following d/d above a minimum Lorentz factor , corresponding to the synchrotron frequency . The value of can be determined taking into account the occurrence of the jet effect: the break due to a lateral expansion in the decelerating jet occurs when the initial Lorentz factor drops below -1 (with the initial opening angle), i.e. the observer “sees” the edge of the jet. A change in the initial power-law decay exponent (unknown to us) from = to = (for ), or from = to = (for ) is expected (Rhoads 1997, 1999). If this is the case, then = = 2.30 0.07, in the observed range for other GRBs.

Whether the jet was expanding into an constant density medium or in an inhomogeneus medium (Chevalier and Li 1999, Wei and Lu 2000) is not possible to know with our data alone, as we do not have information on . For a density gradient of = 2, as expected from a previously ejected stellar wind (), the light curve should steepen by = () = (3-)/(4-) = 0.5 whereas = 0.75 for a constant density medium.
But which is the reason of the second break observed in GRB 991208 after 5 days ? The passage of the cooling frequency through the optical band (that would steepen the light curve by 0.25, Sari et al. 1998) can be discarded: following Sari, Piran & Halpern (1999), if then we should expect a spectral index () such as = (p1)/2 = 0.65 0.04 and if then = p/2 = 1.15 0.04 which is compatible with on 12 Dec (see Section 3.3). Hence we conclude that has already passed the optical band 4 days after the burst onset.
The difference between the mid and late time decay slopes is = () = 0.9 0.3. A possible explanation could be two superposed events: a major burst followed by a minor burst, expected from some SN-shock models (Mészaros, Rees and Wijers 1998) similarly to what has been proposed for GRB 000301C (Bhargavi and Cowsik 2000). Li and Chevalier (2001) find that a spherical wind model (with ) and a jet model fit the radio data when using a steepening of the electron spectrum, invoking a non-standard, broken PL around a break Lorentz factor : = if and = if . They derive = 2.0 and = 3.3, being the later value consistent with .
3.1.2 The late–time light curve: another underlying SN?
If an underlying supernova (SN) would be present in the GRB 991208 light curve, this is expected to peak at 15(1+) days 25 days. GRB 990128 is a good candidate for such a search thanks to the rapid decay. Indeed, the late–time light curve in the optical band (specially in the R-band) cannot be acceptably fitted just with the power-law decline expected for the OA plus the constant contribution of the host galaxy (/dof = 8.32). The data is much better fitted when considering a third component, a type Ic SN1998bw-like component (Galama et al. 1998) at = 0.706 (/dof = 1.88). See Fig. 4. We have used SN1998bw because its likely relationship to GRB 980425.
Thus, GRB 991208 would be the sixth event for which contribution from a SN is proposed, after GRB 970228 (Reichart 1999, Galama et al. 2000b), GRB 970508 (Sokolov et al. 2001a), GRB 980326 (Castro-Tirado and Gorosabel 1999, Bloom et al. 1999a), GRB 990712 (Hjorth et al. 1999, Sahu et al. 2000) and GRB 000418 (Klose et al. 2000, Dar and De Rújula 2001). This reinforces the GRB-SN relationship for some long duration bursts and support the scenario in which the death of a massive star produces the GRB in the “collapsar” model (MacFadyen & Woosley 1999). Our results do not support the “supranova” model (Vietri & Stella 1998) for this event as the SN should have preceeded the GRB by few months.
But could the observations be explained by a dust echo instead ? Esin and Blandford (2000) presented an alternative explanation for the excess of red flux observed 20-30 days after GRB 970228 and GRB 980326, being scattering off dust grains, peaking around 4000 Å in the rest frame (i.e. in the R-band at = 0.706, as observed in GRB 991208). On the basis of VRIJK observations for GRB 970228, Reichart (2001) has concluded that the late-time afterglow of that event cannot be explained by a dust echo. For GRB 991208, only V- and R-band data (plus an upper limit in the I-band) are available at the time of the maximum, i.e. the light curve is not sufficiently well sampled to distinguish between a SN and a dust echo.
3.2 The host galaxy
Evidence for a brigh host galaxy came from the BTA/MPSF 4500-s spectrum of the GRB 991208 optical transient taken on 14 Dec (see Fig. 5). We found four emission lines at = 6350 Å, 8300 Å, 8550 Å, and 8470 Å, with the most likely identifications of these emission lines being: [OII] 3727 Å, Hβ 4861 Å, [OIII] 4959 Å, 5007 Å at a redshift of z = 0.7063 0.0017 (Dodonov et al. 1999b), a value confirmed by other measurements later on (Djorgovski et al. 1999). Line parameters are measured with Gaussian fit to the emission line and a flat fit to the continuum.
Considering the redshift of z = 0.7063 0.0017, H0 = 60 km s-1 Mpc-1, = 1 and = 0, the luminosity distance to the host is dL = 1.15 1028 cm, implying an isotropic energy release of 1.15 erg. Taking into accout the time of the break, tbreak 2 d, this implies an upper limit on the jet half-opening angle 8∘ n1/8 with the density of the ambient medium (in cm-3) (see Wijers and Galama 1999), and thus the energy release should be lowered by 100, i.e. the energy released is 1.15 erg.
For the galaxy, which is present in the late images (March-April 2000), the astrometric solution also obtained using the same 16 USNO-A stars was (), which is consistent with the OA position. See also Fruchter et al. (2000).
Our broad-band measurements of B = 25.19 0.17, V = 24.55 0.16, R = 24.27 0.15 on 31.9 Mar and I = 23.3 0.2 on 4.2 Apr, once derredened by the Galactic extinction imply a spectral distribution with = 1.45 0.33 ( per degree of freedom, dof = 1.20). See Sokolov et al. (2000) for further details. The unobscured flux density at 7510 Å, the redshifted effective wavelength of the B-band, is 0.65 Jy, corresponding to an absolute magnitude of MB = 18.2, well below the knee of the galaxy luminosity function, MB∗ 20.6 (Schechter 1976).
The star-forming rate (SFR) can be estimated in different ways. Again, we have assumed H0 = 60 km s-1 Mpc-1 and = 1, = 0. From the Hβ flux which is (3.84 0.33) x 10-16 erg cm-2 s-1, this corresponds to (18.2 0.6) M⊙ yr-1 (Pettini et al. 1998). From the [O II] 3727 Å flux (Kennicutt 1998), which is (1.79 0.22) x 10-16 erg cm-2 s-1 we get (4.8 0.2) M⊙ yr-1. The mean value, (11.5 7.1) M⊙ yr-1, is much larger than the present-day rate in our Galaxy. In any case, this estimate is only a lower limit on the SFR due to the unknown rest frame host galaxy extinction. See also Sokolov et al. (2001b).

| Line | Fluxes | - EW | FWHM |
|---|---|---|---|
| ID | (10-16 erg cm-2 s-1) | () | () |
| [OII] 3727 | (1.79 0.22) | 20 | 15.4 2.0 |
| Hβ | (3.84 0.33) | 93 | 22.3 2.2 |
| [OIII] 4958.9 | (1.61 0.32) | 80 | 18.7 4.5 |
| [OIII] 5006.9 | (4.90 0.33) | 244 | 20.8 1.9 |
3.3 The multiwavelength spectrum on Dec 12.0
We have determined the flux distribution of the GRB 991208 OA on Dec 12.0, 1999 UT by means of our broad-band photometric measurements (Dec 12.2) and other data points at mm and cm wavelengths (Dec 11.6-11.8) (Fig. 6). We fitted the observed flux distribution with a power law , where is the flux at frequency , and is the spectral index. Optical flux at the wavelengths of and passbands has been derived substracting the contribution of the host galaxy and assuming a reddening E(B-V) = 0.016 (Schlegel et al. 1998). In converting the magnitude into flux, the effective wavelengths and normalizations given in Bessell (1979) and Bessell and Brett (1988) were used. The flux densities, are 11.5, 16.7, 22.0 and 24.2 Jy at the effective wavelengths of and passbands, not corrected for possible intrinsic absorption in the host galaxy. The fit to the optical data Fν gives (dof = 5.7). This about 2 above the value of given on Dec 16.6 with the Keck telescope (Bloom et al. 1999b) and for the spectral index between optical to IR wavelengths (that differs from the one given by Sagar et al. 2000) when considering .
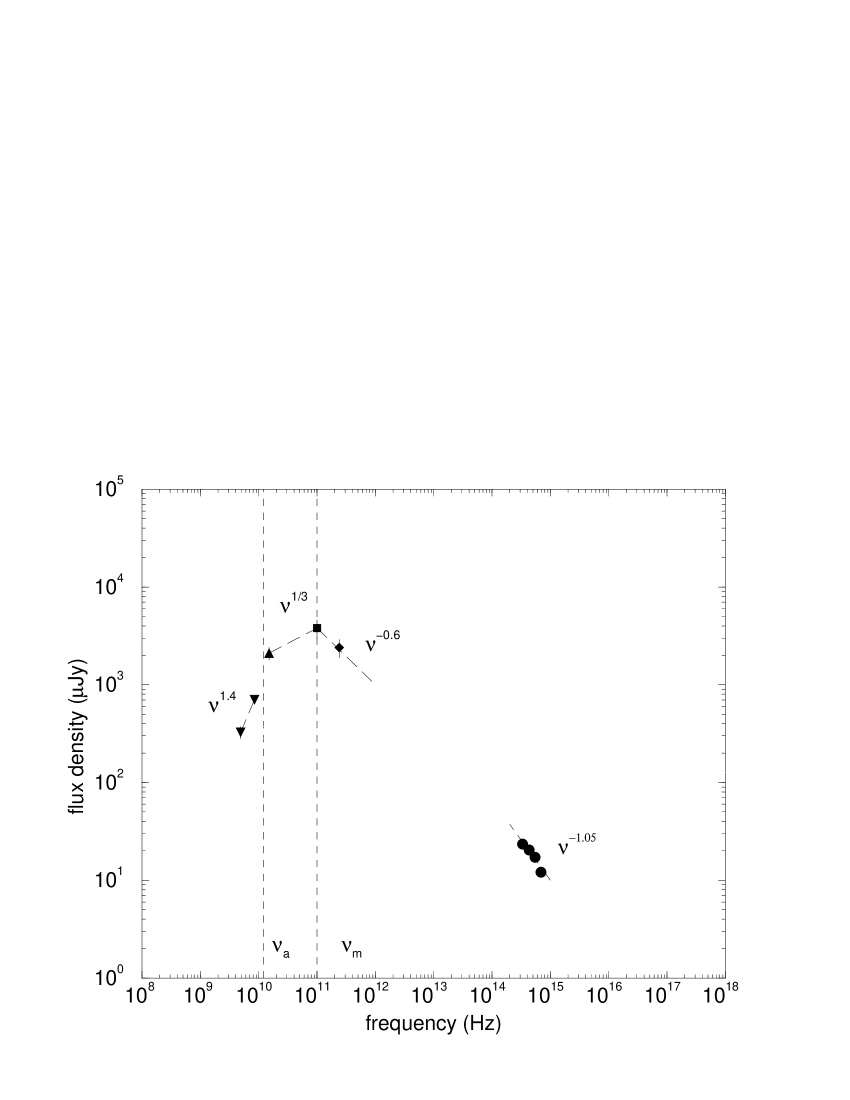
From the maximum observed flux (Shepherd et al. 1999), we derive a rough value of 100 GHz. The low-frequency spectrum below () is in agreement with the expected tail of the synchrotron radiation plus a self absorption that becomes important below a critical frequency 13 GHz, taking into account that in the range 4.86-8.46 GHz (Frail et al. 1999), deviating from as seen for 15 GHz 100 GHz (Pooley et al. 1999). Much more accurate estimates for and are given by Galama et al. (2000a). Above , the IRAM observations (Bremer et al. 1999a,b) indicate a Fν , with a cooling frequency 3 1011 GHz 3 1014 GHz. Then we expect a slope between and of = (p1)/2 = 0.68 0.06, consistent with the observed value. As we have already mentioned, if the = 2.3 jet model is correct, by this time (Dec 12.0 UT), the cooling break should be already below the optical band, with an optical synchrotron spectrum = that is in agreement with our optical data (). Therefore our Dec 12.0 observations support a jet model with = 2.30 0.07, marginally consistent with = 2.52 0.13 as proposed by Galama et al. (2000a) on the basis of a fit to the multiwavelength spectra from the radio to the R-band data.
4 Conclusion
Most currently popular theories imply a direct correlation between star formation and GRB activity. How does GRB 991208 fit into this picture ? The angular coincidence of the OA and the faint host argues against a compact binary merger origin of this event (Fryer et al. 1999) and in favor of the involvement of a massive star (Bodenhaimer and Woosley 1983, Woosley 1993, Dar and De Rújula 2001). The very rapid photometric decline of the afterglow of GRB 991208 provided hope for the detection of the much fainter light contamination from the underlying supernova, what we have confirmed on the basis of the late-time R-band measurements, thus giving further support to the massive star origin. There are still many unsolved riddles about GRBs, like the second break in the light curve of this event, i.e. responsible for the steep decay seen after 5 days. The community continues to chase GRB afterglows, and with every new event we make progress by finding more clues and creating even more new puzzles.
Acknowledgements. The Calar Alto German-Spanish Observatory is operated jointly by the Max-Planck Institut für Astronomie in Heidelberg, and the Comisión Nacional de Astronomía, Madrid. The Sierra Nevada Telescope is operated by the Instituto de Astrofísica de Andalucía (IAA). The Nordic Optical Telescope (NOT) is operated on the island of La Palma jointly by Denmark, Finland, Iceland, Norway and Sweden, in the Spanish Observatorio del Roque de los Muchachos (ORM) of the Instituto de Astrofísica de Canarias (IAC). The data presented here have been taken using ALFOSC, which is owned by the IAA and operated at the NOT under agreement between the IAA and the NBIfA of the Astronomical Observatory of Copenhagen. This paper is also based on observations made with the Italian Telescopio Nazionale Galileo (TNG) operated on the island of La Palma by the Centro Galileo Galilei of the CNAA (Consorzio Nazionale per l’Astronomia e l’Astrofisica) at the Spanish ORM of the IAC. We thank P. Garnavich and A. Noriega-Crespo for making available to us the VATT image taken on Dec. 12.52 UT, A. Fruchter for his comments and appreciate the generous allocation of observing time at the Calar Alto, Roque and Teide observatories. We are grateful to R. Gredel, U. Thiele, J. Aceituno, A. Aguirre, M. Alises, F. Hoyos, F. Prada and S. Pedraz for their support at Calar Alto, C. Packham (INT Group) for his help to obtain the WHT spectra, the TNG staff for their support and to J. M. Trigo (Univ. Jaime I) for pointing us the existence of the German meteor films. KH is grateful for Ulysses support under JPL Contract 95805. J. Gorosabel acknowledges the receipt of a Marie Curie Research Grant from the European Commission. This research was partially supported by the Danish Natural Science Research Council (SNF) and by a Spanish CICYT grant ESP95-0389-C02-02. V. V. Sokolov, T. A. Fatkhullin and V. N. Komarova thank the RFBR N98-02-16542 (”Astronomy” Foundation grant 97/1.2.6.4) and INTAS N96-0315 for financial support of this work.
References
- (1) Bertin, E. and Arnouts S. 1996, A&A 117, 393
- (2) Bessell, M. S. 1979, PASP 91, 589
- (3) Bessell, M. and Brett, J. M. 1988, PASP 100, 1134
- (4) Bhargavi, S. G. and Cowsik, R. 2000, ApJ 545, L77
- (5) Bloom, J. S. et al. 1999a, Nat 401, 453
- (6) Bloom, J. S. et al. 1999b, GCN Circ. No. 464
- (7) Bodenhaimer, P. and Woosley, S. E. 1983, ApJ 269, 281
- (8) Bremer, M. et al. 1999a, GCN Circ. No. 459
- (9) Bremer, M. et al. 1999b, IAU Circ. No. 7333
- (10) Castro-Tirado, A. J. et al. 1998, Sci 279, 1011
- (11) Castro-Tirado, A. J. and Gorosabel, J. 1999, A&A 138, 449
- (12) Castro-Tirado, A. J. et al. 1999a, GCN Circ. No. 451
- (13) Castro-Tirado, A. J. et al. 1999b, IAU Circ. No. 7332
- (14) Castro-Tirado, A. J. et al. 1999c, Sci 283, 2069
- (15) Castro-Tirado, A. J. 2001, ESA-SP Conf. Proc., in press (astro-ph/0102122)
- (16) Chevalier, R.A. and Li, Z.-Y. 1999, ApJ 520, L29
- (17) Costa, E. et al., 1997, Nat 387, 783
- (18) Dar, A. & De Rújula, A. 2001, A&A, submitted (astro-ph/0008474)
- (19) Dodonov, S. et al. 1999a, GCN Circ. No. 461
- (20) Dodonov, S. et al. 1999b, GCN Circ. No. 475
- (21) Djorgovski, S. G. et al. 1999, GCN Circ. No. 481
- (22) Esin, A. A. and Blandford, R. 2000, ApJ 534, L151
- (23) Fishman, G. J. and Meegan, C. A. 1995, ARA&A 33, 415
- (24) Frail, D. et al. 1999, GCN Circ. No. 451
- (25) Fruchter, A. et al. 1999, ApJ 519, L13
- (26) Fruchter, A. et al. 2000, GCN Circ. No. 872
- (27) Fryer, C. L., Woosley, S. E., Hartmann, D. H. 1999, ApJ 526, 152
- (28) Galama, T. J. et al. 1998, Nat 395, 670
- (29) Galama, T. J. et al. 1999, ApJ 536, 185
- (30) Galama, T. J. et al. 2000a, ApJ, 541, L45
- (31) Galama, T. J. et al. 2000b, ApJ, 536, 185
- (32) Garnavich, P. and Noriega-Crespo, A. 1999, GCN Circ. No. 456
- (33) Henden, A. A. 2000, GCN Circ. No. 631
- (34) Halpern, J. P. et al. 1999, ApJ 517, L105
- (35) Halpern, J. P. and Helfand, D. J. 1999, GCN Circ. No. 458
- (36) Harrison, A. J. et al. 1999, ApJ 523, L121
- (37) Hjorth, J. et al. 1999, ApJ 534, L147
- (38) Huang, Y. P., Dai, Z. G. and Lu, T. 2000, A&A 355, L43
- (39) Hurley, K. et al. 2000, ApJ 534 , L23
- (40) Jensen, B. L. et al. 1999, GCN Circ. No. 454
- (41) Jensen, B. L. et al. 2001, A&A, in press (astro-ph/0005609)
- (42) Kennicutt, R. C. 1998, ARA&A 36, 189
- (43) Klose, S. 2000, Reviews in Modern Astronomy, 13, in press (astro-ph/0001008)
- (44) Klose, S. et al. 2000, ApJ 545, 271
- (45) Kulkarni, S. R. et al. 1999, Nat 398, 389
- (46) Li, Z.-Y. and Chevalier, R. A. 2001, ApJ, submitted (astro-ph/0010288)
- (47) MacFadyen, A. I. and Woosley, S. E. 1999, ApJ 524, L62
- (48) Madau, P., Pozzeti, L. and Dickinson, M. 1998, ApJ 408, 106
- (49) Masetti, N. et al. 2000, A&A, 359, L23
- (50) Mészáros, P. and Rees, M. J., 1997, ApJ. 476, 232
- (51) Mészáros, P., Rees, M. J. and Wijers, R. A. M. J. 1998, ApJ 499, 301
- (52) Mészáros, P. and Rees, M. J., 1999, MNRAS 306, L39
- (53) Metsger, M. R. et al. 1997, Nat 387, 879
- (54) Oke, J. B. et al. 1995, PASP 107, 375
- (55) Pettini, M. et al. 1998, ApJ 508, L1
- (56) Piran, T. 1999, Phys. Rep. 314, 575
- (57) Pooley, G. et al. 1999, GCN Circ. No. 457
- (58) Reichart, D. E. 1997, ApJ 485, L57
- (59) Reichart, D. E. 1999, ApJ 521, L111
- (60) Reichart, D. E. 2001, ApJ, in press (astro-ph/0012091)
- (61) Rhoads, J. E. 1997, ApJ 487, L1
- (62) Rhoads, J. E. 1999, ApJ 525, 737
- (63) Rhoads, J. E. and Fruchter, A. S. 2001, ApJ 546, 117
- (64) Sagar, R., Mohan, V., Pandey, A. K., Pandey, S. B. and Castro-Tirado, A. J. 2000, Bull. Astron. Soc. India 28, 15
- (65) Sahu, K. C. et al. 2000, ApJ 540, 74
- (66) Sari, R. Piran, T. and Narayan, R. 1998, ApJ 497, L17
- (67) Sari, R. Piran, T. and Halpern, J. P. 1999, ApJ 519, L17
- (68) Schechter, P. 1976, ApJ 203, 297
- (69) Schlegel, D. J., Fikbeiner, D. P. and Davis, M. 1998, ApJ 500, 525
- (70) Shepherd, S. et al. 1999, GCN Circ. No. 455
- (71) Sokolov, V. et al. 2000, A&A, submitted (astro-ph/0006207)
- (72) Sokolov, V. et al. 2001a, Proc. of the Second Rome GRB Workshop, Gamma-ray bursts in the afterglow Era, in press.
- (73) Sokolov, V. et al. 2001b, A&A, submitted
- (74) Stanek, K. Z. et al. 1999, ApJ 522, L39
- (75) Stecklum, B. et al. 1999, GCN Circ. No. 453
- (76) Stetson, P. B. 1987, PASP 99, 191
- (77) van Paradijs, J. et al. 1997, Nat 386, 686
- (78) van Paradijs, J., Kouveliotou, C. and Wijers, R. 2000, ARA&A 38, 379
- (79) Vietri, M. and Stella, L. 1998, ApJ 507, L45
- (80) Waxman, E. 1997, ApJ 491, L19
- (81) Wei, D. M. and Lu, T. 2000, ApJ 541, 203
- (82) Wijers, R. M. A. J., Rees, M. J. and Mészáros, P. 1997, MNRAS 288, L51
- (83) Wijers, R. M. A. J. and Galama, T. J. 1999, ApJ 523, 171
- (84) Woosley, S. E. 1993, ApJ 405, 273