Mapping the inner accretion disk of the galactic black hole J1550–564 through its rise to outburst
Abstract
We study the spectral properties of the first 14 observations of the rise to outburst phase of the X–ray transient J1550–564. Using both the PCA and HEXTE instruments, we find that the 3–200 keV spectra smoothly pass from a standard low/hard state to a very high state. The classic high state is never encountered possibly indicating that it is not a phenomenon of the rise phase. We find that the individual PCA spectra can be fitted adequately by a disk black body and a thermal Comptonization model which includes reflection. Once the very high state is reached there is clear spectral curvature of the continuum which possibly indicates the presence of a composite thermal/non-thermal plasma.
Our detailed modelling of the reflection parameters shows a sharp increase in mean ionization at the onset of the transition between the low state and very high state. There is a related variability in the reflected fraction but its exact value depends on the continuum model used. The reflected fraction varies around values of and is never consistent with . We can constrain the inner radius using relativistic smearing and while there are large uncertainties, the data are incompatible with a disk extending to the last stable orbit () in either state.
Since the system is on the rise to outburst, the disk instability models (and observed increasing QPO frequency) strongly imply that there is no standard inner disk at the time the low state spectrum is observed. This is compatible with a truncated disk, filled by an X–ray hot, advection dominated accretion flow. However, magnetic flares above the outbursting disk can also match the observed spectra once the effects of either outflow and/or strong photoionization of the surface of the disk are included. We clearly see strong ionization of the reflector in the very high state. This is probably from collisional ionization, as the disk surface temperature is keV. This can strongly suppress reflection from the inner disk.
keywords:
accretion, accretion disc – black holes physics – binaries: general – X-ray: stars – stars: individual (RXTE J1550–564)1 Introduction
Accreting galactic black hole candidates (GBHCs) offer the most direct method of investigating accretion physics. They are free of magnetic fields and surface boundary layers and so have the simplest possible accretion flow. Many of these systems are also transient, showing huge X–ray outbursts where the luminosity rises by many orders of magnitude over a short time and then fades away more slowly. The evolution of their spectra and variability during these outbursts can be used to determine the nature of the accretion flow as a function of mass accretion rate onto the central object.
It is now generally believed that the outbursts are caused by a classic disk instability. In quiescence the material in the disk is cool, so the sound speed is slow, and the mass accretion rate through the disk is smaller than the mass transfer rate from the companion star. The material then builds up on the outer edge of the disk and the structure is very different from that of a steady state disk (Shakura & Sunyaev 1973, hereafter SS). When the local temperature in any part of this quiescent disk reaches , hydrogen begins to ionize. This results in a sudden increase in opacity, causing an increase in temperature and the local sound speed, and so giving an increase in local mass accretion rate. The disk interior to this point then receives this higher mass accretion rate, which can trigger a heating wave that propagates inwards (and outwards). This switches the disk into the hot state, which is well described by an SS disk but with a mass accretion rate which is much higher than that from the companion star. Over time, this depletes the disk, draining it sufficiently to switch back into the cool state (see e.g the review by Osaki 1996, with applications to the black hole transients in King & Ritter 1998).
This picture fails to explain the observed spectra during both outburst and quiescence. The SS disk models assume that the gravitational potential energy of the accreting matter is dissipated in optically thick material, so it thermalizes with a maximum temperature of keV. In quiescence the disk is very cool, K independent of radius (e.g. Cannizzo 1998), and so emits no high energy flux. Yet observations show that these systems generically produce hard X–ray emission. At high mass accretion rates (approaching Eddington) the spectra are dominated by a soft component at keV with a strongly (very high state: VHS) or weakly (high state: HS) Comptonized component (which is occasionally below the detection limit). The Comptonized component forms a rather steep power law tail () which extends out beyond keV in the few objects with good high energy data (Grove et al. 1998). At lower mass accretion rates, below per cent of Eddington, there is a rather abrupt transition when the soft component drops in temperature and luminosity. Instead this (low state: LS) spectrum is dominated by thermal Comptonization, with , rolling over at energies of keV (see e.g. the reviews by Tanaka & Lewin 1995; van der Klis 1995; Nowak 1995). At even lower luminosities, during quiescence, there is weak hard X–ray emission which appears to be similar to the LS spectrum (e.g. Kong et al. 2000).
There are several possible ways to produce the hard X–rays, but all require that some fraction of the accretion energy is dissipated in an optically thin environment. The two main candidates currently considered are magnetic flares above the disk, generated by the Balbus–Hawley MHD dynamo responsible for the disk viscosity, or that the inner disk is replaced by an optically thin, X–ray hot accretion flow. Little is known about the spectrum expected from electrons heated through magnetic reconnection, but the observed weak disk emission in the LS can be explained if most of the viscous dissipation is released in a patchy or out-flowing magnetic corona (Svensson & Zdziarski 1994; Stern et al. 1995; Beloborodov 1999). By contrast, the properties of an optically thin accretion flow can be worked out in some detail, typically giving electron temperatures of keV (cooling dominated by radiation: Shapiro, Lightman & Eardley 1976; or advection: Narayan & Yi 1996). These can exist only at fairly low mass accretion rates as they rely crucially on the assumption that the accretion energy is given mainly to the protons, and that the electrons are only heated via Coulomb collisions. At high densities (i.e. high mass accretion rates) then the electrons efficiently drain energy from the protons and the flow collapses back into an SS disk. Hence these flows can contribute only to the hard X–rays in LS or quiescent emission. The collapse of such flows may give the physical mechanism for the LS/VHS state transition (Esin, McClintock & Narayan 1997). In the HS and VHS then magnetic reconnection is an obvious candidate for the X–ray tail. However, there is also a radio jet/outflow seen in the LS and VHS which may also play a role in the X–ray emission (Fender 2000).
In summary, for quiescence and LS there are two potential mechanisms for the hard X–ray production. One of these has a truncated disk, and an inner optically thin, hot flow, while the other has a (steady state or quiescent) disk which extends down to the last stable orbit. If there is a truncated disk in quiescence/LS, then the disk material has to move in order to give the HS and VHS spectra which are dominated by emission from an optically thick, inner disk. Data from the rise to outburst of a GBHC transient would then give one of the best diagnostics of the nature of the accretion flow as the majority of the disk material is known to be moving inwards in this phase.
Such data have only recently become possible with the rapid response of the RXTE satellite. RXTE J1550–564 is the first GBHC to be intensively observed during its rise to outburst phase, as well as its decline, giving unprecedented coverage of the X–ray spectrum over a huge range in mass accretion rate. These data give several ways to observationally track the disk. Firstly there are the Quasi–Periodic Oscillations (QPO’s) seen in the X–ray spectra. While the origin of these are not well understood, all QPO models use a characteristic radius (this radius is a local change in disk properties and is sometimes associated with the inner edge of an SS disk, e.g Psaltis & Norman 2001). For the QPO frequency to change then requires that this radius is not fixed at the last stable orbit of (where ). RXTE J1550–564 shows a dramatic increase in QPO frequency during the rise, by a factor of (Cui et al. 1999, Remillard et al. 1999), most probably indicating that the transition radius (or SS disk radius) is moving inwards during the rise (di Matteo & Psaltis 1999)
A second way to track the inner disk is to use X–ray reflection. Hard X–rays illuminating optically thick material give rise to a Compton reflection component and associated iron fluorescence line (Lightman & White 1988; George & Fabian 1991; Matt, Perola & Piro 1991). These features are smeared by special and general relativistic effects of the motion of the disk in the deep gravitational potential well (Fabian et al. 1989). The amount of reflection gives the solid angle of the optically thick disk as observed from the hard X–ray source, while the amount of smearing shows how far the material extends into the gravitational potential of the black hole.
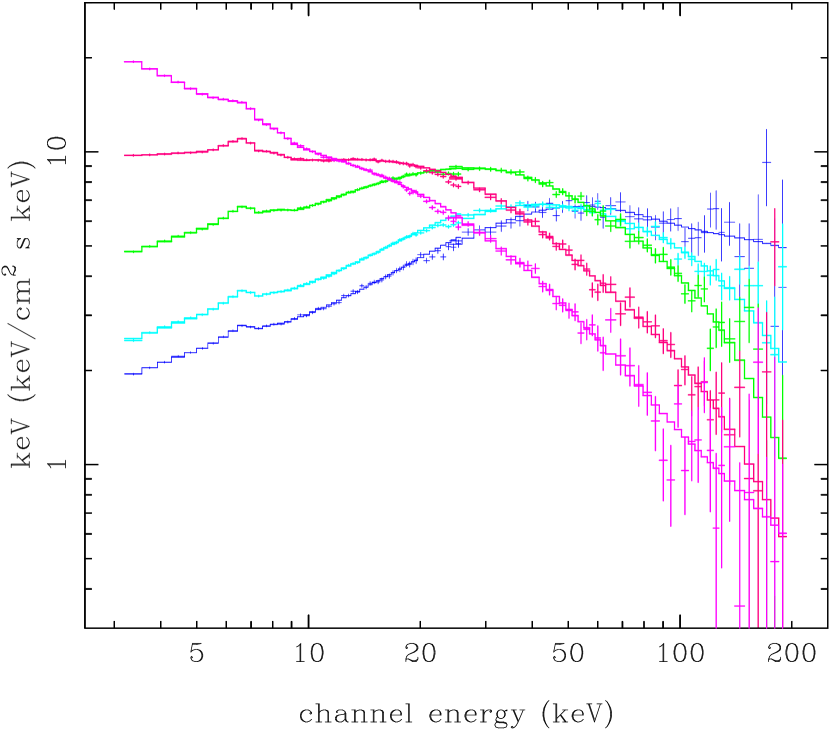
Here we analyze the detailed spectral properties during the rise phase. The 3-200 keV spectral changes during this time are shown in Figure 1. The 2–20 keV spectrum showed a dramatic softening during the rise (See the light curve and hardness ratio plots in Sobczak et al. 1999), concurrent with a change in the variability power spectrum (Cui et al. 1999). Taken together, these imply a LS/VHS state transition during the rise. We examine the PCA and HEXTE spectra, showing that the broadband continuum is indeed consistent with a LS/VHS transition, and identify a smeared reflected component in all the spectra. For the LS, the reflection signature is similar to that seen in other LS spectra, i.e. reflection from mainly neutral material, which subtends a solid angle of substantially less than and is broadened, but not by as much as expected if the reflecting material extended down to the last stable orbit (Gierliński et al. 1997; ycki, Done & Smith 1997; Done & ycki 1999; Gilfanov et al. 1999; Zdziarski, Lubiński & Smith 1999). Given that both the disk instability model and QPO data imply a truncated SS disk at this point then this strongly favours models which identify the LS with a truncated disk, and rules out models which require an inner disk (of the Shakura and Sunyaev form) for the source of the hard X–ray emission in the LS.
2 The rise to outburst data from RXTE J1550–564
Calibration issues are important in any detailed spectral analysis. We have attempted to quantify these by analyzing a Crab spectrum taken contemporaneously with the RXTE J1550–564 rise data. The Crab spectrum is complex, since it contains both the nebula and pulsar components. The synchrotron nebula gives a spectrum which is approximately a power law () in the 3–20 keV band, although there is subtle spectral curvature over a wider bandpass (e.g. Atoyan & Aharonian 1996). The pulsar spectrum is generically harder but has stronger curvature and is phase variable. It is consequently only approximately a power law over a rather restricted energy band (see e.g. Pravdo, Angelini & Harding 1997; Massaro et al. 2000 and references therein). We approximate the total spectrum in the 3–20 keV range by two power laws, representing the nebula and pulsar, respectively. We fix the pulsar component to a spectral index of and its flux at 10–20 % of that of the nebula, and obtain a good fit () using only the top layers from detectors 0 and 1, with systematic errors.
Given the complex nature of the total emission from the Crab, the HEXTE data should not lie on a single power law extrapolation of the PCA. This is an important point, since this ‘discrepancy’ has been used to argue that the PCA–HEXTE cross calibration is unreliable (Sobczak et al. 1999). While work on the cross calibration is still ongoing, there is currently no reason not to fit the two datasets together, allowing for a normalization offset.
We have used the public RXTE dataset 30188-06, which traces the rise of the outburst from 07/09/98 to the 16/09/98. The PCA (detectors 0,1 top layer only) and HEXTE (detector 0 only) data were extracted using the REX script in FTOOLS 5.0. Systematic errors of 0.5% were added to all the PCA spectra. Selected spectra from the rise are shown in Figure 1, showing the dramatic spectral softening. Although the 2-10 keV light curve of the ASM shows a spectacular increase in luminosity (a factor of ), figure 1 shows that this is a bandpass effect caused by ignoring the higher energies. The estimated bolometric luminosity only increases by a factor of .
3 model description
We analyzed the spectra using the XSPEC spectral fitting package (Arnaud 1996) v10.0. The spectrum is expected to contain soft emission from the accretion disk, which we model using the diskbb and hard emission from Compton scattering of these soft seed photons by energetic electrons. A power law with exponential rollover at the electron energy is often used to approximate this, but it seriously overestimates the Comptonized flux at energies close to those of the seed photons, and underestimates it below the cutoff. This renders most parameters derived from such models unreliable. Instead we use an approximate solution for thermal Comptonization based on Kompaneets’ equation (thComp: Zdziarski, Johnson & Magdziarz 1996). Inherent limitations on the Kompaneets’ equation mean that this solution becomes inaccurate at optical depths and temperatures above keV. The Comptonized spectrum can illuminate the accretion disk, giving rise to a reflected (reprocessed) component. Both the continuum reflection (Magdziarz & Zdziarski 1995) and iron emission line are calculated self–consistently for a given ionization state (ycki & Czerny 1994), and the total reprocessed spectrum is then relativistically smeared by convolving it with the diskline model of Fabian et al. (1989) including corrections for light bending. The reflected spectrum is then determined by the solid angle of the reflector as seen from the X–ray source, , normalized to , its inclination , ionization parameter, (where is the illuminating flux and number density), and inner disk radius, (see ycki ,Done and Smith 1999 for model details). The abundances of Morrison & McCammon (1983) are used.
There are as yet no good determinations of inclination of the system, so we fix this at . The distance is also fairly uncertain, but E(B–V) measured from optical spectra suggests 2.5 kpc (Sanchez–Fernandez et al. 1999). This E(B–V) predicts a column density of cm-2, consistent with the column we measure from fitting the publicly available archived ASCA GIS data (sequence ID 15606000 taken on 12/09/98). We fix the column to this value in all the fits, and note that the much larger column of cm-2 inferred by Sobczak et al. (1999) is an artifact of their more approximate spectral model.
4 results
4.1 Initial spectrum
The PCA data alone cannot be well fit by a thermal Comptonization continuum and disk blackbody spectrum (). Including a reflected spectrum and its associated iron fluorescence line gives a good fit to the data (), but this is further significantly improved by including relativistic smearing (, for ). The reflected fraction is from mainly neutral material, . The disk blackbody is not significantly detected in the spectrum, and assuming that it provides the soft photons for the thermal Comptonization gives a limit on its temperature of keV).
These findings are qualitatively different to those derived from using more approximate spectral models. The often used continuum of a disk blackbody and power law, together with a broad Gaussian line and smeared edge to phenomenologically model the reflected spectral features (as used for later parts of the outburst in Sobczak et al. 1999) gives a comparably good fit if the column is allowed to be free (). With this model the disk blackbody is required, and has keV. We strongly caution against using parameters derived from such phenomenological fits to derive physical quantities such as disk radii (see also the detailed criticism of the diskbb model of Merloni, Fabian & Ross 2000).
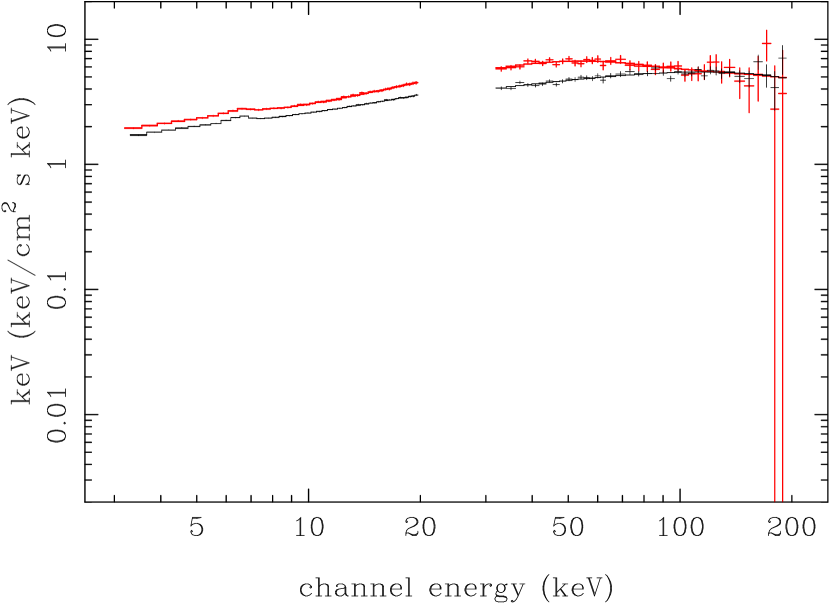
The model is further constrained if the HEXTE data (30–200 keV) is used as the electron temperature can be determined from the high energy rollover in the spectrum. A single thermal Comptonization model (with its relativistic reflection) can fit both PCA and HEXTE data (), as shown in the upper panel of figure 2. The reflection parameters remain similar to those derived from the PCA data alone, , and . However, the broad bandpass covered also shows evidence for subtle spectral curvature which can be modelled by including a second Comptonized component. This gives a significantly better fit and is shown in the lower panel () but for rather different reflected parameters (, and ). The second Compton component has a shape which is clearly rather similar to a reflection hump, so if this is the shape of the continuum then it significantly reduces the derived reflected fraction.
While this spectral curvature is significantly detected it does not necessarily mean that the continuum is truly described by a two (or multi–) temperature form. Firstly, it could artifact of residual cross–calibration uncertainties between the PCA and HEXTE instruments (although the spectral curvature is marginally detected in the PCA data alone: including a second Comptonized component (with its reflection tied to that of the first Comptonized spectrum) gives a reduction in to ). It could also indicate that the reflected spectral models used here underestimate the Compton reflection hump, such as might be expected if there was an ionized skin overlying a neutral disk which produced Compton reflection but no spectral features (Nayakshin, Kazanas & Kallman 2000, Done & Nayakshin 2001). Alternatively there can be complex curvature in a Comptonized spectrum due to the visibility of the individual scattering orders (e.g. Pozdnyakov, Sobol,& Sunyaev 1983), which are not included in our approximate thComp model. We use an exact solution of the Comptonization equations for optically thin material (CompPS: Poutanen & Svensson 1996). This does not include the self–consistent line emission for the reflection spectrum, so the line is included as a diskline with free energy and normalisation. This gives a comparable fit to the PCA plus HEXTE data as the single thComp model , with and i.e. for similar reflected parameters to the single Compton component model.

However the initial spectrum is modelled, it is very similar to the classic Low State spectra seen in many Galactic Black Holes (little or no Black Body and a large Compton component). The power spectrum of these data shown by Cui et al. (1999) is also very similar to low/hard state power spectra (e.g. van der Klis 1995), being flat below Hz, breaking to , and then to above Hz, with a high fractional r.m.s. amplitude of . Comparing these with the compilation of RXTE Cyg X–1 data of Gilfanov, Churazov & Revnivtsev (1999) shows that both spectrum and variability are typical of Cyg X–1 in its hardest low/hard state observed by RXTE.
We illustrate this spectrally by showing the hardest low/hard spectrum of the RXTE Cyg X–1 observation (10238-01-03-00), extracted identically to the J1550–564 data. We fit this to the same spectral model of a disk black body and two Comptonized continua (together with their reflected emission). This gives an excellent fit, with . Figure 3 shows this with the data from RXTE J1550–564 over-plotted. Again, the spectrum is slightly curved: a single Compton continuum and its reflection gives a significantly worse fit (), although again this could be due to the same cross-calibration uncertainties rather than necessarily pointing to a more complex continuum or reflected spectrum. Even the normalizations are similar, assuming that they are both at similar distances (Cyg X–1 is at kpc: Gierliński et al. 1999). We conclude that in the first part of the rise then RXTE J1550–564 was in a classic LS.
4.2 Final spectrum
The model which provided an acceptable fit to the LS PCA data (disk blackbody as seed photons for thermal Comptonization and its reflected spectrum with relativistic smearing) also gives an adequate fit to the final spectrum () but with very different parameters. The disk blackbody is now significantly detected, with keV, and there is significant spectral curvature in the PCA spectrum which causes the derived electron temperature to be keV, much lower than the LS. The ionization state of the reflector is now extremely high, . The phenomenological model (a disk black body and powerlaw) gives a statistically similar fit, , with seed photon temperature keV. Including the HEXTE data shows that the phenomenological model is inadequate. A of is found although this drops to with an exponential rollover in the continuum.
The single Comptonized component and its reflection (with a disk blackbody from the accretion disk) can fit the PCA and HEXTE data adequately (), with , and . Once again there are hints of spectral curvature. Using a second Compton component again gives a (marginally significantly) better fit () which is shown in Figure 4. However, this time the reflection parameters are robust to changes in the spectral form, with , and for the two thComp continuum, and , and for a single CompPS continuum.
The two temperature model continuum is gives a combination of low energy curvature with a high energy tail which is very similar to that seen in Cyg X–1 in its high state (Poutanen & Coppi 1998; Coppi 1999; Gierliński et al. 1999), the difference here being that low temperature Comptonized emission is much stronger in RXTE J1550–564 (thus making the disk emission less obviously dominant) than in the HS of Cyg X–1. This, together with its power spectrum (Cui et al. 1999) clearly show that by the end of slow rise RXTE J1550–564 is in the very high state. The classic high/soft state (defined as that which contains a dominant black body spectrum and little or no Comptonized component) is never encountered during the rise, and the spectral transition is from LS to VHS.

4.3 Intermediate Data
Any system of models must be able to fit all the data, so here we look at a spectrum taken from the middle of the rise (spectrum number 3), where the hardness ratio clearly indicates that the source is in transition. A single Compton component model using the PCA data alone gives with , , and , but including the HEXTE data gives , a completely inadequate fit. The curvature is not well modeled even by CompPS which gives . The two component Comptonization model is the only one which gives a good fit to the broad band data (), as shown in Figure 5. The reflection parameters are then similar to those derived from the PCA data alone with , , and . The nature of the spectral curvature is now not at all subtle, and the spectrum clearly shows that there is a low temperature, curving component in the PCA, together with rather higher temperature emission which dominates the HEXTE band. In the final spectrum the lower temperature component is somewhat hotter and dominates more of the high energy spectrum, making the single temperature models an adequate description.

4.4 All Data
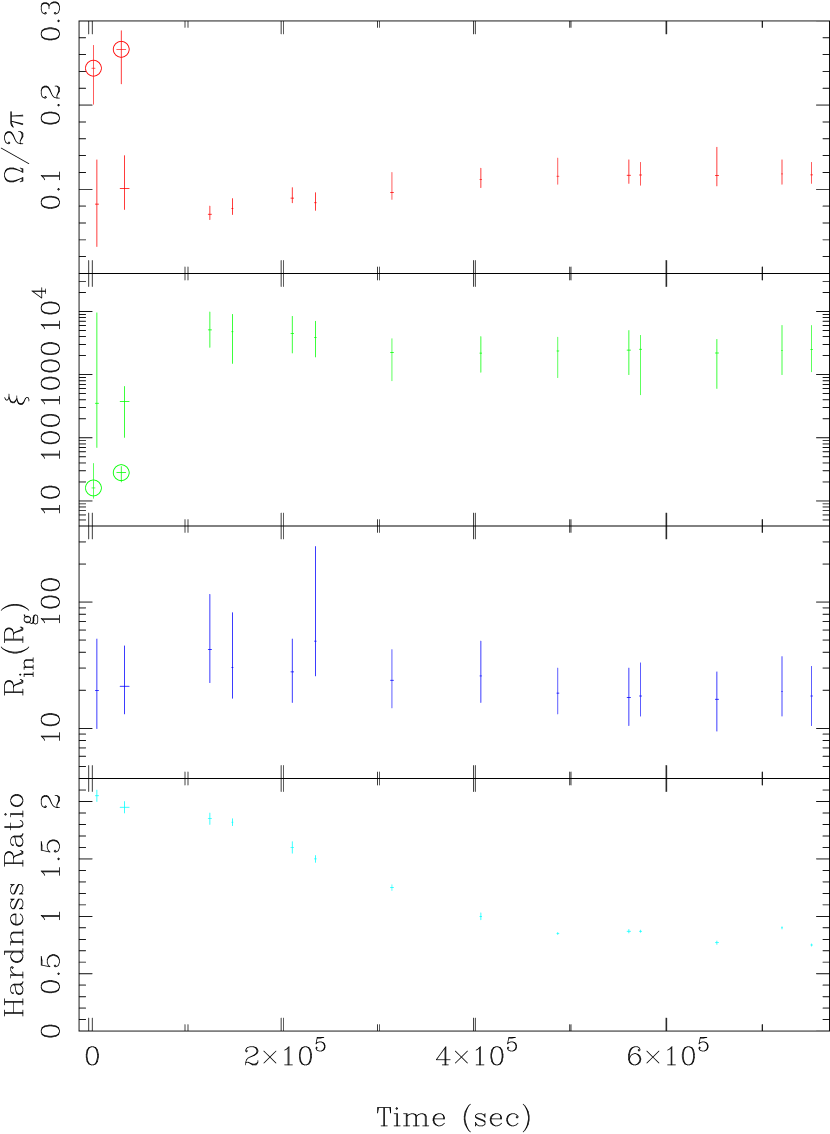
We are interested in how the reflected spectrum varies during the transition, yet the previous sections have shown that these are not always robust to changing the continuum spectral form. Accordingly we give results for two set of spectral fits. In the first we assume that the HEXTE cross–calibration is reliable and fit all the rise PCA/HEXTE spectra with a model consisting of seed disk blackbody photons, together with two thermal Compton continua and their relativistically smeared reflection (Table 1). The last column of Table 1 gives the for a single Compton continuum model to the PCA/HEXTE data, showing that it cannot acceptably fit most of the intermediate spectra (see previous section). The second set of fits assumes that the HEXTE cross–calibration is not reliable at this level and so uses only the PCA data with a model of seed disk blackbody photons, a single temperature thermal Compton continuum and its relativistically smeared reflection (Table 2). Given the uncertainty on the continuum model (and the fact that the temperatures derived from thComp are inaccurate above keV) we show spectral evolution by the changing hardness ratio of the PCA data.
For the single temperature continuum fits to the PCA data the onset of the LS–VHS transition is marked by an increase in ionization state of the reflector from to and a decrease in the solid angle subtended by the disk, from . Apart from this jump at spectrum 3 the parameters are remarkably stable throughout large changes in spectral form. This stability is even more marked in the two temperature PCA/HEXTE fits. There is some indication of a jump in ionization at spectrum 3, at the onset of the LS–VHS transition, though it is less significant due to the larger error bars on the reflection parameters from the LS data. However, there is no evidence for any change in the solid angle.
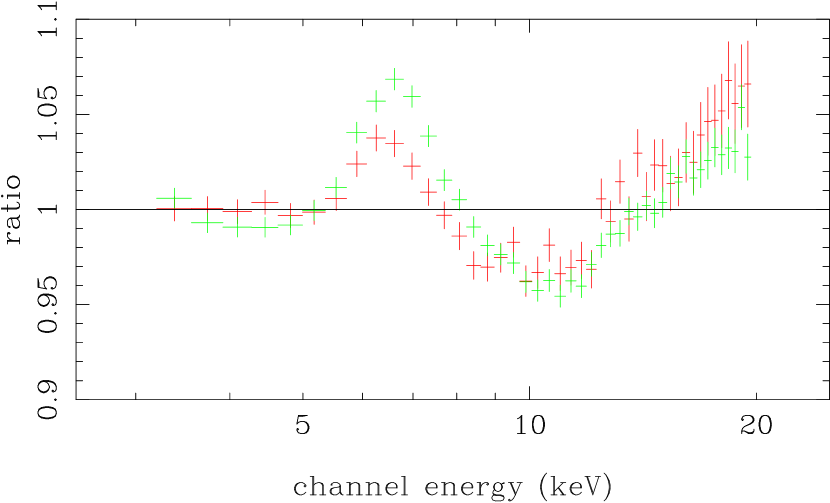
Ionization and the amount of reflection are correlated in the fits. As the ionization increases the photoelectric opacity decreases, so there is more reflected continuum below keV. The spectral features (line and edge) shift to higher energies, and their contrast with respect to the continuum increases (although this also depends on the hardness of the illuminating continuum). In general the line increases by more than the edge as the fluorescence yield increases with ionization state (see e.g. Ross & Fabian 1993; ycki & Czerny 1994 for photo–ionized reflected spectra). Figure 6 shows the residuals to the best fit continuum only model (disk blackbody and single thermal Compton spectrum but no reflection) to the data before and after the transition (PCA spectra 1 and 5). There is clearly more line and its mean energy has shifted up, indicating ionization. The edge energy has also increased, but its strength has not. While ionization predicts that the line should increase by more than the edge, the edge depth should also increase if the solid angle remains the same. So to get increasing ionization with the same edge depth requires that the solid angle decreases.
| Spectrum number | 111Solid angle subtended by reflector | 222Ionization parameter | Inner radius 333Measured in gravitational radii, | hardness ratio 444Ratio of 8-20keV and 1-5keV data | 555For two Compton components | 666For one Compton component |
|---|---|---|---|---|---|---|
| 1 | ||||||
| 2 | ||||||
| 3 | ||||||
| 4 | ||||||
| 5 | ||||||
| 6 | ||||||
| 7 | ||||||
| 8 | ||||||
| 9 | ||||||
| 10 | ||||||
| 11 | ||||||
| 12 | ||||||
| 13 | ||||||
| 14 |
The evolution of the reflector parameters during the rise is shown in Figure 7. Irrespective of the continuum model used, the derived amount of reflection is always significantly less than unity, while the amount of relativistic smearing (while always significant although with large error bars) is never as large as that expected for a disk extending down to the last stable orbit in a Schwarzchild geometry.
If the single Comptonized component is the correct model for the hard spectrum in the low state then there is a sharp increase in ionization state, coupled with a decrease in the amount of reflection at the onset of the spectral state transition. In the two component Comptonization model then there are hints of the same effect, although it is less significant due to the larger error bars on the derived ionization state.
| Spectrum number | 777Solid angle subtended by reflector | 888Ionization parameter | Inner radius 999Measured in gravitational radii, | hardness ratio 101010Ratio of 8-20keV and 1-5keV data | 111111For one Compton component |
|---|---|---|---|---|---|
| 1 | |||||
| 2 | |||||
| 3 | |||||
| 4 | |||||
| 5 | |||||
| 6 | |||||
| 7 | |||||
| 8 | |||||
| 9 | |||||
| 10 | |||||
| 11 | |||||
| 12 | |||||
| 13 | |||||
| 14 |
5 Models of the low state during the outburst
As has been mentioned, there are two main theories for how the LS spectrum is formed. The first is that the accretion disk truncates, forming an inner, optically thin, X–ray hot accretion flow, while the second postulates magnetic flares above a disk. We review here the very different predictions of these models for how the X–ray emitting region evolves during the rise to outburst, but show that both can give the observed LS spectrum.
5.1 Truncated disk with an inner, X–ray hot flow
The geometry of a truncated disk and inner, X–ray hot flow can plainly explain the weak disk emission, hard (photon–starved) X–ray spectrum, and generally low amplitude of X–ray reflection seen in the LS (e.g. Poutanen, Krolik & Ryde 1997). Certainly in quiescence it seems very likely that the disk structure does not extend all the way down to the last stable orbit. Firstly, the observed X–ray luminosity, while low, still implies a mass accretion rate which is too high for the inner disk to remain below the instability threshold i.e. to be quiescent. A disk which truncates at larger radii can carry this mass accretion rate without triggering the instability (Lasota et al. 1996). Also, the inner regions of a quiescent disk structure are generally optically thin to both true absorption and electron scattering (see e.g. Cannizzo 1998). Such material cannot cool efficiently, so will heat up. Conduction between this and the remaining quiescent disk can lead to progressive evaporation of the inner regions of the quiescent disk into a hot flow (Meyer & Meyer–Hofmeister 1994; Meyer–Hofmeister & Meyer 1999). Conduction from a hot flow can lead to evaporation of even an SS disk, so this can be a mechanism to truncate the disk even at the much higher mass accretion rates generally seen for the LS emission (Róańska & Czerny 2000). The only known potentially stable solution of the accretion equations for an optically thin hot flow are the Advection Dominated Accretion Flows (ADAFs: Narayan & Yi 1995).
When the instability is triggered in the outer quiescent disk then this brings a large amount of mass in towards the black hole which increases the ADAF’s density, so increasing its luminosity. However, at a certain critical mass accretion rate, the density is such that electron–ion collisions become frequent, so the electrons gain most of the ion energy. The advected fraction becomes small and the ADAF collapses into a standard SS disk. This predicts that the LS will end at accretion rates of (Where , and ). This corresponds to luminosities of of Eddington for a viscosity of , as around a third of the energy is advected rather than radiated at these densities (Esin et al. 1997; Quataert & Narayan 1999). At these high viscosities the flows are also stable to convection (Narayan, Igumenshchev & Abramowicz 2000).
These models predict as the ADAF is centrally concentrated, so the solid angle subtended by the disk is fairly small (Esin et al. 1997). However, more detailed predictions are difficult as they critically depend on the geometry at the transition between the disk and ADAF. Current models generally assume a transition radius of Schwarzchild radii, and these give LS spectra which have (Esin et al. 1997) and very little relativistic smearing. Previous observations of 2–20 keV LS spectra show (Gierliński et al. 1997; ycki et al. 1997; 1998; Gilfanov et al. 1999), and smearing characteristic of an inner radius of 10–20 Schwarzchild radii (ycki et al. 1997; 1998; 1999; Done & ycki 1999). These are incompatible with a disk truncated at 1000 Schwarzchild radii. While both the solid angle and smearing can match the observations by simply decreasing the transition radius between the ADAF and the cold disk, this is not a completely free parameter. A small transition radius gives rise to a strong disk flux which Compton cools the ADAF, and can lead to its collapse (Esin 1997). A transition at 10 Schwarzchild radii decreases the maximum ADAF luminosity by a factor of , making it only just feasible to get the observed LS luminosity of of Eddington (Esin et al. 1997; Gierliński et al. 1999). However, these problems disappear entirely if the PCA/HEXTE cross–calibration spectra is reliable. Continuum curvature can give an overestimate of the amount of reflection present in single temperature/power law fits to low energy ( keV) spectra (compare Tables 1 and 2 for the LS spectra).
The inner radius of most of the disk material is almost certainly moving during the rise to outburst, If the edge of the ADAF follows the inner radius of the heating wave (i.e. the inner radius of the SS part of the disk), then the reflected fraction should be small and remain fairly constant. Alternatively, if the disk penetrates some way into the ADAF, is rather larger and can increase or remain constant as the heating wave moves inwards, depending on the details of the geometry. Both of these options are consistent with our derived model parameters, as our data do not cover much of the LS evolution.
While this gives continuity of properties between the quiescent and LS spectra, there should be an abrupt change when the ADAF finally collapses into whatever very different mechanism powers the LS/VHS emission. The viscous time-scale for a quasi–spherical flow to collapse is only longer than the dynamical time-scale at a given radius i.e. much less than a second for a flow of around a black hole. However, the collapse might be triggered locally by the disk underneath the hot flow, in which case it will be determined by the viscous time-scale for the SS disk, which is a few hours for the same parameters. This is still a much shorter than the observed day time-scale for the spectral transition (see Figure 1), although evaporation of the disk material into the hot flow may slow this considerably (Róańska & Czerny 2000).
5.2 Magnetic corona above an untruncated disk
In the second theory for the LS emission, some (large) fraction of the gravitational potential energy of the infalling material is released in an optically thin environment by magnetic reconnection above the dense disk material. In quiescence this can power the observed low level X–ray emission without triggering the instability as long as these are distributed over the whole disk (powered by the local at a given radius which is not constant) rather than requiring that the X–rays are produced solely by the central (Nayakshin & Svensson 2001). However, numerical simulations imply that the Balbus–Hawley dynamo mechanism for the magnetic field shuts off when the disk material becomes mainly neutral (so has large resistivity: Gammie & Menou 1998; Fleming, Stone & Hawley 2000). The quiescent disk is then unlikely to be able to power any magnetic reconnection, so the continuity of spectral properties from the LS to quiescence is hard to explain. Also, the inner quiescent disk is predicted to be optically thin to both absorption and scattering, so the caveats listed in the previous section still apply as to whether it can exist as a geometrically thin, cool disk.
Irrespective of whether this can produce the hard X–rays observed in quiescence, the X–ray emission from magnetic reconnection above the outbursting disk is likely to be dominant once the the instability is triggered since its local will be so much larger. The heating wave starts in the outer disk and moves inwards, carrying with it an ever increasing amount of matter. While the disk would remain quiescent in front of the wave, it would switch into a hotter SS state behind it (e.g. Cannizzo 1998). The X–rays during the rise are then associated with magnetic reconnection generated by the Balbus–Hawley mechanism above the outbursting disk. In this case we would expect to see a steadily decreasing radius (i.e. an increasing amount of relativistic smearing) and remaining constant at a value of unity.
LS spectra in general (both in Cyg X–1 and during the decline phase of the transient systems) show (irrespective of the continuum model used), which is incompatible with the magnetic flares model described above (Gierliński et al. 1997; ycki, Done & Smith 1997; 1998; Done & ycki 1999; Gilfanov et al. 1999; Zdziarski, Lubiński & Smith 1999). However, if the reconnection regions are out-flowing rather than static then the reflection signature can be suppressed by the resulting anisotropic emission (Beloborodov 1999). For a constant outflow velocity then this predicts that remains constant at some value , while the amount of relativistic smearing increases. Alternatively, the generally observed LS correlation between spectral index and can be explained by a variable outflow velocity. Faster outflow velocities mean that more of the X–ray radiation is beamed away from the disk so there is a smaller reflected fraction. This also means fewer soft photons from the disk are intercepted by the active region, so the spectra are harder (Beloborodov 1999). The observed softening as the outburst progresses then requires that the outflow speed decreases systematically through the rise (as shown in figure 8). Interestingly, this gives the observed correlation between jet strength and spectral state if the outflow is treated as the base of a radio jet (Fender 2000).
6 Models of the very high state during the outburst
The (admittedly few) broad band HS/VHS spectra show a rather complex spectrum. There is plainly a strong disk component at keV, and a high energy tail. The VHS spectrum shown in Figure 4 shows the tail extending out beyond 200 keV, while OSSE data from other objects show it out to even higher energies (Grove et al. 1998; Gierliński et al. 1999). The lack of distinct scattering orders strongly argues against thermal Comptonization models in the HS of Cyg X–1 (Gierliński et al. 1999), and the two proposed mechanisms in the literature involve a non–thermal electron distribution either from magnetic flares (Poutanen & Coppi 1998) or from bulk motion of the infalling material as it approaches the black hole event horizon (Chakrabarti & Titarchuk 1995). The major problem with the bulk motion model is that the free–fall electron velocities are not high enough (typical velocities of imply Lorentz factors of only ) to extend the power law past keV (Laurent & Titarchuk 1999, Zdziarski 2000) yet the highest signal–to–noise HS/VHS spectra extend unbroken beyond this (GRO J1655-40: Grove et al. 1998; Cyg X-1: Gierliński et al., 1999). Thus it seems that the power law must arise from highly relativistic non–thermal electron distribution.
As well as the non–thermal power law, there is an additional continuum component which is clearly seen in the few broad band VHS/HS spectra (Figure 4, Figure 5 and Cyg X–1: Gierliński et al. 1999; Frontera et al. 2000). This can be described as a thermal Comptonized continuum, but at lower temperature than the standard LS emission. It seems entirely possible that the difference between the VHS and HS spectra is merely in the strength of this additional thermal component. This thermal/non–thermal (or hybrid) plasma most likely represents incomplete thermalization of the magnetic reconnection energy, so that the thermal and non–thermal electron distributions are co–spatial rather than there being two separate electron populations (Poutanen & Coppi 1998; Coppi 1999).
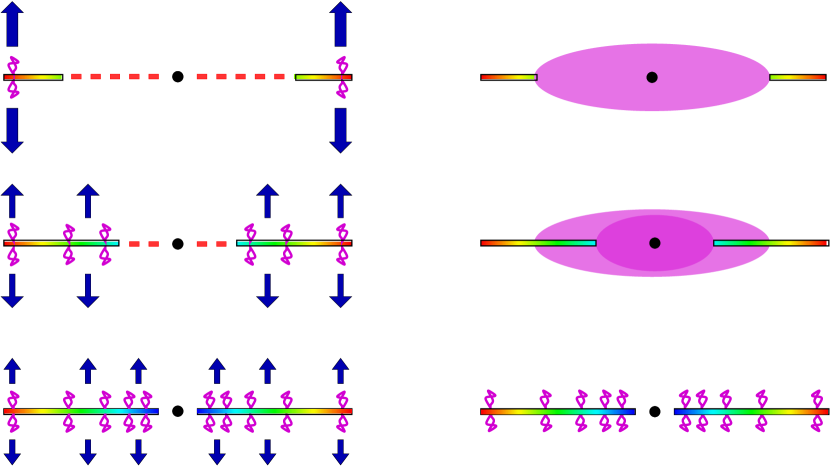
Since there is very little radio emission in the HS (Fender 2000) then the emission regions are probably not linked to a relativistic outflow. Thus the HS (and by extension the VHS) are most likely to be linked with rather low velocity outflows, or static regions above the disk, as shown schematically in Figure 8, so should give rise to in the reflector, and to an inner radius equal to the last stable orbit.
7 Discussion
The parameters which we actually derive are shown in figure 7. The reflected fraction, , either remains essentially constant around a value of , or drops from to at the onset of the LS–VHS transition (depending on the continuum model used). The inner radius remains fairly constant: the errors on the data are large enough to cover most trends although we note that the results are never consistent with a disk extending down to the last stable orbit, nor with a disk truncated at 1000 Schwarzchild radii.
The LS spectrum is roughly consistent with the presence of either an ADAF or of out-flowing magnetic flares above the (outbursting) disk. The data can even be compatible with static magnetic flares, as there is an ionization instability which is present in X–ray illuminated material in hydrostatic balance. Intense X–ray irradiation of the disk can produce a sharp transition in the vertical structure of the disk, with a highly ionized skin forming on top of mainly neutral material. In the LS, the hard spectrum has a Compton temperature which is high enough to completely strip iron. The skin is then almost completely reflective, and forms no spectral features. The observed reflected signature is then dominated by photons reflected from deeper in the disk, where the material is much less ionised (Nayakshin, Kazanas & Kallman 2000). If the skin has an optical depth of around unity then this appreciably reduces the reflection signature to (Nayakshin 2000, Done & Nayakshin 2001).
For the ADAF, the presence of a skin on the top of the disk could give rise to an overestimation of the amount of relativistic smearing. The observed, mainly neutral, reflected spectrum is subject to Compton scattering in the skin before it escapes. This can lead to some broadening of the spectral features (line and edge) in addition to the relativistic broadening of the features (see also Ross, Fabian & Young 1999). Thus the theoretical difficulties in maintaining an ADAF with a small transition radius could be removed if the transition radius is overestimated because of Compton smearing. With magnetic flares, the ionized skin gives the observed and correlation with spectral index, without requiring a moderately relativistic outflow from the disk (although such outflow may be additionally present!).
The detailed properties of the VHS reflected spectra are not at all consistent with the magnetic flares model developed earlier. The amount of reflection is very much less than unity predicted by such flares at low outflow velocity. However, the ionization is also high, indicating that we are not dealing with a mainly neutral disk. Unlike the LS spectrum, photo–ionization of the disk surface cannot easily suppress the amount of observed reflection. The Compton temperature is low, so the ionization state of the X–ray illuminated skin is not high enough to completely strip iron, and the derived solid angle is generally not strongly underestimated (Nayakshin, Kazanas & Kallman 2000; Done & Nayakshin 2001). However, there can also be substantial collisional ionization as the observed disk temperature is keV, provided that the disk is in local thermal equilibrium (a likely assumption). We used reflection models which assume that the whole disk can be described by a single photo–ionization parameter, but plainly the hotter the disk, the more highly ionized it will be simply due to collisional processes. From the Saha equation the mean ionization state of iron will be one in which the ionization energy is roughly equivalent to the temperature i.e. we expect that iron should be dominated by He– and H–like ions in the central regions where the X–rays are predominantly produced. However, the electrons are very nondegenerate, and a better estimate of the ionization state is one with ionization energy i.e. the inner regions of the disk will contain iron that has been completely stripped through collisional ionization processes (Rybicki & Lightman 1979). Thus reflection from the inner disk is completely ionized, and has no spectral features. It is, therefore, counted as continuum rather than reflected flux in spectral fitting. Observable reflection is only detected from further out in the disk, where relativistic smearing effects are smaller, although Compton up-scattering can again be an important broadening mechanism (Ross, Fabian & Young 1999) which is not accounted for in our reflection code.
The importance of Compton up-scattering on our spectra can be demonstrated by the residuals to the VHS spectra. The co–added residuals to all the spectra after the sudden parameter transition are shown in figure 9. There is clearly a systematic problem with the modelling of the reflected features at a level of . A similar pattern of residuals is seen when models of ionized disks which include Compton up-scattering of the reflected spectrum are fit with the simpler reflection models used here (S. Nayakshin, private communication).
Complete collisional ionization of the inner disk in the VHS can then lead to an underestimate of the solid angle subtended by the reflector, and to an overestimate of the inner disk radius, although this latter effect can be partially compensated for by the Compton up-scattering associated with the ionized disk reflection. Thus our derived and inner radius Schwarzchild radii may be consistent with a disk which subtends a solid angle of and extends down to the last stable orbit when collisional ionization effects are properly included.
This leaves us in the unfortunate situation of knowing even less than we did before. Ionization removes the last of our ability to test models for the origin of the X–ray spectra using currently available spectral models for fitting the X–ray reflected spectrum. However, we note one inconsistency which we suspect will remain even within properly calculated ionization models. The continuing increase in frequency of the QPO indicates that the switch to the VHS occurs before the heating wave has propagated all the way down to the last stable orbit. If so then we expect that the magnetic corona will continue to increase in luminosity as the disk radius decreases, but without a corresponding reflected signature. This would imply that the hard X–ray flux should increase, without a corresponding increase in reflection, so the measured reflected fraction should decrease (while the ionization state and relativistic smearing remain constant). However, we see the solid angle remain constant from the onset of the VHS transition. Plainly there is much that is still not understood about the nature of the VHS emission.

8 Conclusions
We have intensively studied the spectra of the rise phase of the outburst of RXTE J1550–564. At the onset of the XTE coverage, the source is in a classic LS, and can be fit with a spectrum consisting of seed photons from an accretion disk (not detected in the RXTE bandpass) being thermally Comptonized into a hard X–ray spectrum which is then reflected from the disk. There is subtle curvature in the spectrum, perhaps indicating that a single temperature Comptonization model is inadequate, although it may also be an artifact of remaining residuals in the PCA/HEXTE cross–calibration. The source then makes a very smooth transition to the VHS (without going through the classic HS), where the spectrum is dominated by disk emission which is strongly Comptonized. The high energy spectral curvature during the transition is inconsistent with a single temperature Comptonization model. This effect is much larger in the later spectra and so is unlikely to be due to calibration issues. The transition and VHS spectra can be modeled by two thermal Compton components (one at low electron temperature, the other considerably higher). This could be indicative of a hybrid thermal–nonthermal plasma such as has been fit to Cyg X–1 HS spectra (Gierliński et al. 1999).
We are most interested in the reflected spectrum rather than the continuum, as this can be used to give an indication of the source geometry and whether this changes dramatically at the LS/VHS transition as required by ADAF models. We have derived values for the reflected fraction, the ionization parameter and the inner disk radius for each spectrum.
A sharp transition is seen in the ionization at the onset of the LS–VHS transition. The reflected fraction remains essentially constant at a value of while the ionization increases from mainly neutral to highly ionized (iron in He and H–like ionization states). The inner radius inferred from relativistic smearing of the reflected spectral features could not be well constrained, but is never as small as the last stable orbit around a black hole.
Given theoretical uncertainties in the transition radius and extent of overlap between the ADAF and disk, then the LS reflected spectrum is consistent with an ADAF interpretation, especially if photo–ionization of the disk gives rise to an ionized skin which introduces significant Compton broadening as well as relativistic smearing. Similarly, a photo–ionized skin can make magnetic reconnection models of the X–ray flux fit the data, even without significant outflow velocities of the hard X–ray region, although these can be additionally present. However, the fact that the LS is seen when the increasing QPO frequency and disk instability models clearly indicate that the outbursting disk has not yet reached the last stable orbit shows that an inner SS disk is not a necessary condition on the LS X–ray emission.
Ionization can again distort the reflected spectrum derived in the VHS, only this time it is collisional rather than photo ionization which is likely to be important (Given a disk which is in LTE). Again this can suppress the observed amount of reflection, and distort (generally suppress) the most highly relativistically broadened features from the inner disk.
9 Acknowledgements
We thank Piotr ycki for the use of his Comptonization and reflection codes and Sergei Nayakshin for illuminating discussions. We also thank our referee, Andrzej Zdziarski, for his helpful comments. CDW acknowledges support from a PPARC studentship. This research has made use of data obtained through the High Energy Astrophysics Science Archive, provided by the NASA Goddard Space Flight Center.
References
- [] Arnaud K. A., 1996, in: Jacoby G. H., Barnes J., eds., Astronomical Data Analysis Software and Systems V, ASP Conf. Series Vol. 101, San Francisco, p. 17
- [] Atoyan A.M., Aharonian F.A., 1996, MNRAS, 278, 525
- [] Balbus S.A., Hawley J.F., 1991, ApJ., 376, 214
- [] Beloborodov A.M. 1999, ApJ, 510, L123
- [] Cannizzo J.K., 1998, ApJ, 494, 366
- [] Chakrabarti S., Titarchuk L.G., 1995, ApJ, 455, 623
- [] Coppi P.S., 1999, High Energy Processes in Accreting Black Holes, ASP Conference Series 161, 375, ed. Juri Poutanen & Roland Svensson.
- [] Cui W., Zhang S.N., Chen W., Morgan E.H., 1999, ApJ, 512, 43
- [] di Matteo T., Psaltis D., 1999, ApJL, 526, 101
- [] Done C., Nayakshin S., 2001, ApJ, 546, 419
- [] Done C., ycki P.T., 1999, MNRAS, 305, 457
- [] Esin A.A., 1997, ApJ, 482, 400
- [] Esin A.A., McClintock J.E., Narayan R. 1997, ApJ, 489, 865
- [] Fabian A.C., Rees M.J., Stella L., & White, N.E. 1989, MNRAS, 238, 729
- [] Fender R., 2000, In ’Black Holes in Binaries and Galactic Nuclei’, Eds L. Kaper, E.P.J. van den Heuvel and P.A. Woudt, Springer-Verlag.
- [] Fleming T.P., Stone J.M., Hawley J.F., 2000, ApJ., 530, 464
- [] Frontera F. et al., 2000, ApJ, 546, 1027
- [] Gammie C.F., Menou K., 1998, ApJL, 492, 75
- [] George I.M. & Fabian A.C., 1991, MNRAS, 249, 352
- [] Gierliński M., Zdziarski A. A., Done C., Johnson W. N., Ebisawa K., Ueda Y., Phlips F., Haardt F., 1997, MNRAS, 288, 958
- [] Gierliński M., Zdziarski A.A., Poutanen J., Coppi P.S., Ebisawa K., Johnson W.N., 1999, MNRAS, 309, 496
- [] Gilfanov M., Churazov E., Revnivtsev M., 1999, A& A, 352, 182
- [] Grove J.E. et al., 1998, ApJ, 500, 899
- [] King A.R., Ritter H., 1998, MNRAS, 293, L42
- [] Kong A.K.H., Kuulkers E., Charles P.A., Homer L., 2000, MNRAS, 312
- [] Lasota J.P., Abramowicz M.A., Chen X., Krolik J., Narayan R., Yi I., 1996, ApJ, 462, 142
- [] Laurant P., Titarchuk L.G., 1999, ApJ, 511, 289
- [] Lightman A.P., White T.R., 1988, ApJ, 335, 57
- [] Magdziarz P. Zdziarski A.A., 1995, MNRAS, 273, 837
- [] Massaro E., Cusumano G., Litterio M., Mineo T., 2000, A& A, 361, 695
- [] Matt G., Perola G.C., & Piro L. 1991, A&A, 247, 25
- [] Merloni A., Fabian A.C., Ross R.R., 2000, MNRAS, 313, 193
- [] Meyer F., Meyer-Hofmeister E., 1994, A& A, 288, 175
- [] Meyer-Hofmeister E., Meyer F., 1999, A& A, 348, 154
- [] Morrison R., McCammon D., 1983, ApJ., 270, 119
- [] Narayan R., Igumenshchev I.V., Abramowicz M.A., 2000, ApJ, 539, 798
- [] Narayan R., Yi I., 1995, ApJ., 444, 231
- [] Nayakshin S., 2000, ApJ, 534, 718
- [] Nayakshin S., Kazanas D., Kallman T.R., 2000, ApJ, 537, 833
- [] Nayakshin S., Svensson R., 2001, ApJ, 551, L67
- [] Nowak M.A., 1995, PASP, 107, 1207
- [] Osaki Y., 1996, PASP, 108, 39
- [] Poutanen J., Coppi P.S., 1998, Phys.Scripta T77 57-59
- [] Poutanen J., Krolik J. H., & Ryde F., 1997, MNRAS, 292, 21
- [] Poutanen J., Svensson R., 1996, ApJ, 470, 259
- [] Pozdnyakov L.A., Sobol I.M., Sunyaev R.A., 1983, in Sunyaev R., ed, Astrohphys. & Space Phys. Rev., Harwood Academic Publishers, Chur, Vol. 2, p. 189
- [] Pravdo S.H. Angelini L., Harding A.K., 1997, ApJ, 491, 808
- [] Psaltis D., Norman C., 2001, ApJ, In press
- [] Quataert E., Narayan R., 1999, ApJ, 520, 298
- [] Remillard R. A., McClintock J. E., Sobczak G. J., Bailyn, C. D., Orosz J. A., Morgan E. H., Levine A. M., 1999, ApJL, 517, 127
- [] Ross R.R., Fabian A.C., 1993, MNRAS, 261, 74
- [] Ross R.R., Fabian A.C., Young A.J., 1999, MNRAS, 306, 461
- [] Róańska A., Czerny B., 2000, A& A, 360, 1170
- [] Rybicki G.B., Lightman A.P., 1979, Radiative processes in astrophysics, Publisher: Wiley-Interscience.
- [] Sanchez-Fernandez C., Castro-Tirado A.J., Duerbeck H.W., Mantegazza L., Beckmann V., Burwitz, V., Vanzi L., Bianchini A., della Valle M., Piemonte A., Dirsch B., Hook I., Yan L., Giminez A. 1999, A& A, 348, L9
- [] Shakura, N.I., Sunyaev, R.A. 1973, A& A, 24, 337
- [] Shapiro S.L., Lightman A.P., Eardley D.M. 1976, ApJ, 204, 187
- [] Sobczak G.J., McClintock J.E., Remillard R.A., Levine A.M., Morgan C.D., Orosz J.A., 1999, ApJ, 517, L121
- [] Stern B.E., Poutanen J., Svensson R., Sikora M., Begelman M.C., 1995, ApJL, 449, 13
- [] Svensson R., Zdziarski A.A., 1994, ApJ, 436, 599
- [] Tanaka Y., Lewin W. H. G. 1995, in X–Ray Binaries, ed. W. H. G. Lewin, J. van Paradijs & E. van den Heuvel (Cambridge: Cambridge Univ. Press), p. 126
- [] van der Klis M., 1995, Lecture notes in Physics, 454, 321
- [] Zdziarski A.A., Lubiński P., Smith D.A., 1999, MNRAS, 303, 11
- [] Zdziarski A.A., Johnson W.N., Magziarz P., 1999, MNRAS, 283, 193
- [] Zdziarski A.A., 2000, in Martens P.C.H., Tsuruta S., Wever M.A., eds, Highly Energetic Physical Processes and Mechanisms for Emission from Astrophysical Plasmas, Astron. Soc. Pac., p. 153
- [] ycki P.T., Done C., Smith D.A., 1997, ApJL, 488, 113
- [] ycki P.T., Done C., Smith D.A., 1998, ApJL, 496,25
- [] ycki P.T., Done C., Smith D.A., 1999, MNRAS, 305, 231
- [] ycki P.T., Czerny, B. 1994, MNRAS, 266, 653