A new deuterium abundance measurement from a damped Ly system at ††thanks: Based on public data released from UVES Commissioning at the VLT/Kueyen telescope, ESO, Paranal, Chile.
Abstract
We present the first D/H measurement in a damped Ly (hereafter DLA) system at towards QSO 0347–3819 obtained from the UVES-VLT spectra. The DLA absorber has a metallicity of [Zn/H] and a relatively simple velocity structure, with two dominating components detected in several metal lines. The hydrogen Lyman series can be followed down to Ly12 thanks to the high UV-Blue efficiency of UVES. The best fit of the Lyman series lines, and in particular of Ly, Ly8, Ly10 and Ly12, relatively free of local contamination, is obtained when the D i absorption is included in the two main components. The measured deuterium column density yields close to other low D/H values from Lyman limit systems. The corresponding values for the baryon to photon ratio and the baryon density derived from D/H are and respectively.
Key Words.:
Cosmology: observations – Quasars: QSO 0347–3819 – Nuclear reactions, nucleosynthesis, abundances1 Introduction
Deuterium (D or 2H) is the only element entirely produced by nuclear reactions in the first minutes after Big Bang (Wagoner et al. 1967). The D yields are the most sensitive to the nuclear density at the nucleosynthesis epoch among the primordial light elements 3He, 4He and 7Li, thus making the D abundance the most sensitive measurement of the baryon density in the universe (Wagoner 1973, Schramm & Turner 1998).
Deuterium is currently measured in the local interstellar medium (ISM), (D/H) (Linsky et al. 1993), but since whenever it is cycled through stars it is completely burned away, extrapolation to the primordial D/H value requires a modeling of the Galactic chemical evolution. Direct D measurements of primordial material are thus of high interest. Adams (1976) suggested that almost primordial D could be measured in low metallicity absorption line systems in the spectra of distant quasars (QSOs). This was recently achieved for a few systems, but with conflicting results differing by almost an order of magnitude.
A few systems provide high D/H values (see e.g. Webb et al. (1997) who measure ), while two other systems give a low abundance at (Burles & Tytler 1998a,1998b). An even lower D/H estimation was obtained by Molaro et al. (1999), further discussed by Levshakov et al. (2000). Kirkman et al. (2000) measured an upper limit of . The handful of D detections found so far does not allow a firm conclusion. Different arguments favour a low primordial D/H ratio: the possible H i contamination of the D i absorption lines and, on the modeling side, the results by Tosi et al. (1998) which predict for a variety of chemical evolution scenarios and to be consistent with the Galactic data a maximum decrease of the primordial D abundance by a factor of 3.
The paucity of suitable absorption systems for accurate D/H measurements is due to the fact that only absorption line systems with simple velocity structures and with intermediate H i column densities allow the detection of the D i lines. At too low column densities the D i lines are too weak for detection, whereas at high column densities the lines are normally washed out by the saturation of the H i line. We show here for the first time that in the latter case the deuterium signature can be successfully detected through the higher members of the Lyman series, when the target is a damped Ly system ((H i) ) at high redshift. This approach was first suggested by Khersonsky et al. (1995).
2 Data
The spectra of QSO 0347–3819 (V=17.3, ) were obtained during the Commissioning of the Ultraviolet-Visual Echelle Spectrograph (UVES) on the VLT 8.2m Kueyen telescope at Paranal, in 1999. The instrument is described in D’Odorico et al. (2000). Two exposures of 4500 s each, covering the spectral range from 3650 to 4900 Å and from 6700 to 10000 Å were obtained with a resolution of km s-1 and km s-1 respectively. The individual spectra were reduced using the UVES data reduction pipeline implemented in the ESO MIDAS package. The final spectrum reaches a S/N varying from 20 to 35.
QSO 0347–3819 shows a damped Ly system at which has been studied in detail by Centurion et al. (1998), Ledoux et al. (1998) and from HIRES-Keck observations by Prochaska & Wolfe (1999). The UVES observations however provide the first high-quality data in the UV ( Å) and in the near-IR ( Å). They allow the abundance measurements of new features such as O, P, Ar and Zn, in addition to the N, S, Si and Fe abundances measured in the previous studies. Full abundance analysis of the DLA system at will be presented in a future paper. Here we focus on the deuterium detection and the D/H ratio measurement.
| Comp | Ident | |||
|---|---|---|---|---|
| [cm-2] | [km s-1] | |||
| 2… | 3.024637 | H i | 20.13 0.08 | 21.5 0.4 |
| D i | 15.48 0.08 | 14.1 0.5 | ||
| 3… | 3.024856 | H i | 20.43 0.10 | 23.0 2.0 |
| D i | 15.78 0.11 | 16.2 3.0 | ||
| 7… | 3.025659 | H i | 19.35 0.05 | 14.7 0.4 |
3 Analysis and results
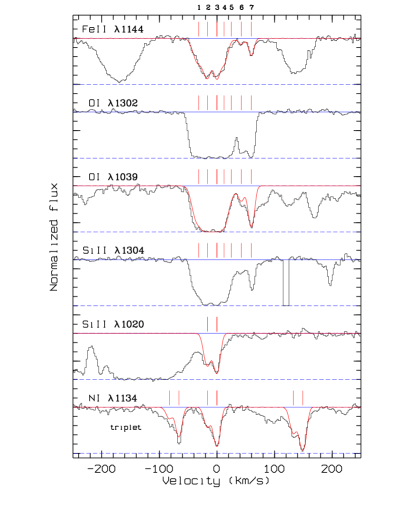
The absorption profiles of the DLA system at are characterized by two dominating components (2 and 3) separated by about 20 km s-1 with the red one slightly stronger than the blue as it can be seen from the non-saturated metal lines in Fig. 1. The strong and saturated metal lines reveal that additional material in smaller amount is present redwards the two main features (components 4, 5, 6 and 7). The region on the blue side of the main absorption components is sharp and relatively free from material with only one weak component (component 1) at about km s-1. In total seven components are needed to fit the metal lines absorption profiles, with two main components containing about 80% of the total column density per transition.
The DLA system at is a very good candidate for the deuterium analysis since it shows a relatively simple velocity structure dominated by two strong components, a low metallicity of [Zn/H]111[X/H] = (X/H) (X/H)☉ , indicating that the measured D/H will be representative of primordial D/H and the hydrogen Lyman series lines can be followed down to Ly12.
We used a minimization routine fitlyman (Fontana & Ballester 1995) in MIDAS to fit Voigt profiles to the observed absorption profiles, and obtain for each fitted absorption component the wavelength, the column density , the Doppler parameter and the corresponding errors.
In the case of high hydrogen column densities like in DLA systems, we expect the neutral and low ionization metal lines to trace the H, therefore we model the Lyman series (Ly to Ly12) absorption profiles with three features corresponding to the two main components (2 and 3) and the reddest component (7) as determined from the metal lines (Fig. 1). The contribution of the weaker component 7 is required only to better constrain the fit on the red edge of the Lyman lines. The relative intensities of these three major hydrogen components were scaled with the metal lines assuming they have approximatively the same abundance ratios from component to component.
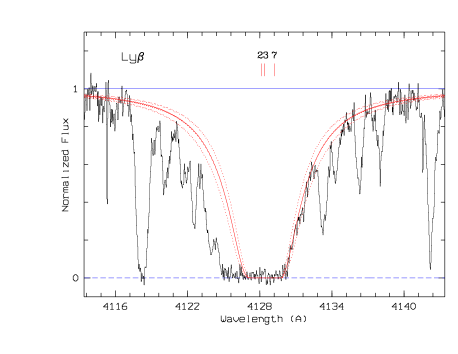
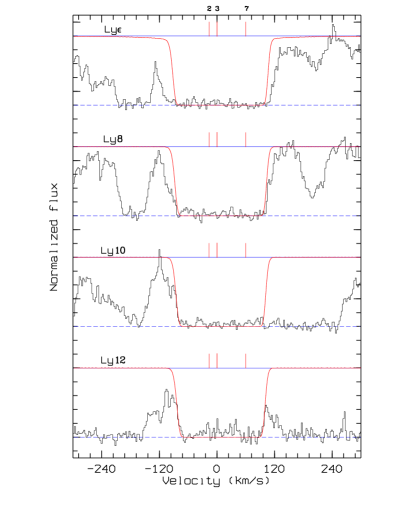
Starting from this basis we obtained the final H i column densities and -values (free parameters) by fitting simultaneously the lines of the Lyman series and by assuming the same redshift for the three H components as for the metal lines. The Ly absorption profile provides a very good constraint to the total H i column density and the Ly8, Ly9, Ly10 and Ly12 profiles (which are the ones free from strong contamination) to the -values. From the best fit (Fig. 2, Fig. 3, Table 1) we derived a total H i column density of (H i) in close agreement with the Pettini et al. (1994) value of .
Adding other components to the hydrogen fit with low column densities as the ones observed in the stronger metal lines, component 1 at km s-1 and components 4, 5 and 6 at slightly higher redshifts than the two main components, does not change significantly neither the total H i column density of the two main components nor the fit on the blue and red wings of the Lyman lines. Fig. 3 however clearly shows that the fit with three hydrogen components systematically fails to reproduce the edge of the blue wing in the higher members of the hydrogen Lyman series, Ly, Ly8, Ly10 and Ly12, at about km s-1 from the two H main components (2 and 3) which is the expected displacement of the corresponding D lines.
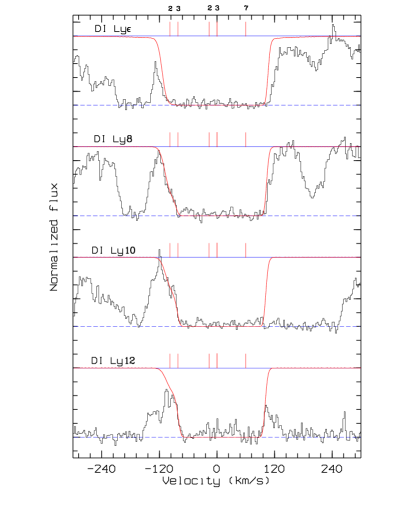
We then add to the model the deuterium by assuming its contribution only to the two main components (2 and 3). In the fitting procedure we assumed the same redshift for the two fitted components as for H and we left the column densities and the broadening parameters as free parameters.
The best fit performed over D i Ly8 and Ly10 improves the of the hydrogen fit by a factor of 3. It reproduces nicely the blue wing of the Ly8, Ly10 and Ly12 absorption profiles and is consistent with Ly (see Fig. 4). It gives a deuterium abundance of
The error follows from the H and D fits and it includes the uncertainties in placing the continuum level and the errors on the -values. The D i column densities and the -values of the two fitted components are given in Table 1.
To check the stability of our result when the assumption that H and D mimic the metal structure is relaxed, we made a fit of the Ly, Ly, Ly8, Ly10 and Ly12 lines with three H and D components by keeping both their redshifts and column densities as free parameters. We obtained a satisfactory fit with shifts of the components with respect to the values given in Table 1 of less than 4 km s-1. The derived D/H ratio was comprised within our D/H error range. A fit with only one strong H component and the corresponding D component gave also a D/H ratio within our D/H error range.
4 Discussion
Three arguments support the interpretation of the absorption feature detected on the blue wing of some of the higher members of the H i Lyman series, Ly, Ly8, Ly10 and Ly12, as the D i absorption with the same two main components as detected in the metal lines of the DLA system.
First, the absorption in the blue wing of the Lyman series lines could also be explained by a hydrogen interloper associated with the damped Ly system with a column density between and , a -value between 15 and 25 km s-1 and placed between and km s-1. However, from the density distribution of the Ly clouds in the forest at (see e.g. Kim et al. 2000), the probability to have such a cloud at that position is smaller than 1/1000. The lack of any metal component at this velocity in the strong and saturated lines of the DLA system (see Fig. 1) provides an additional evidence for discarding this possibility.
Secondly, the contamination on the blue wing of the Lyman series lines by different H i interlopers at different redshifts which would mimic the same deuterium abundance as derived from the D i Ly, Ly8, Ly10 and Ly12 lines is even more unlikely.
Finally, the D and H column densities and broadening parameters resulting from the fits are consistent one relatively to other in the two fitted components (2 and 3): the derived D/H ratios are the same and the (D i)/(H i) ratios are close to what is expected in the thermally dominated case.
This measurement of D is the first made in a DLA system. It shows that the DLA systems with their low metallicity ISM are a very promising class of absorbers for measurements of the D/H ratios at high redshifts, when it is possible to measure the higher members of the Lyman series. A systematic program of measurements using UVES data is under way.
The derived D/H ratio of is close to the low values obtained by Burles & Tytler in Lyman limit systems (1998a,1998b) and it makes the claim of the primordial low D/H ratio more robust. Taken at face this ratio gives a baryon to photon ratio, , of (Burles et al. 2000). This implies a helium abundance (in mass) of Yp = 0.2480 and a lithium abundance of which are both larger than presently allowed by observations of He in extragalactic H ii regions and of Li in halo stars (Izotov & Thuan 1998, Bonifacio & Molaro 1997). On the other hand an of corresponds to a present-day baryon density of 222 km s-1 Mpc-1 which remains significantly lower than the derived from CMB anisotropy (Jaffe et al. 2000).
Acknowledgements.
We are indebted to the UVES project team for the high quality of the spectra obtained early in the operation of the instrument. We like to thank J.X. Prochaska for making available the profiles of the stronger metal lines and for comments on an earlier version of the manuscript.References
- (1) Adams T.F., 1976, A&A, 50, 461
- (2) Bonifacio P., Molaro P., 1997, MNRAS, 285, 847
- (3) Burles S., Tytler D., 1998a, ApJ, 499, 699
- (4) Burles S., Tytler D., 1998b, ApJ, 507, 732
- (5) Burles S., Nollett K.M., Turner M.S., 2000, astro-ph/0010171
- (6) Centurion M., Bonifacio P., Molaro P., Vladilo G., 1998, ApJ, 509, 620
- (7) D’Odorico S., Cristiani S., Dekker H., et al., 2000, SPIE, 4005, 121
- (8) Fontana A., Ballester P., 1995, Messenger, 80, 37
- (9) Izotov Y.I., Thuan T.X., 1998, ApJ, 500, 188
- (10) Jaffe A. H., et al., 2000, astro-ph/0007333
- (11) Khersonsky V.K., Briggs F.H., Turnshek D.A, 1995, PASP, 107, 570
- (12) Kim T.-S., Cristiani S., D’Odorico S., 2000, A&A, submitted
- (13) Kirkman D., Tytler D., Burles S., Lubin D., O’Meara J.M., 2000, ApJ, 529, 655
- (14) Ledoux C., Petitjean P., Bergeron J., Wampler E.J., Srianand R., 1998, A&A, 337, 51
- (15) Levshakov S.A., Agafonova I.I., Kegel W.H., 2000, A&A, 355, L1
- (16) Linsky J.L., et al., 1993, ApJ, 402, 694
- (17) Molaro P., Bonifacio P., Centurion M., Vladilo G., 1999, A&A, 349, L13
- (18) Pettini M., Smith L.J., Hunstead R.W., King D.L., 1994, ApJ, 426, 79
- (19) Prochaska J.X., Wolfe A.M., 1999, ApJS, 121, 369
- (20) Schramm D.N., Turner M.S., 1998, Rev. Modern Phys., 70, 303
- (21) Tosi M., Steigman G., Matteucci F., Chiappini C., 1998, ApJ, 498, 226
- (22) Wagoner R.V., 1973, AJ, 179, 343
- (23) Wagoner R.A., Fowler A., Hoyle F., 1967, ApJ, 148, 3
- (24) Webb J.K., Carswell R.F., Lanzetta K.M., Ferlet R., Lemoine M., Vidal-Madjar A., Bowen D.V., 1997, Nat, 388, 250