The optical afterglow and host galaxy of GRB 000926 ††thanks: Based on observations made with the Nordic Optical Telescope, operated on the island of La Palma jointly by Denmark, Finland, Iceland, Norway, and Sweden.,††thanks: Based on observations made at the 2.2-m telescope of the German-Spanish Calar Alto Observatory ,††thanks: Based on observations made with the Isaac Newton Telescope operated on the island of La Palma by the Isaac Newton Group in the Spanish Observatorio del Roque de los Muchachos of the Instituto de Astrofisica de Canarias.
We present the discovery of the Optical Transient (OT) of the long–duration gamma-ray burst GRB 000926. The optical transient was detected independently with the Nordic Optical Telescope and at Calar Alto 22.2 hours after the burst. At this time the magnitude of the transient was R = 19.36. The transient faded with a decay slope of about during the first two days after which the slope increased abruptly (within a few hours) to about . The light-curve started to flatten off after about a week indicating the presence of an underlying extended object. This object was detected in a deep image obtained one month after the GRB at R=23.870.15 and consists of several compact knots within about 5 arcsec. One of the knots is spatially coincident with the position of the OT and hence most likely belongs to the host galaxy. Higher resolution imaging is needed to resolve whether all the compact knots belong to the host galaxy or to several independent objects. In a separate paper we present a discussion of the optical spectrum of the OT, and its inferred redshift (Møller et al. in prep.).
Key Words.:
cosmology: observations – gamma rays: bursts1 Introduction
The discoveries of the first -ray afterglow (Costa et al. 1997) and OT (van Paradijs et al. 1997) of a gamma-ray burst (GRB) have led to a major breakthrough in GRB research. The determination of a redshift of 0.835 for GRB~970508 (Metzger et al. 1997), and the subsequent determination of redshifts of more than a dozen bursts with a median redshift of 1.1, have firmly established their cosmological origin (e.g. Kulkarni et al. 2000; Castro-Tirado 2001 and references therein). One of the current goals is to use the OT properties (brightness, position within the host galaxy, light-curve shape) as diagnostic tools to study the environment of GRBs and to possibly shed some light on the nature of GRB progenitors (e.g. Bloom et al. 2000).
Another very appealing aspect of GRB research is the use of GRBs as cosmological probes. GRBs have been suggested as probes of the very high redshift universe (Lamb and Reichart 2000; Andersen et al. 2000). An equally interesting use of GRBs is as an independent way by which to select galaxies at cosmological distances. In some widely accepted scenarios GRBs are related to deaths of very massive, short-lived stars and furthermore gamma-rays are not obscured by dust. Hence a sample of GRB host galaxies may be considered star-formation-selected independent of the amount of extinction of the rest-frame UV and optical emission. However, we do not know if GRBs (as a class) evolve with redshift and furthermore GRBs are of course gamma-ray flux selected. It is nevertheless interesting to compare GRB-selected galaxies with other samples of galaxies selected e.g. by rest-frame UV flux (Steidel et al. 1996), Damped Ly- Absorption (DLAs, e.g. Wolfe et al. 1995; Djorgovski et al. 1996; Møller and Warren 1993, 1998; Ellison et al. 2001), Ly- emission (Hu et al. 1998; Fynbo et al. 2000a; Kudritzki et al. 2000; Steidel et al. 2000) or sub-mm emission (e.g. Ivison et al. 2000). There is currently some controversy as to whether most of the star-formation at high redshift takes place in the UV-selected or in the sub-mm selected objects (e.g. Smail et al. 1997; Hughes et al. 1998; Peacock et al. 2000; Adelberger and Steidel 2000; van der Werf et al. 2000). DLAs trace a very abundant population of (proto)galaxies at high redshift that could also contribute significantly to the star-formation density (Fynbo et al. 1999, 2000a). A well understood sample of GRB host galaxies may resolve where most of the stars are formed as a function of redshift.
In this paper we present the detection of the OT and host galaxy of GRB 000926 and the results of multi-colour optical and near infrared (IR) photometry. We then compare the properties of GRB 000926 and its host galaxy with those of GRB 000301C, which occurred at nearly the same redshift, with emphasis on the (very different) properties of their host galaxies.
Throughout this paper, we adopt a Hubble constant of H0=65 km s-1 Mpc-1 and assume and .
2 Observations
GRB 000926 was detected by three instruments in the Interplanetary Network (IPN: Ulysses, Konus-WIND, and NEAR), and localized to a 35 arcmin2 error box which was circulated via the GRB Coordinates Network (GCN)111 http://gcn.gsfc.nasa.gov/gcn/ 20.3 hours after the burst (Hurley 2000). The Earth-crossing time for the burst was September 26.9927 UT. As observed by Ulysses, it had a duration of approximately 25 seconds (placing it in the ”long duration” burst category), a revised 25-100 keV fluence of 6.210-6 erg cm-2, and a revised peak flux over 0.25 s of 8.610-7 erg cm-2 s.
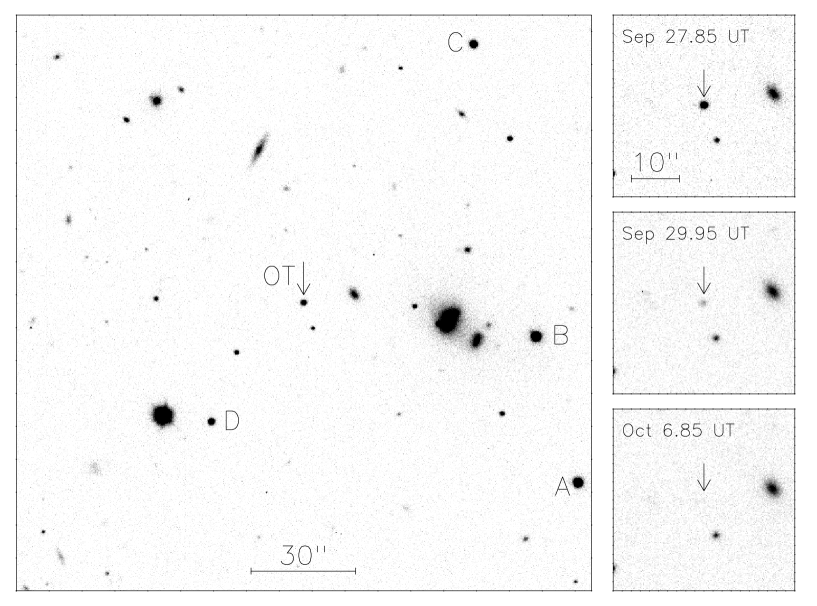
The error-box of GRB~000926 (Hurley 2000) was observed in the R–band with the 2.56-m Nordic Optical Telescope (NOT) and the Calar Alto (CA) 2.2-m telescope on 2000 September 27.85 UT (20.64 hours after the burst). Comparing with red Palomar Optical Sky Survey II exposures an OT was found in the error box (Gorosabel et al. 2000; Dall et al. 2000). Spectra were obtained at the NOT on both September 27 and September 28; these spectra revealed a strong metal absorption system at a redshift of z, which in all likelihood is due to gas in the GRB host galaxy (Møller et al. in prep). The OT was observed during the following weeks at the NOT, CA and also with the Isaac Newton Telescope (INT), the 1.0 m telescope at the US Naval Observatory at Flagstaff Station (USNOFS), and in the IR with the 8.2-m Subaru telescope and the 3.8-m United Kingdom Infrared Telescope (UKIRT). The logs of optical and IR observations are given in Table LABEL:obslog and Table LABEL:IRlog. A finding-chart and R–band images of the OT at three different epochs are shown in Fig. 1.
| star/filter | U | B | V | R | I |
|---|---|---|---|---|---|
| A | 17.9280.069 | 18.4990.021 | 17.6350.010 | 17.0250.021 | 16.5530.028 |
| B | 17.7280.118 | 18.6620.025 | 17.5080.010 | 16.8110.022 | 16.2650.030 |
| C | 19.1740.086 | 19.0470.036 | 18.4490.016 | 18.0260.028 | 17.6550.038 |
| D | 20.8220.141 | 19.4590.045 | 18.5290.065 | 17.6940.069 |
| UT | Obs. | mag | Seeing | Exposure time |
|---|---|---|---|---|
| (arcsec) | (sec) | |||
| U–banda | ||||
| Sep 27.9484 | NOT | 20.4370.047 | 1.35 | 1000 |
| Sep 28.8291 | NOT | 21.7320.224 | 1.29 | 450 |
| Sep 29.8493 | NOT | 22.8160.131 | 1.16 | 900 |
| B–banda | ||||
| Sep 27.8881 | NOT | 20.4320.034 | 1.00 | 100 |
| Sep 27.9673 | CA | 20.7330.034 | 2.42 | 1200 |
| Sep 27.9894 | CA | 20.7270.038 | 2.41 | 1200 |
| Sep 28.0057 | CA | 20.7960.039 | 2.59 | 1200 |
| Sep 29.8346 | NOT | 22.8900.122 | 1.19 | 500 |
| Sep 29.8688 | NOT | 22.8560.082 | 1.20 | 600 |
| Sep 30.8688 | NOT | 23.4890.097 | 1.20 | 1200 |
| V–banda,b | ||||
| Sep 27.906 | INT | 19.9060.0135 | 1.0 | 300 |
| Sep 27.910 | INT | 19.9330.0135 | 1.0 | 300 |
| Sep 27.915 | INT | 19.9360.0141 | 1.0 | 300 |
| Sep 27.9237 | CA | 19.9100.025 | 2.22 | 900 |
| Sep 29.9557 | NOT | 22.3240.121 | 1.29 | 600 |
| Sep 30.839 | INT | 22.9870.096 | 1.0 | 600 |
| R–banda,b | ||||
| Sep 27.8547 | NOT | 19.3260.015 | 0.83 | 300 |
| Sep 27.8594 | NOT | 19.3430.011 | 0.84 | 300 |
| Sep 27.8639 | NOT | 19.3220.011 | 0.86 | 300 |
| Sep 27.8651 | CA | 19.3290.034 | 1.44 | 900 |
| Sep 27.8684 | NOT | 19.3420.008 | 0.82 | 300 |
| Sep 27.8729 | NOT | 19.3490.011 | 0.87 | 300 |
| Sep 27.8774 | NOT | 19.3660.010 | 0.90 | 300 |
| Sep 27.8820 | NOT | 19.3490.010 | 0.91 | 300 |
| Sep 27.892 | INT | 19.3940.022 | 1.0 | 300 |
| Sep 27.896 | INT | 19.4110.022 | 1.0 | 300 |
| Sep 27.901 | INT | 19.4210.023 | 1.0 | 300 |
| Sep 27.9109 | CA | 19.4520.020 | 2.01 | 900 |
| Sep 27.9658 | NOT | 19.5380.011 | 1.06 | 300 |
| Sep 27.9705 | NOT | 19.5260.014 | 1.09 | 300 |
| Sep 27.9750 | NOT | 19.5670.015 | 1.01 | 300 |
| Sep 27.9795 | NOT | 19.5420.017 | 1.02 | 300 |
| Sep 27.9840 | NOT | 19.5530.023 | 1.00 | 300 |
| Sep 28.097 | USNOFS | 19.710.03 | 2.0 | 3600 |
| Sep 28.8356 | NOT | 20.7230.025 | 1.06 | 300 |
| Sep 28.8911 | NOT | 20.7740.036 | 1.05 | 500 |
| Sep 28.9595 | NOT | 20.8750.036 | 1.19 | 600 |
| Sep 29.110 | USNOFS | 20.940.04 | 1.8 | 3600 |
| Sep 29.138 | USNOFS | 20.950.04 | 1.9 | 4600 |
| Sep 29.170 | USNOFS | 21.080.05 | 2.0 | 4600 |
| Sep 29.8414 | NOT | 21.7400.043 | 0.86 | 600 |
| Sep 29.9478 | NOT | 21.8970.083 | 1.17 | 600 |
| Sep 30.83 | NOT | 22.4940.070 | 0.90 | 2400 |
| Oct 2.84 | NOT | 23.5140.153 | 1.14 | 1500 |
| Oct 6.85 | NOT | 1.29 | 2700 | |
| Oct 27.84 | NOT | 1.10 | 4700 | |
| Nov 3.84 | NOT | 1.26 | 2400 | |
| Nov 4.84 | NOT | 1.12 | 3600 | |
| I–banda,b | ||||
| Sep 27.919 | INT | 18.9590.029 | 1.0 | 300 |
| Sep 27.924 | INT | 18.9920.029 | 1.0 | 300 |
| Sep 27.929 | INT | 19.0070.029 | 1.0 | 300 |
| Sep 27.9370 | CA | 18.8610.032 | 2.22 | 900 |
| Sep 27.9433 | NOT | 19.0140.014 | 0.72 | 600 |
| Sep 27.9510 | CA | 18.8900.022 | 2.16 | 900 |
| Sep 29.8608 | NOT | 21.2180.051 | 0.79 | 600 |
| Sep 30.839 | INT | 21.9560.029 | 1.0 | 600 |
a Only for the NOT R–band measurements have we subtracted a galaxy image before doing the PSF photometry.
b The following filters were used: NOT – all Bessel; CA – all Johnson; INT: Sloan i, Harris R & V; USNOFS : Bessel R.
Radio and X-ray afterglow measurements have been reported by Frail et al. (2000) and by Piro et al. (2000). Optical afterglow measurements have also been reported by Price et al. (2001). This paper includes preliminary reduced NOT and CA observations from Hjorth et al. (2000), Fynbo et al. (2000b) and Gorosabel et al. (2000) for which the finally reduced data appear in this paper.
3 Celestial Position
By measuring the position of the OT relative to 80 stars in the USNO-A2.0 catalog we found the celestial coordinates of the OT to be RA(J2000) = 17:04:09.68, Dec(J2000) = +51:47:10.5 with an internal error of about 0.1 arcsec and a systematic error of about 0.25 arcsec (Deutsch 1999).
4 Photometry
4.1 R–band light-curve of the OT
In comparison with GRB~000301C (Jensen et al. 2001) GRB 000926 was found to be hosted by a relatively luminous host galaxy (see Sect. 6). When measuring the magnitude of the OT directly on the images with Point Spread Function (PSF) photometry there will be a contribution from the underlying host galaxy. The relative strength of this contribution depends on the seeing and is therefore a source of systematic errors if not corrected for. We therefore subtracted an aligned and scaled image of the host galaxy from each of the individual R–band images from the NOT listed in Table LABEL:obslog. This image of the host galaxy was obtained about 30 days after the burst when the magnitude of the OT, based on an extrapolation of the light-curve, as well as a possible underlying supernova would be negligible (see Sect. 6). We then measured the magnitude of the OT using DAOPHOT-II (Stetson 1987, 1997). The OT was last detected in the image obtained on October 2. The photometry was transformed to the standard system using photometric observations of the four secondary reference stars A–D marked in Fig. 1 obtained at the U.S. Naval Observatory Flagstaff Station. The calibrated UBVRI magnitudes of the stars A–D are given in Table LABEL:compphot.
We first fitted a broken power-law
to the data, which provided a very good fit. The parameters of the fit are given in Table LABEL:fits. We then followed Beuermann et al. (1999) and fitted an empirical function of the form
where and is the time since the GRB measured in days. For large values of this function approaches the broken power-law. We performed this fit both keeping fixed at 1 similar to Stanek et al. (1999) and with as a free parameter. The results of these fits are also given in Table LABEL:fits.
The per degree of freedom is smallest for the broken power-law fit. The data favor a very large value of as the is monotonically decreasing as is increased even for . The 2 lower limit on is in the sense that the difference between for a fit with and the broken power-law is 2. This indicates that the break in the light-curve is very abrupt (within a few hours).
In conclusion, the data are best fit by a sharp break around t=2.120.09 days after the burst. In Fig. 2 we show the R–band light-curve of the OT together with the three fits and the residuals around the fits.

| Fit | other | /dof | ||
|---|---|---|---|---|
| b. p.-l. | 1.690.02 | 2.390.09 | 1.000 | |
| n=1 | 1.400.13 | 3.360.41 | (fixed) | 1.263 |
| n free | 1.690.02 | 2.390.09 | (2) | 1.084 |
4.2 Other optical bands
The OT was also imaged in the U,B,V and I bands during the first four nights after the detection at the NOT and CA.
To precisely determine the broad band colours of the OT we used the UBV and I band observations obtained at NOT and INT. The CA points were excluded since Johnson R and I filters are significantly different from Bessel, Cousins and Harris. We determined the colours as the offset of the broken power-law fit to the R–band light-curve that minimized the of the fit. Due to the lower error bars the magnitudes obtained on Sep 27 have the largest weight in the fits. Therefore we do not expect a large systematic uncertainty due to emission from the underlying host galaxy. In order to minimize the effect of the host galaxy only points obtained earlier than and including September 29 were used in the fits. The 1 errors on the colours were determined as the colours that increased the value of by 1, but the true uncertainty including calibration and systematic errors is most likely somewhat larger (5%). For all filters U,B,V and I the fits were consistent with the (offset) broken power-law fit, which shows that the data within the errors (few percent) are consistent with an achromatic optical afterglow. The results are given in Table LABEL:colours.
| Colour | GRB 000926 | /dof | GRB 000301C | |
|---|---|---|---|---|
| U-R | 0.960.04 | 0.59 | 0.400.05 | |
| B-R | 1.060.03 | 0.53 | 0.910.03 | |
| V-R | 0.500.01 | 0.34 | 0.440.05 | |
| R-I | 0.480.01 | 0.48 | 0.490.04 | |
| R-K | 3.350.07 | 1.87 | 2.980.08 |
4.3 Infrared photometry
The afterglow was observed in the K’–band on September 29, 2000 with the IRCS instrument on the 8.2-m Subaru telescope in a seeing of about 0.7 arcsec and a total integration time of 1800sec. No standard star observations were obtained on the same night, but fortunately there is a bright, unsaturated 2MASS source in the field which we could use for calibration. We measured the magnitude of the OT and of the 2MASS source in a 2 arcsec circular aperture. The formal photometric error-bar is less than a percent, but we estimate conservatively that the uncertainty in the colour-transformation for the IRCS instrument amounts to 0.10 mag.
The afterglow was also observed in the J, H and K bands with the UFTI imager on UKIRT on September 30. The final frames were accumulated in 26, 24 and 9 dithered exposures of 60 s duration for J, H and K respectively resulting in a total on-source integration time of 1.56 ks, 1.44ks and 540 s, all in photometric conditions. Employing standard procedures these frames were reduced, combined and calibrated using observations of UKIRT faint standards bracketing the science exposures. The final frames have only a (for this instrument) modest seeing of 0.55–0.60′′ FWHM due to the relatively high airmass of the observations, 1.5–2, but clearly detect the OT in all three passbands. The magnitude of the OT was again measured using aperture photometry. The results of the IR photometry is presented in Table LABEL:IRlog.
Using the standard star calibrated UKIRT K-band observations we confirmed from faint objects visible in both the UKIRT and SUBARU images that the calibration of the SUBARU images is consistent with that of the UKIRT K-band observations.
| UT (Sep) | filter/Obs. | mag | Seeing | Exp. time |
|---|---|---|---|---|
| (arcsec) | (sec) | |||
| 30.276 | J/UKIRT | 20.830.15 | 0.6 | 1560 |
| 30.250 | H/UKIRT | 19.460.10 | 0.6 | 1440 |
| 29.24 | K’/SUBARU | 17.860.10 | 0.7 | 1800 |
| 30.301 | K/UKIRT | 18.660.11 | 0.6 | 540 |
5 Spectral energy distribution of the afterglow
Also shown in Table LABEL:colours are the colours (in the same bands) of the OT of GRB 000301C, which was also discovered at the NOT and had a very similar redshift as GRB 000926 (Jensen et al. 2001; Møller et al. in prep). As seen, the OTs of GRB 000926 and GRB 000301C had very similar colours in the optical red bands, whereas in the blue bands and in RK the OT of GRB 000926 was significantly redder than that of GRB 000301C. In order to test whether this difference is intrinsic to the bursts or caused by a larger extinction along the line of sight to GRB 000926 we follow Jensen et al. (2001) and constrain the extinction by fitting different extinction laws to the SED.
To construct the SED we first used the colours given in Table LABEL:colours for the observed U to I bands (normalised to Sep 27.9 UT). The J, H and K-observations were obtained on Sep 30.3 where the host galaxy possibly contributed significantly to the flux. In order to estimate the effect of the host galaxy we used the SEDs for galaxies at redshifts z=2–3 given by Dickinson (2000, their Fig. 2). By normalising these galaxy SEDs to the observed R(AB)=24.040.15 for the host galaxy (see Sect. 6 below) we derived magnitudes for the host galaxy which translate into estimated corrections at Sep 30.3 UT of J=+0.140.08, H=+0.070.06 and K=+0.050.04. The JHK magnitudes were then shifted to Sep 27.9 UT using the broken power-law fit to the light-curve given in Table LABEL:fits (assuming that the burst evolved achromatically). After this the UBVRIJHK magnitudes were corrected for foreground extinction, using a value of E(BV)=0.023 from Schlegel et al. (1998), and transformed to the AB system. For the optical bands we used the transformations given by Fukugita et al. (1995): I(AB) = I+0.43, R(AB) = R+0.17, V(AB) = V-0.02, B(AB) = B-0.14, and U(AB) = U+0.69. We assigned uncertainties of 0.05 mag to the BVR and I AB magnitudes as an estimate of the uncertainty in the transformation. For U band we assigned an uncertainty of 0.10 mag to the AB magnitude since this band is more difficult to calibrate (Bessel 1990; Fynbo et al. 1999, 2000c). For the IR bands we used the transformations given in Allen (2000): K(AB) = K+1.86, H(AB) = H+1.35, and J(AB) = J+0.87. We then calculated the specific flux using . Finally, the wavelengths corresponding to our UBVRIJHK measurements were blueshifted to the GRB rest frame. As it can be seen in Fig. 3 the spectral energy distribution is clearly bending from the U to the K–band. This bend can be naturally explained by the presence of intrinsic extinction at z=2.037. The J-point is falling significantly below the trend of all the other points. The reason for this is not understood, but we have decided not to include this point in the analysis. Including the point does not change any of the conclusions, but it increases the of the fits.
We next fitted the function F to the SED. Here, is the spectral index and Aν is the extinction in magnitudes at frequency . We have considered the three extinction laws (Aν as a function of ) given by Pei (1992), i.e. for the Milky-Way (MW), Large Magellanic Cloud (LMC) and the Small Magellanic Cloud (SMC). In the three cases the dependence of the extinction with have been parameterized in terms of (restframe) AV. Thus, our fits allow us to determine and AV simultaneously. Finally, we also considered the no-extinction case where Fν was fitted by a straight line in log-log space.
The parameters of the fits are shown in Table LABEL:sedtab. For the no-extinction case we find a value of consistent with that of Price et al. 2001. As for GRB 000301C the best fit was achieved for a SMC extinction law. We derive a modest extinction of A (restframe ) and a spectral index . For GRB 000301C Jensen et al. (2001) found . Therefore, GRB000926 was indeed intrinsically redder than GRB 000301C.
In the upper panel of Fig. 3 we show the fits using the LMC and SMC extinction laws and the no-extinction case. For the redshift of GRB 000926 (as for that of GRB 000301C) the interstellar extinction bump at 2175 Å is shifted into the R-band. This absorption bump is very prominent for the MW, moderate for the LMC and almost nonexistent for the SMC extinction curve. Thus, for a chemically rich environment, like the MW, we should expect a prominent extinction bump at 2175 Å (near the observed R-band). The data points in Fig. 3 shows that there is no strong absorption bump near the R-band, which makes the fit for the MW (see Table LABEL:sedtab) inconsistent with the data. In fact, the best MW fit implies a (unphysical) negative extinction. To illustrate the problem with the MW extinction curve we have in the lower panel of Fig. 3 plotted a power-law SED extincted by a AV=0.2 MW extinction curve. As seen, the shape of this extinction curve is incompatible with the data. In the Milky Way the extinction curve can be different mainly for stars located in star-forming regions (Baade and Minkowski 1937; Whittet 1992) in the sense that the shape of the bump at 2175 Å is different and more importantly the curve is almost flat in the rest-frame UV at 15.1. This is where the curvature is most pronounced in Fig. 3 and therefore such an extinction curve is also not compatible with the data (see also Price et al. 2001)
In conclusion, as in the case of GRB000301C, the SED supports a scenario of a host in an early stage of chemical enrichment.
| AV | |||
|---|---|---|---|
| No extinction | 3.20 | 1.42 0.06 | 0 |
| Pei (1992), MW | 0 | ||
| Pei (1992), LMC | 2.61 | 0.98 0.23 | 0.27 0.12 |
| Pei (1992), SMC | 1.71 | 1.00 0.18 | 0.18 0.06 |

6 The host galaxy
In the images obtained on October 6 the emission at the position of the OT appeared elongated although at low signal-to-noise ratio. We therefore obtained further deep imaging on October 27 and November 3 and 4. A total of 3 hours of R-band imaging was obtained under dark/grey sky conditions and a seeing varying between 1.0 and 1.3 arcsec. We subsequently combined these images using the code described in Møller and Warren (1993). The FWHM of point sources in the combined image was 1.18 arcsec. In the combined image an extended object directly underneath the position of the OT was clearly detected. A contour image showing this extended emission is shown as Fig. 6. Although the seeing was not optimal, the object is resolved into several compact knots covering a region of total extension of about 5 arcsec. This is more clearly visible in images of the host galaxy + OT obtained with the Hubble Space Telescope presented by Price et al. (2001). In order to determine the position of the OT relative to these compact knots we measured the position of the OT relative to point-sources in the vicinity in the first image obtained on September 27 and in the combined image. The position of the OT in the combined image could in this way be determined with a conservatively estimated uncertainty of 0.02 arcsec (10% of a pixel). The position of the OT is within the errors spatially coincident with one of the knots of the extended emission. As the OT, based on an extrapolation of the light-curve, is expected to be much fainter than this knot (by several magnitudes) we conclude that at least this particular knot is related to the host galaxy of GRB 000926. An underlying supernova (SN) even if similar to SN1998bw would also be much fainter than the observed knot, especially since the R–band corresponds to the rest-frame UV around 2100Å where SNe are intrinsically faint. Whereas it is possible that all the compact knots are either part of the host galaxy or several galaxy sub-clumps in the process of merging, we cannot exclude that some of the emission is from objects lying at other distances along the line of sight (although there are no intervening absorption systems in the spectrum of the OT, Møller et al. in prep). If all the emission is from the host galaxy of GRB 000926 then the extension of the galaxy would be similar to the Ly- emitting region of the galaxy S4 at z=1.93 towards Q0151+048A (Fynbo et al. 1999).
The total magnitude of the extended emission in a circular aperture with diameter 4.7 arcsec is R=23.870.15. Assuming that all this emission comes from the host galaxy we can get an estimate of the star-formation-rate (SFR) of the galaxy. The restframe UV continuum in the range 1500Å–2800Å can be used as a SFR estimator if one assume that the star-formation is continuous over a time scale of more than 108 years. Kennicutt (1998) provides the relation
where is the luminosity in the 1500Å–2800Å range measured in erg s-1 Hz-1. The observed R–band corresponds to the rest-frame UV continuum around 2100Å, which falls well within this range. To derive we first converted our R–band magnitude to R(AB) using R(AB)=R+0.17 (Fukugita et al. 1995). Then we used the definition of the AB magnitude to derive the observed flux () and finally the luminosity distance in our assumed cosmology (dlum=5.281028cm) to derive :
where the factor corrects for the fact that is a specific luminosity (not a bolometric luminosity). Using the relation of Kennicutt (1998) we find a SFR of 14 M☉ yr-1. If the extinction derived in Sect. 5 is valid for the galaxy as a whole then we estimate an extinction in the observed R-band of 0.560.20 mag, which means that the SFR should be increased by a factor of . This SFR is a high compared to that of the Milky Way, but it falls in the low end of the range of SFRs of Lyman-Break galaxies (Pettini et al. 1998).

7 Discussion
7.1 Interpretation of the light-curve
The temporal behavior of the optical afterglow of GRB 000926 is a clear and unambiguous example of a broken power-law decay. The fits described in Sect. 4.1 show that the break occurred abruptly. The late time decay slope of =2.390.09 is very similar to the late time decay slopes of other well studied broken or fast decaying light-curves (see e.g. Andersen et al. 2000, their Fig. 4 and Table 4). This striking uniformity suggest a common physical scenario for the late stage of the decays, which most likely is a common value of the index of the electron energy distribution (see also Sari et al. 1999; Freedman and Waxman 2001).
The increase from the early to the late time decay slope is different for different physical models for GRB afterglows. For GRB 000926 we find from the broken power-law fit. This measurement we compare with different models predicting broken light-curves: i) If the frequency separating fast cooling and slow cooling electrons moves through the optical part of the electromagnetic spectrum at , the resulting light curve would steepen by (Sari et al. 1998); ii) If a spherical fireball slows down to a non-relativistic expansion (Dai and Lu 1999) then for our value of ; iii) If the outflow is collimated with a fixed opening angle, the break in the light curve occurs when the relativistic beaming of the synchrotron radiation becomes wider than the jet opening angle with a predicted steepening of (Mészáros and Rees 1999); iv) finally, if the afterglow arises in a sideways expanding jet, the steepening will be (Rhoads 1999) for our value of . The above estimates all assume a constant mean density distribution of the ambient medium. Only model iii, i.e. a jet with fixed opening angle, is consistent with the observed value of . This model predicts a spectral slope of the afterglow of , which is consistent with the from the multi-band photometry. If the density of the surrounding medium was that of stellar wind ( with ) we expect (Mészáros and Rees 1999; Jaunsen et al. 2001), which is excluded by the data at the 2.2 level.
7.2 Comparison with GRB 000301C
Even though the gamma-ray emission of GRB 000301C (Jensen et al. 2001) was of about 10 times shorter duration than that of GRB 000926, the fact that they have nearly identical redshifts of z=2.03750.0007 for GRB 000926 (Møller et al. in prep) and z=2.04040.0008 for GRB 000301C (Jensen et al. 2001) makes it very convenient to compare the two. Both GRB 000301C and GRB 000926 displayed broken power-law decays. For the OT of GRB 000301C Jensen et al. (2001) determined and . In this case the best model is that of a side-ways expanding jet in a medium of constant density, whereas a jet with fixed opening angle is not consistent with the data. Therefore, even though the two bursts appear similar they cannot be explained by the same model.
GRB 000301C and GRB 000926 have very different host galaxies. The host galaxy of GRB 000301C remains undetected despite a very deep detection limit of R=28.5 (Fruchter et al. 2000a; Smette et al. 2001), whereas the host galaxy of GRB 000926 is relatively bright at R=23.870.15 (Sect. 6). Hence, the host galaxy of GRB 000926 is more than 70 times brighter than that of GRB 000301C. In the same way GRB~990123 and GRB~990510 occured at nearly identical redshifts (z1.6) and the host galaxy of the former is more than 30 times brighter than the latter (Holland and Hjorth 1999; Fruchter et al. 1999, 2000b). If GRBs indeed trace star-formation these observations indicate that at these redshifts galaxies covering a broad range of luminosities contribute significantly to the over-all density of star formation. Furthermore, as the observed R–band flux is proportional to the star formation rate, there must be 1–2 orders of magnitude more galaxies at the R=28 level than at the R=24 level at z2. Otherwise it would be unlikely to detect R=28 galaxies as GRB hosts (under the assumption that GRBs trace star-formation). An alternative explanation is that the faint host galaxies of GRB 000301C and GRB 990510 are faint at rest-frame UV wavelengths due to massive extinction similar to some sources selected in the sub-mm range (e.g. Ivison et al. 2000). However, the low extinction derived from the optical properties of the GRB 000301C afterglow argues against this explanation at least for this particular burst.
Acknowledgements
Most of the optical data presented here have been taken using ALFOSC, which is owned by the Instituto de Astrofisica de Andalucia (IAA) and operated at the Nordic Optical Telescope under agreement between IAA and the NBIfAFG of the Astronomical Observatory of Copenhagen. UKIRT is operated by the Joint Astronomy Centre on behalf of the Particle Physics and Astronomy Research Council of the United Kingdom. JUF and THD acknowledges enthusiastic help and support from C. Møller and I. Svärdh during the hectic moments of finding the OT by comparison with DSS-plates. JUF acknowledges H.O. Fynbo for introducing him to CERNs MINUIT fitting programme. JG acknowledges the receipt of a Marie Curie Research Grant from the European Commission. MIA acknowledges the Astrophysics group of the Physics dept. of University of Oulu for support of his work. IRS acknowledges support from a Royal Society URF. IB was supported by Pôle d’Attraction Interuniversitaire, P4/05 (SSTC, Belgium). JMCC acknowledges the receipt of a FPI doctoral fellowship from Spain’s Ministerio de Ciencia y Tecnología. KH is grateful for Ulysses support under JPL Contract 958056, and for NEAR support under NASA grants NAG5-9503 and NAG5-3500. Additionally, the availability of the GRB Coordinates Network (GCN) and BACODINE services, maintained by Scott Barthelmy, is greatly acknowledged. We acknowledge the availability of POSS-II exposures, used in this work; The Second Palomar Observatory Sky Survey (POSS-II) was made by the California Institute of Technology with funds from the National Science Foundation, the National Aeronautics and Space Administration, the National Geographic Society, the Sloan Foundation, the Samuel Oschin Foundation, and the Eastman Kodak Corporation. We acknowledge the availability of the 2MASS catalogs. This work was supported by the Danish Natural Science Research Council (SNF).
References
- (1) Allen C. W., “Allen’s Astrophysical Quantities”, 4th edition 2000, Eds. A. N. Cox.
- (2) Adelberger K., Steidel C.C., 2000, ApJ in press
- (3) Andersen M.I., Hjorth J., Pedersen H., et al., 2000, A&A 364, L54
- (4) Baade W., Minkowski R., 1937, ApJ 86, 123
- (5) Beuermann K., Hassman F.V., Reinsch K., et al., 1999, A&A 352, L26
- (6) Bessel M.S., 1990, PASP 281, 817
- (7) Bloom J.S., Kulkarni S.R., Djorgovski S.G., 2000, AJ in press (astro-ph/0010176)
- (8) Castro-Tirado A.J., 2001, to appear in the ESA-SP Proc. of the INTEGRAL symposium, in press (astro-ph/0102122)
- (9) Costa E., Frontera F., Heise J., et al., 1997, Nature 387, 783
- (10) Dai C.G., Lu T., 1999, ApJ 519, L155
- (11) Dall T., Fynbo J.U., Pedersen H., 2000, et al., GCN 804
- (12) Dickinson M., 2000, PTRSL 358, 2001
- (13) Djorgovski S.G., Pahre M.A., Bechtold J., Elston R., 1996, Nature, 382, 234
- Deutsch (1999) Deutsch, E. W. 1999, AJ 118, 1882
- (15) Ellison S.L., Pettini M., Steidel C.C., Shapley A.E., 2001, ApJ 549, 770
- (16) Fynbo J.U., Møller P., Warren S.J., 1999, MNRAS 305, 849
- (17) Fynbo J.U., Thomsen B. Møller P., 2000a, A&A 353, 457
- (18) Fynbo J.U., Møller P., Gorosabel J., et al., 2000b, GCN 825
- (19) Fynbo J.U., Burud I., Møller P., 2000c, A&A 358, 88
- (20) Frail D., et al., 2000, GCN 805
- (21) Freedman D.L., Waxman E., 2001, ApJ 547, 922
- (22) Fruchter A., Thorsett S.E., Metzger M.R., et al., 1999, ApJ 519, L13
- (23) Fruchter A., Metzger M., Petro L., 2000a, GCN 701
- (24) Fruchter A., Hook R., Pian E., 2000b, GCN 757
- (25) Fukugita M., Shimasaku K., Ichikawa T., 1995, PASP107, 945
- (26) Gorosabel J., Castro Ceŕon J.M., Castro-Tirado A.J., et al., 2000, GCN 803
- (27) Hjorth J., Jensen B.L., Pedersen H., et al., 2000, GCN 809
- (28) Holland S., Hjorth J., 1999, A&A 344, L67
- (29) Hu E.M., Cowie L.L., McMahon R.G., 1998, ApJ 502, L99
- (30) Hughes D.H., Serjeant S., Dunlop J., et al., 1998, Nat 394, 241
- (31) Hurley K., 2000, GCN 801 and 802
- (32) Ivison R.J., Smail I., Barger A.J., et al., 2000, MNRAS 315, 209
- (33) Jaunsen A.O., Hjorth J., Björnson G., et al., 2001, ApJ 546, 127
- (34) Jensen B.L., Fynbo J.U., Gorosabel J., et al., 2001, A&A in press (astro-ph/0005609)
- (35) Kennicutt R.C., 1998, ARA&A 36, 189
- (36) Kudritzki R.-P., Méndez R.H., Feldmeier J.J., et al., 2000, ApJ 536, 19
- (37) Kulkarni S.R., Berger E., Bloom J.S., et al., 2000, To appear in Proc. of the 5th Huntsville GRB Symposium (astro-ph/0002168)
- (38) Lamb D.Q., Reichart D.E., 2000, ApJ 536, L1
- (39) Metzger M.R., Djorgovski S.G., Kulkarni S.R., et al., 1997, Nature 387, 878
- (40) Mészáros P., Rees M.J., 1999, MNRAS 306, 3, L39
- (41) Møller P., Warren S.J., 1993, A&A 270, 43
- (42) Møller P., Warren S.J., 1998, MNRAS 299, 661
- (43) van Paradijs J., Groot P.J., Galama T., et al., 1997, Nature 386, 686
- (44) Peacock J.A., Rowan-Robinson M., Balin A., et al., 2000, MNRAS 318, 535
- (45) Pei Y.C., 1992, ApJ 395, L30.
- (46) Pettini M., Kellogg M., Steidel C.C., et al., 1998, ApJ 508, 539
- (47) Piro et al., 2000, GCN 812, 832
- (48) Price P.A., Harrison F.A., Galama T.J., et al., 2001, ApJL in press (astro-ph/0012303)
- (49) Rhoads J.E. 1999, ApJ 525, 737
- (50) Sari R., Piran T., Narayan R., 1998, ApJ 497, L17
- (51) Sari R., Piran T., Halpern J.P., 1999, ApJ 519, L17
- (52) Schlegel D.J., Finkbeiner D.P., Davis M., 1998, ApJ 500, 525
- (53) Smail I., Ivison R.J., Blain A.W., 1997, ApJ 490, L5
- (54) Smette A., Fruchter A.S., Gull T.R., et al., 2001, ApJ in press (astro-ph/0007202)
- (55) Stanek K.Z., Garnavich P.M., Kaluzny J., Pych W., Thompson I., 1999, ApJ 522, L39
- (56) Steidel C.C., Giavalisco M., Pettini M., Dickinson M., Adelberger K., 1996, ApJ 462, L17
- (57) Steidel C.C., Adelberger, Shapley A.E., et al., 2000, ApJ 532, 170
- (58) Stetson P., 1987, PASP 99, 191S
- (59) Stetson P., 1997, “User’s Manual for DAOPHOT II’
- (60) van der Werf P.P., Knudsen K.K., Labbé I., Franx M., 2000, In : “The far-infrared and submillimeter spectral energy distributions of active and starburst galaxies”, eds. I. van Bemmel, B. Wilkes and P. Barthel, New Astronomy Reviews, in press
- (61) Whittet D.C.B., 1992, “Dust in the Galactic Environment”, (IOP Publishing Ltd), p. 73
- (62) Wolfe A.M., Lanzetta K.M., Foltz C.B., Chaffee F.H., 1995, ApJ 454, 698