Chandra X-ray Spectroscopic Imaging of Sgr A∗
and
the Central Parsec of the Galaxy
Abstract
We present results of our Chandra observation with ACIS-I centered on the position of Sagittarius A∗ (Sgr A∗), the compact nonthermal radio source associated with the massive black hole (MBH) at the dynamical center of the Milky Way Galaxy. We have obtained the first high spatial resolution (), hard X-ray (0.5–7 keV) image of the central 40 pc (17′) of the Galaxy.
We have discovered an X-ray source, CXOGC J174540.0290027 (catalog ), coincident with the radio position of Sgr A∗ to within 035, corresponding to a maximum projected distance of 16 light-days for an assumed distance to the center of the Galaxy of 8.0 kpc. We received () net counts from the source in 40.3 ks. The source is detected with high significance, , despite the highly elevated diffuse X-ray background in the central parsec of the Galaxy. Due to the low number of counts, the spectrum is well fit either by an absorbed power-law model with photon index ( photons cm-2 s-1 keV-1) and column density cm-2 (90% confidence interval) or by an absorbed optically thin thermal plasma model with keV and cm-2. Using the power-law model, the measured (absorbed) flux in the 2–10 keV band is ergs cm-2 s-1, and the absorption-corrected luminosity is ergs s-1.
The X-ray source coincident with Sgr A∗ is resolved, with an apparent diameter of . We report the possible detection, at the significance level, of rapid continuum variability on a timescale of several hours. We also report the possible detection of an Fe K line at the level. The long-term variability of Sgr A∗ is constrained via comparison with the ROSAT/PSPC observation in 1992. The origin of the X-ray emission (MBH vs. stellar) and the implications of our observation for the various proposed MBH emission mechanisms are discussed. The current observations, while of limited signal-to-noise, are consistent with the presence of both thermal and nonthermal emission components in the Sgr A∗ spectrum.
We also briefly discuss the complex structure of the X-ray emission from the Sgr A radio complex and along the Galactic plane and present morphological evidence that Sgr A∗ and Sgr A West lie within the hot plasma in the central cavity of Sgr A East. Over 150 point sources are detected in the field of view. Our survey of X-ray sources is complete down to a limiting 2–10 keV absorbed flux of ergs cm-2 s-1. For sources at the distance of the Galactic Center, the corresponding absorption-corrected luminosity is ergs s-1. The complete flux-limited sample contains 85 sources. Finally, we present an analysis of the integrated emission from the detected point sources and the diffuse emission within the central 0.4 pc (10″) of the Galaxy.
1 Introduction
After decades of controversy, measurements of stellar dynamics have confidently established that the nucleus of the Milky Way Galaxy harbors a massive black hole (MBH) with a mass (Genzel et al., 1997; Ghez et al., 1998). The MBH coincides with the compact, nonthermal radio source Sagittarius A∗ (Sgr A∗), but no emission at other wavelengths has been convincingly associated with it (§2.1). It is also well known that the bolometric luminosity () and the X-ray luminosity () of Sgr A∗ are far lower than expected from the standard thin accretion disk model used in the study of X-ray binaries and quasars (Shakura & Sunyaev, 1973; Watson et al., 1981; Bradt & McClintock, 1983; Frank, King, & Raine, 1992; Morris & Serabyn, 1996, and references therein). The bolometric luminosity of a black hole radiating at the Eddington rate () is ergs s-1, while the measured bolometric luminosity of Sgr A∗ is ergs s-1 (see Narayan et al., 1998a, and references therein). In the standard model, of the luminosity is in X-rays (Frank, King, & Raine, 1992), so one would expect ergs s-1, if Sgr A∗ were radiating at the Eddington rate. The MBH at Sgr A∗ has been undetected in the 2–10 keV band with ergs s-1 (§2.2), which is times fainter than the X-ray luminosity that would be expected at the Eddington rate. Similarly, the MBHs at the cores of several nearby spiral galaxies emit ergs s-1, implying that they are times fainter in X-rays than would be expected at their Eddington rates (Garcia et al., 2000; Terashima, Ho, & Ptak, 2000; Ho et al., 2001).
The absence of a strong, compact X-ray source associated with the MBH at the Galactic Center has been one of the profound mysteries of high-energy astrophysics and must have at least one of three basic causes. First, the MBH may reside in an environment where the accretion rate yr-1, either because the ambient gas has extremely low density, or because it is too hot or is moving too fast to accrete efficiently, or because it is dynamically ejected prior to accretion. Here is the radiative efficiency of the accretion flow and is the speed of light. Second, the mechanism of accretion may be such that the radiative efficiency is extremely low. The advection-dominated accretion flow (ADAF; Narayan, Mahadevan, & Quataert, 1998b) and related models can achieve low values of and have been intensively applied to the Sgr A∗ problem. Third, the X-ray emission from Sgr A∗ may be much higher than observed due to anisotropy (e.g., a relativistic beam oriented perpendicular to the Galactic plane) and/or extremely high absorption along the line-of-sight.
The recently launched Chandra X-ray Observatory (CXO) with its Advanced CCD Imaging Spectrometer (ACIS) detector provides a unique opportunity to advance our knowledge of X-ray emission from Sgr A∗. It combines a superb mirror with sub-arcsecond resolution and an imaging detector with high efficiency over a broad X-ray band and moderate spectral resolution. The spatial resolution and accurate astrometry are essential to discriminate emission from Sgr A∗ from X-rays produced in the surrounding compact cluster of massive stars and other hot plasma in the region. The sensitivity of Chandra/ACIS at high X-ray energies is essential to penetrate the high interstellar column density along the line-of-sight to the Galactic Center (§2.1).
After a review of some relevant past studies (§2), we describe the observations, data analysis, source detection, and astrometry (§3). The resulting image of the inner 40 pc (17′) of the Galaxy is presented in §4, and the properties of the innermost arcsecond associated with Sgr A∗ are described in §5. The integrated emission from point sources (§6) and the diffuse emission (§7) within the central 10″ of the Galaxy are discussed. Tentative identifications of the X-ray point sources in the central 10″ with bright IR sources and the effects of source confusion on observations by other X-ray satellites are presented in §8. A limit on the long-term X-ray variability of Sgr A∗ is derived in §9. The origin of the X-ray emission (i.e., MBH vs. stellar) is discussed (§10) and implications for the astrophysics of the central MBH of the Galaxy are presented (§11). We summarize our findings, evaluate the various models, and discuss the scientific goals of future observations in §12. This is the first of several papers arising from this Chandra observation: our analysis of the X-ray emission from Sgr A East is presented by Maeda et al. (2001). Future papers will present our studies of the X-ray emission from the point sources and the diffuse plasma distributed throughout the field.
2 Past Studies
2.1 Radio/IR
Sgr A∗ is a compact, nonthermal radio source (Balick & Brown, 1974; Backer, 1996). Radio proper motion studies performed over the last decade place Sgr A∗ at the dynamical center of the Galaxy and set a lower limit on its mass of (Backer & Sramek, 1999; Reid et al., 1999). It has an intrinsic radio brightness temperature K (Backer et al., 1993; Rogers et al., 1994) and is weakly variable on timescales of less than about a month in the centimeter and millimeter bands (Zhao, 1989; Wright & Backer, 1993; Falcke, 1999; Zhao, Bower, & Goss, 2000). These properties are reminiscent of the compact nuclear radio sources present in radio-loud quasars and active galactic nuclei (AGN) and suggest that Sgr A∗ may derive its luminosity from matter accreting onto the MBH at the center of the Galaxy (Lynden-Bell & Rees, 1971).
Polarimetric and spectro-polarimetric observations made with the Very Large Array (VLA) and the Berkeley-Illinois-Maryland-Association (BIMA) radio interferometers show that Sgr A∗ is linearly unpolarized at frequencies up to at least 86 GHz (Bower et al., 1999a, c); the upper-limit on linear polarization at 86 GHz is 1%. Aitken et al. (2000) report the detection of linear polarization from Sgr A∗ at 750, 850, 1350, and 2000 µm with the SCUBA camera on the 15-m James Clerk Maxwell Telescope (JCMT). After removing the effects of strong free-free emission and polarized dust from the single-dish JCMT beam (34″ at 150 GHz), Aitken et al. report the fractional linear polarization at 2000 µm (150 GHz) to be .
Bower, Falcke, & Backer (1999b) detect circular polarization of Sgr A∗ at 4.8 and 8.4 GHz with the VLA; the fractional circular polarization at 4.8 GHz is . The circular polarization at 4.8 GHz is confirmed independently by Sault & Macquart (1999) with the Australia Telescope Compact Array (ATCA). Bower (2000) reviews the current state of radio polarization observations of Sgr A∗.111GCNEWS: Galactic Center Electronic Newsletter (Falcke & Cotera, 1997) is available at http://www.mpifr-bonn.mpg.de/gcnews/gcnews/Vol.11/article.shtml. He reports significant variability of the circularly polarized flux on timescales of a few days. This has important implications for the emission mechanism(s) at radio and (perhaps) higher frequencies.
The total radio luminosity of Sgr A∗ is estimated to be a few hundred (Morris & Serabyn, 1996). This raises the possibility that the emission could result from accretion onto a cluster of compact stellar-mass objects (Ozernoy, 1989; Morris, 1993). However, recent proper motion studies of stars within 6″ of the Galactic Center constrain the minimum mass density of the central gravitational potential to be pc-3 (Eckart & Genzel, 1997; Ghez et al., 1998). The best-fit model from Ghez et al. requires a dark central object of mass within pc of Sgr A∗ (see also Genzel et al., 2000). These results rule out a cluster of compact stellar mass objects as the energy source for Sgr A∗ (see Maoz, 1998) but provide no direct evidence that the central engine is a MBH. Furthermore, dynamical studies cannot provide the spectral information needed to identify the underlying emission mechanism or mechanisms.
Numerous models have been proposed which can produce centimeter through millimeter band spectra that are at least roughly consistent with the observations, but this spectral range is too narrow to identify uniquely the nature of the central engine. What is needed is a detection or strict upper limit on the flux of Sgr A∗ at higher frequencies to fix the overall spectrum on both ends.
A few claims have been made in the literature for the detection of Sgr A∗ in the mid- and near-IR (Stolovy, Hayward, & Herter, 1996; Genzel et al., 1997). However, the search for an infrared (IR) counterpart to Sgr A∗ is hampered by source confusion and the strong IR background in the Galactic Center. Precise astrometric alignment of IR images with radio maps using OH/IR stars that are also masers indicates that none of the confirmed IR sources seen so far can be associated definitively with the position of Sgr A∗ (Menten et al., 1997). Furthermore, none of the near-IR sources yet stands out spectroscopically as a possibly non-stellar object. Consequently, claims of detection of IR emission from Sgr A∗ are widely viewed as upper limits at this time.
The Galactic Center is heavily obscured by gas and dust in the optical and ultraviolet wavebands ( mag; Becklin et al., 1978; Rieke, Rieke, & Paul, 1989). Thirty magnitudes of visual extinction corresponds to a column density cm-2 (Predehl & Schmitt, 1995), so the obscuring medium becomes partially transparent to X-rays from the Galactic Center at energies keV. X-ray observations thus provide our best opportunity to constrain the high-frequency end of the spectral energy distribution of Sgr A∗. Since strong, hard X-ray emission is a characteristic property of AGN, Sgr A∗ is expected to be an X-ray source if it derives its energy from accretion onto a massive black hole. However, no definitive detection of X-ray emission from Sgr A∗ had been made prior to the launch of Chandra in July of 1999.
2.2 X-ray
X-ray observations of the regions surrounding Sgr A∗ were carried out with very early rocket- and balloon-borne instruments (see review by Skinner, 1989), but detailed observations started with Einstein, the first satellite equipped with X-ray imaging optics (Watson et al., 1981). Einstein observed the Galactic Center twice, 6 months apart, with the IPC (0.5–4.0 keV) for a total of 18.3 ks and once with the HRI (0.5–4.5 keV) for 9.1 ks. The Einstein/IPC images have an angular resolution of and reveal 12 discrete sources within the central of the Galaxy. The error box for the strongest of these sources (1E 1742.52859) is centered only 20″ from the position of Sgr A∗. Assuming an absorbed thermal bremsstrahlung model with keV and cm-2, Watson et al. estimate the absorption-corrected 0.5–4.5 keV luminosity of this source to be ergs s-1.222Throughout this paper we adopt 8.0 kpc for the distance from Earth to the center of our Galaxy (Reid, 1993). All luminosities have been adjusted to this distance, except where specified otherwise. The Einstein images show that the discrete sources are embedded in a bright, elliptically shaped region of apparently diffuse emission lying along the Galactic plane that accounts for 85% of all the emission from that region. No variability was detected in the point sources over the 6-month baseline. The Einstein/HRI image is essentially blank due to the high absorbing column and the low detection efficiency of that instrument.
Predehl & Trümper (1994) observed the Galactic Center with the ROSAT/PSPC for 50 ks in March 1992 and detected 14 sources within the central of the Galaxy. With the relatively high spatial resolution of 10–20″ (FWHM), they resolved 1E 1742.52859 into three sources, one of which (RX J1745.62900) is coincident with the radio position of Sgr A∗ to within 10″. The high absorption column and the soft energy band (0.1–2.5 keV) of the PSPC limited their ability to fit the spectrum and to constrain the spectral parameters.
Hard X-ray observations (2–30 keV) centered on Sgr A∗ have been made with non-imaging instruments (Skinner et al., 1987; Kawai et al., 1988; Pavlinsky, Grebenev, & Sunyaev, 1994). The line-of-sight to the Galactic Center becomes optically thin to hard X-rays, hence the fluxes measured by these missions are nearly free from the effects of absorption. These observations suggest the presence of a long-term variable source near the position of Sgr A∗ with the measured 3–10 keV flux varying over the range (2– ergs cm-2 s-1, corresponding to an unabsorbed luminosity of about (2– ergs s-1. In order to simultaneously reproduce the low-energy spectrum measured with ROSAT and a higher energy spectrum (4–20 keV) measured with the ART-P telescope on Granat (Pavlinsky, Grebenev, & Sunyaev, 1994), Predehl & Trümper found the absorption column has to be (1.5– cm-2, which is about 3 times larger than expected from IR observations of nearby stars. Following Watson et al., Predehl & Trümper adopt a thermal bremsstrahlung model with keV, but cm-2, and derive an unabsorbed 0.8–2.5 keV luminosity for RX J1745.62900 of ergs s-1.333Using the same data as Predehl & Trümper (1994), Predehl & Zinnecker (1996) report the 0.8–2.5 keV luminosity of RX J1745.62900 as 1– ergs s-1, assuming an absorbed power-law model with and cm-2. However, Predehl & Zinnecker do not specify whether this luminosity is corrected for absorption. We have used the spectral model of Predehl & Zinnecker in XSPEC with the response matrix pspcb_gain2_256.rsp to compute the predicted PSPC count rate. Normalizing the model to the count rate observed by Predehl & Trümper ( counts s-1), we find that the luminosity reported by Predehl & Zinnecker has not been corrected for absorption. Many papers in the literature use the luminosity reported by Predehl & Zinnecker under the assumption that it is corrected for absorption. Consequently, the accretion models in these papers, which are based in part on fits to the luminosity reported by Predehl & Zinnecker, underestimate the upper-limits on the accretion rate and the X-ray luminosity of Sgr A∗ in 1992 by 1–2 orders of magnitude.
The first hard X-ray imaging (up to 10 keV) with modest spatial resolution (3′) was made in 1993 with ASCA (Koyama et al., 1996). ASCA detected diffuse thermal emission ( keV) with helium-like and hydrogen-like K emission lines of various elements covering the central 1 square degree of the Galactic Center. A elliptical region that fills the Sgr A East shell showed bright diffuse emission at a level 5 times that of the more extended emission. After correcting for a measured absorption of cm-2, the unabsorbed 2–10 keV luminosity of this gas was found to be ergs s-1. No subtraction was performed for the variable local background, consequently ASCA could only place an upper-limit of ergs s-1 on the X-ray luminosity of Sgr A∗.
Koyama et al. (1996) found a hard X-ray source located away from Sgr A∗. During their second observation made in 1994, Maeda et al. (1996) discovered an X-ray burst and eclipses with a period of 8.4 hr from the hard source, establishing that it is an eclipsing low-mass X-ray binary. Only one cataloged transient source, A 1742289 (Eyles et al., 1975), which appeared in 1975, positionally coincides within the error region. However, Kennea & Skinner (1996) reanalyzed Ariel V data taken in 1975 and found no eclipses from A 1742289. Hence the hard source was identified as a newly discovered low-mass X-ray binary and was named AX J1745.62901. Maeda et al. (1996) report that the absorbed flux from AX J1745.62901 varied from to ergs cm-2 s-1, which is similar to the range of variability of the X-ray flux from the Sgr A∗ region previously reported by the non-imaging instruments. These results indicate that the fluxes measured with the non-imaging instruments and attributed to Sgr A∗ may be contaminated significantly by AX J1745.62901 and possibly by A 1742289.
A BeppoSAX/MECS observation, with about 13 angular resolution on axis and an energy range similar to the ASCA/SIS, was performed in 1997, 4 years after the first ASCA observation (Sidoli et al., 1999). BeppoSAX detected the diffuse emission near Sgr A∗, measured the absorption column to be cm-2, and set a tighter upper limit on the 2–10 keV luminosity of Sgr A∗ of ergs s-1. No indication of a hard X-ray counterpart to the MBH at Sgr A∗ was found with ASCA or BeppoSAX.
3 Observations and Analysis
3.1 Data Acquisition and Reduction
Chandra (Weisskopf et al., 1996) observed the center of our Galaxy with ACIS-I, the imaging array of the Advanced CCD Imaging Spectrometer (G. P. Garmire, J. P. Nousek, & M. W. Bautz, in preparation), for 51.1 ks on 1999 September 21. All four CCDs (I0–3) in the imaging array (ACIS-I) and the central two CCDs (S2–3) in the spectroscopy array (ACIS-S) were used. The photo-sensitive region of each CCD is comprised of pixels, with each pixel subtending on the sky; hence, each CCD subtends on the sky. Detector S3 is a backside-illuminated CCD, while the other five are frontside-illuminated. The ACIS CCDs were clocked in timed-exposure (TE) mode using the standard integration time of 3.2 s per frame. The focal plane temperature was C. To prevent telemetry saturation, events with energies keV and events with ACIS flight grade 24, 66, 106, 214, or 512 were rejected on orbit.444See §6.3 of the Chandra Proposer’s Observatory Guide Rev. 2.0, hereafter the POG, for the definition of the ACIS flight grades and their correspondence with ASCA grades. The data were telemetered to the ground in very-faint (VF) mode; in this mode the telemetered data contains the pulse-height amplitudes (PHAs) of a -pixel island centered on each event.
During ground processing, we further rejected events with ASCA grade 1, 5, or 7 and events with certain ACIS flight grades located on CCD quadrant boundaries to minimize the quiescent instrumental background. Additional filtering was performed to exclude periods of time during which large background flares saturated telemetry, causing the majority of frames in these intervals to be lost. The total exposure time after filtering was 37.3 ks for S3 and 40.3 ks for each of the frontside-illuminated chips.
Analyses of on-orbit data by the Chandra X-ray Center (CXC) and others have shown that the frontside-illuminated CCDs occasionally exhibit “flaring pixels”. This phenomenon occurs when a cosmic ray deposits a large amount of charge in traps at the interface between the active region and the insulating layer of the gate structure.555A description of the “flaring-pixel” or “cosmic-ray afterglow” problem in the ACIS frontside-illuminated CCDs is available from the CXC at http://asc.harvard.edu/ciao/caveats/acis.html. The de-trapping time constant is longer than the integration time between frames, so events with identical grades are reported in the same pixel in up to 7 consecutive frames. These events can thus appear as false sources with counts. The CXC has developed an algorithm (acis_detect_afterglow) for removing flaring pixel events. However, the current algorithm removes a significant fraction of the events from real sources as well.666See the note from the ACIS Instrument Team posted at http://asc.harvard.edu/ciao/caveats/acis_cray.html. We have examined our source list (§3.2) and find that about 10% of the 158 sources have fewer than 8 counts, while 85% have at least 10 counts. Given the small number of potential flaring-pixel events, the expected number of flaring pixels that overlap with a real X-ray source within say 3″ is . The key results of this paper (i.e., the astrometry and the spectral analyses) are based on sources with counts, so these results will not be affected by flaring pixels. We have therefore chosen not to filter the data for flaring pixels at this time.
Early in the Chandra mission, the frontside-illuminated CCDs suffered radiation damage believed to be caused by low-energy protons scattering off the high-resolution mirror assembly (HRMA) during repeated passages through the Earth’s radiation belts (Prigozhin et al., 2000). This radiation introduced charge traps in the buried channels of the CCDs that increased their charge-transfer inefficiency (CTI). At the focal plane temperature of C, the integrated spectrum of the five frontside-illuminated CCDs cuts off rapidly below keV due to the increased CTI. In addition, the instrumental background begins to dominate the spectrum for energies –8 keV (e.g., Baganoff, 1999, and this paper). Therefore, the maximum signal-to-noise ratio for the integrated spectrum occurs in the energy range from about 0.5 to 7 keV.
No attempt was made to correct the observed flight event grades for grade migration caused by the increased CTI. Event amplitudes were computed using the PHAs from the central -pixels of each event. The event amplitudes were converted to energies using the routine acis_process_events with the standard gain file777acisD1999-09-16gainN0003.fits provided by the CXC for in-flight data taken at C. The acis_process_events routine is part of the Chandra Interactive Analysis of Observations (CIAO) software package developed by the CXC. Data reduction was performed using CIAO 1.1.3.
3.2 Source Detection and Astrometry
We ran wavdetect, the CIAO wavelet source detection routine (Dobrzycki et al., 1999; Freeman et al., 2001), on an image formed from events in the 0.5–7 keV band using kernel scales ranging from 1 to 16 pixels in multiples of ; each ACIS pixel is 05 on a side. The source significance threshold was set equal to ; since each ACIS CCD has about pixels, the expected number of false detections in all six CCDs is .
Wavdetect found 158 sources: 157 sources in I0–3, 1 source in S2, and 0 sources in S3. The deficiency of sources in S2 and S3 is attributable to a combination of the mirror vignetting, the enlarged point-spread function (PSF) far off-axis (), and the two-times higher background rate in S3 compared to the frontside-illuminated devices. A detailed study of the point sources in the field, including the – distribution, will be presented in another paper. Here we give just a few preliminary results. A histogram plot of the cumulative number of sources detected with greater than or equal to counts in the 0.5–7 keV band shows that our survey of X-ray sources is complete down to counts or counts s-1. To convert the 0.5–7 keV count rates to absorbed fluxes () and absorption-corrected luminosities () in the 2–10 keV band, we adopt an absorbed Crab-like spectrum with photon index and column density cm-2 (see §5.3.1).888All of the X-ray luminosities () presented in this paper are corrected for absorption, while the fluxes () are not corrected for absorption. The corresponding completeness limit is ergs cm-2 s-1. For sources at the distance of the Galactic Center, the corresponding luminosity is ergs s-1. Excluding the source in S2, the complete flux-limited sample contains 85 sources; hence, the mean X-ray source density of the complete flux-limited sample within the ACIS-I field of view (FOV) is sources arcmin-2, and the mean density of all the sources within the ACIS-I FOV is sources arcmin-2. Note that this preliminary analysis ignores the variations in the absorbing column and the off-axis PSF across the field. For comparison, the on-axis detection limit is ergs cm-2 s-1, and the corresponding luminosity is ergs s-1.
The CXC has measured the on-orbit performance of the Pointing Control and Aspect Determination (PCAD) system on Chandra (see §5.4 and Table 5.1 of the POG). Their analysis shows that standard CXC processing is capable of placing a reconstructed X-ray image on the celestial sphere to an accuracy of (RMS) radius. This corresponds to a projected distance of about 0.03 pc or 35 light-days at the Galactic Center. To improve on this, we used sources in the Tycho-2 optical astrometric catalog from the Hipparcos satellite (Høg et al., 2000) to register the Chandra field on the sky.
The center of our Galaxy is highly obscured (§2.1), so known optical sources in the field of view must be relatively near the Earth. The obscuring medium becomes partially transparent to X-rays from the Galactic Center at energies above about 2 keV. Therefore, we ran wavdetect on a 0.5–1.5 keV image to select foreground X-ray sources. This yielded a total of 72 foreground sources in the field of view: 71 sources in I0–3 and 1 source in S2.
To minimize any potential effects of the variable off-axis PSF on source centroids, we restricted the search to sources within 7′ of the telescope boresight. This region contains 7 Tycho-2 sources and 50 Chandra sources in the 0.5–1.5 keV band. We found 3 matches using a correlation radius of 2″ (see Table 1). The expected number of false matches is ; this quantity is equivalent to the cumulative probability of getting at least 1 false match. The probability of getting 3 matches out of 7 trials by random chance is . It is therefore highly likely that all 3 matches are real. The astrometric uncertainties listed in the Tycho-2 catalog for the positions and proper motions of the 3 reference stars range from 25–104 mas and 1.8–4.3 mas yr-1, respectively. The source offsets (Tycho-2 position Chandra position) shown in Figure 1 are all in close agreement, indicating that the celestial location of the boresight should be adjusted slightly east and north to align the Chandra field to the Hipparcos celestial coordinate system. The weighted mean offset of the reference sources is and . An independent check using 11 matching sources from the USNO-A2.0 catalog (Monet, 1998) is consistent with the Tycho-2 offset to within 040. This level of disagreement is consistent with the larger uncertainties in the USNO-A2.0 positions (), which were measured from optical plates, and the lack of correction for proper motion in the USNO-A2.0 positions.
We applied the weighted mean offset given above to register the Chandra field on the sky and to correct the celestial locations of all the X-ray sources. The registered boresight is located 158 east and 110 south of the radio position of Sgr A∗. The residual RMS scatter in the corrected X-ray positions of the Tycho-2 reference sources is 023; hence the astrometric uncertainty of the registered field is 013.
4 X-ray Images of the Galactic Center
We generated a raw, broad-band Chandra image of the center of our Galaxy by binning 0.5–7 keV counts from the event list into a two-dimensional image. The resulting image suffered from the effects of the mirror vignetting and the gaps between the CCDs. In addition, it was difficult to see low-surface-brightness extended emission. We developed a method for smoothing and flat-fielding the raw image to remove these effects. We describe our method here.
The mirror vignetting and the effective area curve for the combined HRMA/ACIS instrument are both energy dependent (see Figs. 4.3 and 6.9 of the POG). We split the broad 0.5–7 keV band into several narrower bands to minimize variation of the effective area across each band, while at the same time creating images with a reasonable number of counts in astrophysically interesting bands. Based on these criteria, we create narrow-band images in the 0.5–1.5, 1.5–3, 3–6, and 6–7 keV bands. We then use the CIAO routines mkinstmap and mkexpmap to create monochromatic exposure maps at 1, 2.4, 5, and 6.4 keV; these energies are selected because the effective area at each energy roughly approximates the mean effective area over the corresponding band, after allowing for the characteristically steep spectral shape of Galactic X-ray sources and the large column density toward the Galactic Center. The narrow-band images and the corresponding exposure maps are then binned using -pixel (i.e., ) bins to increase the chances of getting at least 1 count per bin within the chip-gap regions and to cut down on the computational time in subsequent steps.
Next we run the CIAO routine csmooth to adaptively smooth the broad-band image using minimum and maximum signal-to-noise thresholds of 3 and , respectively. The background level is computed locally. The csmooth routine is based on the method of Ebeling, White, & Rangarajan (2001). One of the outputs generated by csmooth is a scale map recording the size of the gaussian smoothing kernel used at each point in an image. This scale map is input back into csmooth as we smooth each narrow-band image and exposure map so that all images and maps are adaptively smoothed in exactly the same way.999The present version of csmooth fails to conserve flux precisely (M. Machacek 2000, private communication). While this problem does not significantly affect the results presented here, it will be addressed in our subsequent paper on the diffuse emission. After smoothing, we divide each image by its corresponding exposure map to produce a flat-fielded narrow-band image; these narrow-band images are then added together to produce a flat-fielded broad-band image.
In Figures 2–4, we present an exploded view of the center of our Galaxy made with Chandra/ACIS-I in the 0.5–7 keV band. These images have been adaptively smoothed and flat-fielded as described above. Remarkable structure in the X-ray emission from the Galactic Center is revealed for the first time with sufficient angular resolution to allow detailed comparisons with features seen in the radio and IR wavebands.
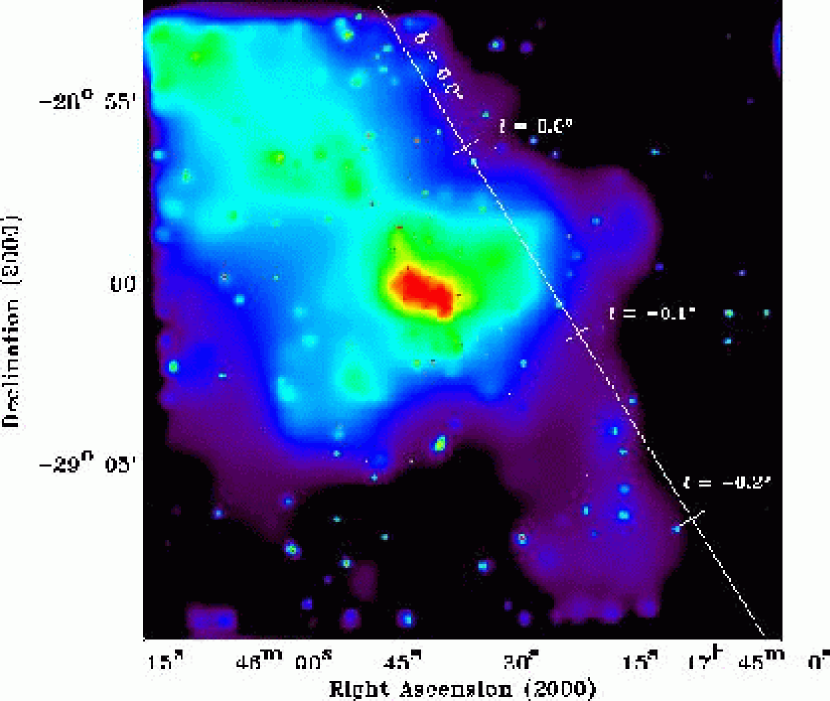
Figure 2 is a false-color image of the full ACIS-I field of view, covering the central 40 pc of the Galaxy. The Galactic plane is marked by a white line. Numerous point sources and bright, complex diffuse emission are readily visible. The diffuse X-ray emission is strongest in the center of Sgr A East (red region), a well-known, shell-like, nonthermal radio source. The origin of Sgr A East has been a topic of debate since its discovery. It has been interpreted by some as a supernova remnant (SNR; Jones, 1974; Ekers et al., 1983), but alternative origins have been proposed as well (e.g., Yusef-Zadeh & Morris, 1987; Mezger et al., 1989; Khokhlov & Melia, 1996). Our detailed study of the X-ray counterpart (Maeda et al., 2001) argues strongly that Sgr A East is a rare type of metal-rich, “mixed-morphology” (MM) supernova remnant that may have been produced about 10,000 years ago by the Type II explosion of a 13– progenitor. The X-ray emission from Sgr A East is concentrated in the central 2–3 pc within the pc radio shell and offset about 2 pc from Sgr A∗. The spectrum shows a thermal plasma ( keV) with strongly enhanced metal abundances and elemental stratification.
A curious linear feature long (yellow) extends (in projection) from the northeast toward the center of Sgr A East. Its appearance resembles that of a “plume” of emission sticking out the top of Sgr A East. The brightest part of the Sgr A “plume” (catalog ) is located at , (J2000.0). It is clearly present in raw narrow-band images in the 1.5–3 and 3–6 keV bands, but it is not visible in the 6–7 keV band. This is in contrast to the core X-ray emission from Sgr A East, which dominates the 6–7 keV band due to strong Fe-K line emission.
Sgr A East sits on a ridge of emission (green & blue) extending north and east parallel to the Galactic plane that was first seen by Einstein (Watson et al., 1981) and later observed by ROSAT (Predehl & Trümper, 1994), ASCA (Koyama et al., 1996), and BeppoSAX (Sidoli et al., 1999). This ridge is most sharply defined in the 3–6 keV band, with clumps of bright emission visible in the 6–7 keV band. Spectral analysis of the ASCA data by Koyama et al. indicated that this emission is from a thermal plasma with keV, but our preliminary analysis of the Chandra data suggests the emission is from a much cooler gas ( keV).
Emission (green & blue) extending perpendicular to the Galactic plane in both directions through the position of Sgr A∗ is clearly visible for the first time. This extended X-ray emission appears to correspond spatially with the so-called Sgr A “halo” in the radio band, but further study will be required to determine whether or not there is a detailed correlation. The emission is strong in the 1.5–6 keV band but absent at 6–7 keV. We note that a line drawn between the centers of the two brightest regions of this structure (see also Fig. 3) would run directly through the position of Sgr A∗; this may indicate the presence of some sort of hot, “bipolar” outflow from the vicinity of the MBH. In that case, the X-ray emitting plasma may be escaping preferentially along magnetic field lines, which, at the center of the Galaxy, run perpendicular to the Galactic plane to within about 20° (Morris & Yusef-Zadeh, 1985; Anantharamaiah et al., 1991; Morris & Serabyn, 1996; Lang, Morris, & Echevarria, 1999).
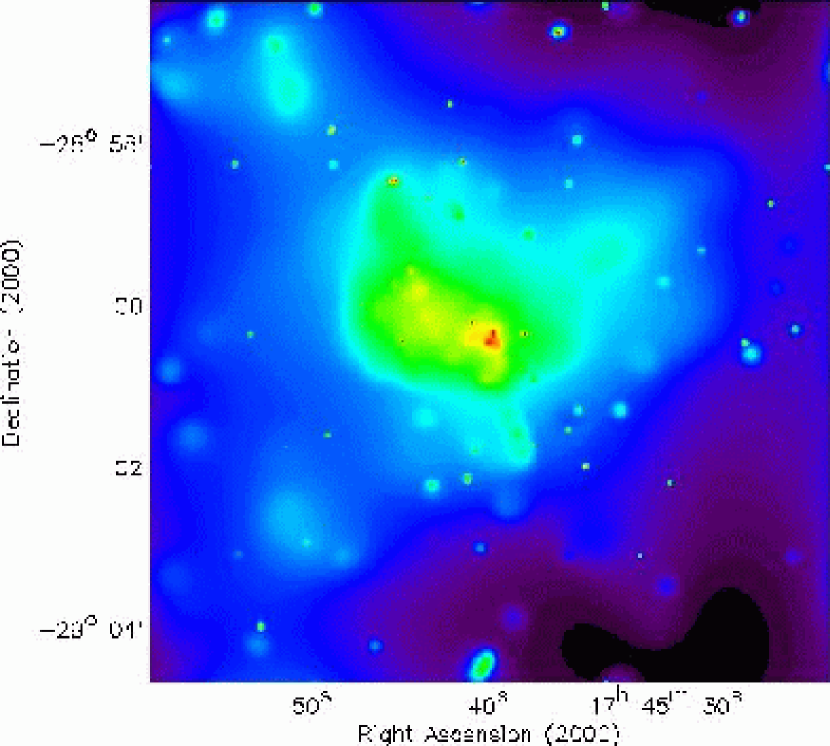
Figure 3 is an expanded view centered on Sgr A∗ of the inner of the field. This image was created using the procedure described above starting with -pixel bins. Complex structures can be seen in the X-ray emission from the vicinity of Sgr A East (yellow and green). The “plume” discussed above in Figure 3 is aligned with a string of clumps or knots (yellow) within Sgr A East, implying that this feature might in fact be physically related to Sgr A East rather than simply a chance superposition on the sky. X-ray emission that we associate with the compact, nonthermal radio source Sgr A∗ is just discernable in this panel as the southeastern component of the red structure at the center of the image. In addition, there is a clump of bright emission (yellow) centered pc east of Sgr A∗.
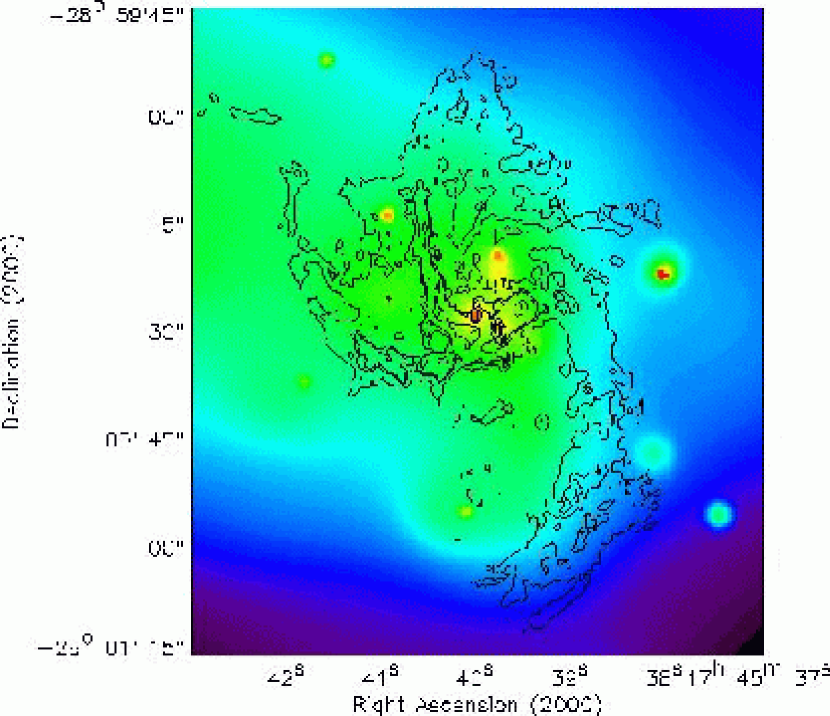
Figure 4 is a close-up around Sgr A∗ (red dot at , J2000.0) overlaid with VLA 6-cm contours of Sgr A∗ and Sgr A West (F. Yusef-Zadeh 1999, private communication). The image was created as described above starting with a full-resolution (i.e., -pixel binned) image. Sgr A West is an H II region seen in absorption against the nonthermal emission from Sgr A East; consequently, Sgr A West must lie in front of Sgr A East (Yusef-Zadeh & Morris, 1987; Pedlar et al., 1989). The absorption is not total, however, so Sgr A West may lie near the front edge of the Sgr A East shell. X-ray emission coincident with IRS 13 (catalog ) (yellow) is evident just southwest of Sgr A∗.
The western boundary of the brightest diffuse X-ray emission (green) coincides precisely with the shape of the Western Arc of the thermal radio source Sgr A West. On the eastern side, the emission continues smoothly into the heart of Sgr A East (see red region in Fig. 2). In addition, the indentation seen in the X-ray intensity southeast of Sgr A∗ coincides with a molecular emission peak in the circumnuclear disk (CND; Wright et al., 1987; Marr, Wright, & Backer, 1993; Yusef-Zadeh, Melia, & Wardle, 2000; Wright et al., 2001). Since the Western Arc is believed to be the ionized inner edge of the CND, the morphological similarities between the X-ray and the radio structures strongly suggest that the brightest X-ray-emitting plasma is being confined by the western side of the CND. This may be evidence that Sgr A West and Sgr A∗ physically lie within the hot cavity inside the Sgr A East shell. We discuss this possibility further in our companion paper on the X-ray emission from Sgr A East (Maeda et al., 2001). The alternative possibility, that Sgr A East and West occupy physically separate regions of space, requires a chance alignment of the CND along our line of sight to the western edge of Sgr A East. The morphological similarities would then be simply the result of obscuration by the molecular gas and dust in the CND.
We are using the narrow-band images described above to study the distribution of hard and soft point sources in the field and to study the morphology of the bright Fe K-line emission first observed by Ginga (Koyama et al., 1989). These results will be presented elsewhere.
5 X-ray Emission from the Position of Sgr A∗
5.1 Position
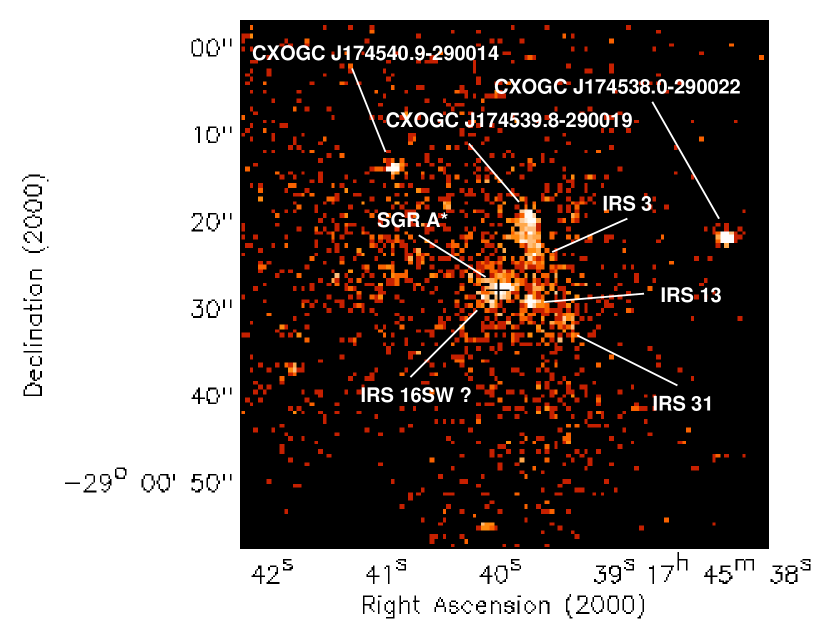
Figure 5 shows a field that is centered on the position of Sgr A∗ and is made from the counts in the 0.5–7 keV band. This image has not been smoothed or flat-fielded. The black cross marks the radio interferometric position of Sgr A∗ as determined by Yusef-Zadeh, Choate, & Cotton (1999). Clearly visible at the center of the image is the X-ray source, CXOGC J174540.0290027 (catalog ), that we associate with Sgr A∗ based on the extremely close positional coincidence. The wavdetect centroid position of CXOGC J174540.0290027 (catalog ) is offset 035 from the radio position of Sgr A∗, corresponding to a maximum projected distance of 16 light-days (see Table 2). The uncertainty in the position of CXOGC J174540.0290027 (catalog ) is 026; we computed the uncertainty by combining the statistical uncertainty from centroiding (011) with the residual RMS scatter (023) in the X-ray positions of the Tycho-2 reference sources (§3.2). Thus, the significance of the offset is . Half of this offset (026) is attributable to the uncertainties in centroiding and astrometry. The remaining offset may be due either to our underestimation of the astrometric errors or to a complex morphology of the source on a sub-arcsecond scale (§5.2).
We estimate the probability of detecting, by random chance, an absorbed source that is as bright or brighter than CXOGC J174540.0290027 (catalog ) and that is coincident with Sgr A∗ within 035 as follows. As we reported in §3.2, we have detected 157 sources in the 0.5–7 keV band and 71 sources in the 0.5–1.5 keV band within the ACIS-I field of view. Selecting only those sources that lie within a radius of 8′ of Sgr A∗ leaves us with 143 sources in the 0.5–7 keV band and 62 sources in the 0.5–1.5 keV band, with 24 matches between the two source lists using a correlation radius of 2″. After removing the foreground sources, the resultant 0.5–7 keV source list contains 119 absorbed sources that lie within 8′ of Sgr A∗. Of these 119 sources, only CXOGC J174540.0290027 (catalog ) was brighter than CXOGC J174540.0290027 (catalog ) during the observation.
To determine the radial distribution of the sources on the sky, we count up the number of sources in concentric annuli centered on Sgr A∗, using 1′-wide annuli, and fit the distribution with a power-law model. The best-fit radial surface density profile is given by the equation sources per square arcminute, where is the offset angle from Sgr A∗ in arcminutes. Integrating the profile from 0″ to 035 and multiplying by 2/119, we find that the probability of detecting, by random chance, an absorbed X-ray source that is as bright or brighter than CXOGC J174540.0290027 (catalog ) and that is coincident with Sgr A∗ within 035 is . We note, however, that the radial profile given above overpredicts the density of sources at small radii, because the source detection efficiency of the combined HRMA/ACIS instrument drops off with increasing off-axis angle due to the combined effects of the increasing PSF size and the decreasing effective area. The integration requires an extrapolation of over an order of magnitude toward smaller radii, so even a small flattening of the slope would cause a significant decrease in the predicted number of sources in the central arcsecond. The probability given above should thus be considered an upper limit to the true probability. We will address these problems in our subsequent paper on the point sources.
5.2 Morphology
Spatial analysis of the morphology of the source coincident with Sgr A∗ and of two nearby point sources (CXOGC J174538.0290022 (catalog ) and CXOGC J174540.9290014 (catalog )) indicates that Sgr A∗ may be slightly extended (see Fig. 5). A two-dimensional Gaussian fit to Sgr A∗ yields full-widths at half maximum (FWHM) of 16 (E-W) and 13 (N-S), whereas the FWHM of the on-axis HRMA point-spread function (PSF) is . The widths of the other two sources are narrower (11 and 09 [E-W], 10 and 09 [N-S]), but they are still broader than the PSF by about a factor of two. The enlarged widths are attributed to three factors: (1) a minor problem with the aspect solution (see below); (2) the 0.5-pixel randomization introduced into the event positions by the CXC standard processing pipeline but not included in the PSF size calculation, and (3) the fact that the HRMA PSF more closely resembles a Lorentzian than a Gaussian.
Examination of the aspect solution file shows three discontinuities in the curves recording the position of the science instrument module (SIM) translation stage during the course of the observation. The CXC has determined that this problem is caused by warm pixels in the aspect camera that sometimes fall near one of the fiducial lights used to monitor SIM drift. The amplitudes of the discontinuities are along the Z-axis of the SIM and along the Y-axis. The spacecraft roll angle was 2685, so the Z- and Y-axes were aligned nearly E-W and N-S, respectively. These discontinuities broadened the widths of all the source profiles, but the effect on the source centroids used to determine positions on the sky should not be a problem since all sources experienced the same pattern. The fact that the two comparison sources have narrower profiles than Sgr A∗ indicates that the aspect errors cannot account entirely for its apparent extent. A proper study of the spatial morphology of Sgr A∗ will require careful analysis of the Cycle 1 data, after reprocessing to correct for the aspect problem. We will address this in a subsequent paper in combination with our analysis of our Cycle 2 data.
Assuming the excess extent of Sgr A∗ is real, we can obtain a rough estimate of its size by subtracting in quadrature the mean diameter of the two comparison sources from the mean diameter of Sgr A∗; we find that the apparent intrinsic size of Sgr A∗ is or 0.04 pc. Structure in Sgr A∗ on this scale is consistent with the expected Bondi accretion radius (1–2″ Bondi, 1952) for matter accreting hydrodynamically onto the MBH from either the stellar winds of the nearby cluster of massive stars (§11.1.2) or the hot diffuse plasma that we observe surrounding Sgr A∗ (§11.3).
5.3 Spectroscopy
5.3.1 Continuum
The increased CTI in the frontside-illuminated CCDs has caused the energy scale to become position dependent. To correct for this, the CXC divided each CCD into -pixel subregions and analyzed calibration data from the on-board external calibration source to calibrate the energy scale in each subregion. The gain function for each subregion is stored in a FITS embedded function (FEF) file.
We use the CIAO tool mkrmf with an FEF file101010acis3d_x00_y29_FP110_D1999-09-16fef_phaN0002.fits provided by the CXC to create a spectral response matrix for analysis of the Sgr A∗ spectrum. An auxiliary response file describing the energy-dependent effective area of the combined HRMA/ACIS instrument at the location of Sgr A∗ on the I3 detector is created using the CIAO tool mkarf with the ACIS quantum efficiency (QE) file provided by the CXC.111111acisD1997-04-17qeN0002.fits
A total of 258 counts are extracted in the 0.5–9 keV band from a 15-radius circle centered on the position of the X-ray source coincident with Sgr A∗. This aperture is small enough to minimize contamination from several nearby sources (see Fig. 5) yet large enough that the percentage encircled energy from a point source at the center of the aperture is % at all energies. A local background spectrum with 1317 counts is extracted from a 10″-radius circle centered on Sgr A∗ (see §7); to avoid contaminating the background spectrum with counts from the point sources in the region, we exclude counts within a 15 radius of Sgr A∗ or any of the other six point sources in the extraction region (see §6). After background subtraction, the net counts received from Sgr A∗ in 40.3 ks are counts. The source is detected with high significance, , despite the highly elevated diffuse X-ray background in the central parsec of the Galaxy (see §7).
We fit the source spectrum in XSPEC with an absorbed power-law model (see Table 3). The best-fit model () has photon index ( photons cm-2 s-1 keV-1) and column density cm-2.121212Except where specified otherwise, the uncertainties given in this paper are for the 90% confidence interval: for one interesting parameter. The source spectrum and the best-fit absorbed power-law model are shown in Figure 6. The spectrum is binned to yield a minimum of 10 counts per channel; this restricts the energy band of the binned spectrum to the range 0.5 to about 7 keV.
We also fit the source spectrum with an absorbed optically thin thermal plasma model (see Table 3). The optically thin thermal plasma code that we use was developed by Raymond & Smith (1977). Twice solar abundances are assumed in the Raymond-Smith model here and throughout this paper (see Morris, 1993, and references therein). The best-fit model () has keV and cm-2. The source spectrum and the best-fit absorbed Raymond-Smith model are shown in Figure 7.
Both models are consistent with the data due to the low number of counts. Using the power-law model, the measured (absorbed) flux in the 2–10 keV band is ergs cm-2 s-1, and the absorption-corrected luminosity is ergs s-1. The thermal plasma model gives similar numbers. Due to the large uncertainties in the photon index and the column density, the 2–10 keV luminosity is known only to within a factor of two, and the extrapolated 0.5–10 keV luminosity ( ergs s-1) is uncertain by more than an order of magnitude. The confidence limits given for the flux and luminosity of Sgr A∗ are derived by computing the 90% confidence region ( for two interesting parameters) for the column density versus the photon index parameters of the absorbed power-law model with the normalization parameter of the power law free to vary. The column density and photon index are then fixed at the extremum values of the 90% confidence contour, the spectrum is fit to determine the corresponding best-fit normalization value, and the flux and luminosity of the model are computed.
Next, we fit the absorbed power-law model to the 0.5–7 keV spectrum using a range of fixed column densities [ cm-2]. As expected the best-fit photon index becomes flatter as the column density is decreased. The best-fit photon index is about 1.5 when the column density is fixed at the canonical Galactic Center value cm-2 (). However, a column density this low is only marginally consistent with the data at the 99% confidence level.
We also fit the absorbed power-law model to the spectrum using only the 2–7 keV and 3–7 keV ranges to minimize the effect of the column density on the fit, but we find the resulting best-fit parameters are highly dependent on the choice of initial parameter values; the best-fit parameter values to the 0.5–7 keV spectrum, on the other hand, are robust. For the remainder of this paper, we use the best-fit parameters derived from fits to the 0.5–7 keV spectrum (see Table 3).
The measured spectrum suffers from two known systematic effects. First, the percentage encircled energy focussed by the HRMA within the 15-radius extraction circle is energy dependent, varying from at 1.5 keV to at 8.6 keV. Second, charge is lost as events are clocked out of detector I3 due to the increased CTI. This causes an energy-dependent decrease in the number of detected events. From measurements made with the external calibration source at C, it is known that % of events at 1.5 keV and at 5.9 keV are lost. Hence both effects work together to lower and to steepen the spectrum systematically. Given the numbers above, we estimate that the measured luminosity should be increased by % and the photon index should be decreased (i.e., flattened) by –. These corrections are negligible compared to the uncertainties in the model parameters due to the small number of counts in the current data.
5.3.2 Fe K Line
Excess counts might be present in the 6–7 keV region of the Sgr A∗ spectrum (see Fig. 6). We test for the presence of K line emission from Fe XXV by fitting the observed spectrum with an absorbed power-law plus gaussian-line model. Because of the poor statistics, we fix the line energy and width at 6.67 keV and 0.0 keV, respectively. The best-fit values for the remaining free parameters are cm-2, , photons cm-2 s-1 keV-1 at 1 keV, and photons cm-2 s-1 (). Here and are the normalization parameters for the power-law and the Fe-line components of the model. The best-fit equivalent width of the potential line is 1.8 keV. For comparison, the equivalent widths of the iron lines in the spectra of Sgr A East and the local diffuse emission within 10″ of Sgr A∗ are 3.1 keV (Maeda et al., 2001) and 1.3 keV (see §7 and Fig. 10), respectively.
We compute an -statistic, , to test the significance of the additional term in the model. Here is the reduced chi-square for the model with a line. The probability of observing for and degrees of freedom is 2.1%, indicating that the significance of the improvement to the fit from the additional term is equivalent to for a Gaussian process. Given that , it is worth examining the significance of the additional component if we set . In that case, the probability of observing is 4.6% or .
An alternative possibility is that the excess counts in the Sgr A∗ spectrum result from inadequate subtraction of the iron line in the spectrum of the local diffuse background. However, the background contributed only 36 of the 258 counts (14%) in the 15-radius aperture used to extract the Sgr A∗ spectrum. Furthermore, the background-subtracted spectrum of the integrated emission from the six point sources within 10″ of Sgr A∗ shows no sign of excess counts in the 6–7 keV range (see §6 and Figure 9). Thus, while poor counting statistics prevent a definitive conclusion, it seems likely that an iron emission line (or line complex) may be present in the Sgr A∗ spectrum.
5.4 Variability
We examined the short-timescale temporal behavior of the Sgr A∗ X-ray source by constructing 0.5–7 keV light curves extracted from circular regions of 15 and 05 radius. The larger extraction region has 242 events, but it includes photons from an extended region (§5.2) which may not vary rapidly. The smaller extraction region has only 67 events, but these may arise from a compact region around the MBH. We also examined similarly extracted events from two unresolved sources within of Sgr A∗ (see Fig. 5). The resulting light curves of Sgr A∗ and a comparison light curve of the strongest unresolved source, CXOGC J174538.0290022 (catalog ), with 129 events within a 05-radius aperture, are shown in Figure 8. CXOGC J174538.0290022 (catalog ) has an absorbed spectrum and has no infrared counterpart in SIMBAD; thus it may be an accreting X-ray binary. The background flux from the diffuse emission contributes 14% and 6% to the Sgr A∗ light curves from the 15 and 05 regions, respectively.
The light curve from Sgr A∗ shows a possible flare-like event during the first hour of observation. To evaluate the statistical significance of the event, we calculate the nonparametric Kolmogorov-Smirnov statistic to test the hypothesis that the source is constant. The probability of constancy for the Sgr A∗ X-ray flux is for the 15 extraction circle and for the 05 extraction circle. The latter value is equivalent to a event for a Gaussian process. For comparison, the probability of constancy for the control source CXOGC J174538.0290022 (catalog ) in the 05 extraction circle is as high as , indicating no significant variability. The other control source CXOGC J174540.9290014 (catalog ) has a probability of constancy in the 05 extraction circle of , which is again consistent with no significant variability. Only Sgr A∗ shows the possibility of variability above the equivalent level in the 05 extraction circle.
We thus find highly suggestive, but inconclusive, evidence of rapid X-ray variability from a compact component within the Sgr A∗ source. The peak luminosity of the putative flare is ergs s-1. Additional data are needed to establish whether or not the variability is real. The search for rapid X-ray variability of Sgr A∗ is of crucial importance, since it has the potential to provide a powerful discriminator between MBH and stellar origins for the X-ray source and between the various proposed MBH accretion-flow emission processes for Sgr A∗.
6 Integrated Point Source Emission in the Central Parsec
Figure 9 shows the spectrum of the integrated X-ray emission from the 6 point sources observed within 10″ of Sgr A∗ (see §5.3.1 and Fig. 5). The solid line in the upper panel of Figure 9 is the best-fit absorbed power-law model (). The parameters of the model are listed in Table 3, along with the integrated flux and luminosity. The net count rate from the six sources is counts s-1 (0.5–7 keV). These sources are discussed further in §8.
The spectrum shows no obvious signs of emission lines. To quantify this statement, we fit the spectrum with an absorbed Raymond-Smith model. The best-fit column density is implausibly high ( cm-2) when the elemental abundances are fixed at twice the solar abundances (). When the metallicity is allowed to vary, the best-fit column density is reasonable ( cm-2), but the abundances are set to zero by the fitting engine ().
7 Diffuse X-ray Emission in the Central Parsec
As discussed in §4, the entire Sgr A complex — comprised of Sgr A East, Sgr A West, and Sgr A∗— sits on a ridge of X-ray emission extending north and east parallel to the Galactic plane (see Fig. 2). To study the spectrum of the diffuse emission within 10″ of Sgr A∗ (hereafter the local diffuse emission), it is necessary to first subtract off this underlying background. The structure of the emission along the Galactic plane is complex, making it difficult to determine a proper estimate of the background near Sgr A∗. We selected a region about 42″ north of Sgr A∗ that lies outside the intense X-ray emission from the Sgr A complex and yet within the extended radio structure known as the Sgr A “halo”, where the X-ray surface brightness is relatively flat. We extracted a spectrum with 544 total counts from a circular region 15″ in radius centered at , (J2000.0). This extraction circle lies entirely on the I3 detector, as does the extraction circle for the local diffuse emission. The total count rate in the 0.5–7 keV band from this region of the Galactic plane emission is counts s-1 arcsec-2.
Next we analyzed the spectrum of the local diffuse emission, using the Galactic plane spectrum for the background. Figure 10 shows the background-subtracted spectrum. An emission line from highly ionized iron is clearly visible at 6.7 keV, indicating that most of the emission comes from a hot optically thin thermal plasma. We therefore fit the spectrum with an absorbed Raymond-Smith model. The best-fit model is indicated by the solid line in the upper panel of Figure 10, and the best-fit parameters are listed in Table 3. The 2–10 keV flux and luminosity of the local diffuse emission are ergs cm-2 s-1 arcsec-2 and ergs s-1 arcsec-2; the net count rate is counts s-1 arcsec-2 (0.5–7 keV). The equivalent width of the iron line is keV.
Based on the parameters of the best-fit model, we estimate that the local, hot diffuse plasma has an RMS electron density cm-3 and emission measure cm-6 pc. Here we have assumed the plasma has unity filling factor and is fully ionized with twice solar abundances (mean atomic weight ). The total mass of this gas is .
The local plasma around Sgr A∗ appears to be somewhat cooler ( keV) than the plasma we analyzed in our companion study of Sgr A East (Maeda et al., 2001). Using the MEKA thermal plasma model developed by Mewe, Gronenschild, & van den Oord (1985) and Kaastra (1992), Maeda et al. find the Sgr A East plasma to have keV. The column densities derived from the fits to both plasmas are consistent at cm-2. We allowed the elemental abundances to vary when fitting the high signal-to-noise spectrum of Sgr A East. The best-fit model indicates that the Sgr A East plasma has about 4 times solar abundances. Fitting the local emission near Sgr A∗ with the abundances fixed at four times the solar value did not significantly change the best-fit temperature. The difference in temperature between the two plasmas therefore appears real.
In addition, Maeda et al. find that the net count rate within a 40″-radius circle centered on Sgr A East at the position , (J2000.0) is counts s-1 arcsec-2. Thus, the net count rate from the local diffuse emission is 3.3 times the net count rate within Sgr A East and 6.3 times the total count rate in the background region along the Galactic plane. This shows that the diffuse X-ray emission from the Sgr A complex is significantly peaked around Sgr A∗.
It is likely that some fraction of the local diffuse emission is contributed by the stars in the central parsec cluster. Genzel et al. (1996) estimate that the core radius of the cluster is pc (10″) with a stellar mass density in the core of pc-3. The 2–10 keV luminosity of ergs s-1 could arise from the ordinary OB and Wolf-Rayet (WR) stars present in the cluster. This level of emission is an order of magnitude higher than seen in young stellar clusters like the Orion Trapezium or W3 but is comparable to that seen from the R136a cluster and associated WR stars in 30 Doradus (Feigelson, 2001).
Throughout this paper we have neglected the instrumental background in our analysis for two reasons. First, Koyama et al. (1989) observed the center of our Galaxy with Ginga and found K transition lines from highly ionized ions of iron extending over the central 100 pc. They also found diffuse continuum emission on this scale. They interpret both emission features as coming from an optically thin keV plasma. This diffuse X-ray emission extends far beyond the ACIS-I field of view; thus we cannot measure the instrumental background spectrum directly from our data. Second, the expected count rate from the instrumental background is negligible compared to the contributions from the bright diffuse emission in the field, as we now show.
The non-X-ray background rate measured by the CXC in Chandra/ACIS observations of high Galactic-latitude fields is counts s-1 arcsec-2 in the 0.5–7 keV band (see §6.10 of the POG). For comparison, the average count rate in ACIS detector S2 within a 2′-radius circle centered at , (J2000.0) is counts s-1 arcsec-2. This region is devoid of strong point sources in the data and is located 15′ off axis, where the effective area at 2.4 keV is only about 75% of the on-axis value; it thus provides us with a useful upper-limit to the instrumental background rate in the four ACIS-I CCDs during the observation. The expected non-X-ray background rate is seen to be about half the observed background rate in detector S2. The excess count rate may be attributed to the diffuse X-ray emission from hot gas along the line of sight through the center of our Galaxy. Referring back to the count rate from the local diffuse emission given above, it can be seen that the instrumental background contributes only of the background counts in the vicinity of Sgr A∗; it is therefore negligible for our purposes in this paper.
8 Stellar Counterparts to Detected X-ray Sources and Source Confusion in the Central Parsec
In addition to detecting X-rays from a source coincident with Sgr A∗ within 16 light days for the first time, we have resolved the diffuse X-ray emission from Sgr A East and along the Galactic plane and detected over 150 point sources in the ACIS-I field of view. For comparison, the ROSAT/PSPC detected 14 sources in a field around the Galactic Center in an observation of equal duration (Predehl & Trümper, 1994). The Einstein/IPC, with a harder energy band than ROSAT, but less effective area, detected 12 sources in about 20 ks in a field (Watson et al., 1981).
As discussed in §6 and §7, several point-like X-ray sources lie within 10″ of Sgr A∗ (see Fig. 5 and Table 3), and the diffuse emission is also quite prominent ([2–10 keV] ergs cm-2 s-1 arcsec-2). Our ACIS observation shows that on 1999 September 21, Sgr A∗ contributed only 12% of the 2–10 keV flux within this region of the sky. All of the emission from this region would have been unresolved by the ROSAT/PSPC, which had a spatial resolution of 10–20″ (FWHM). Most of it will fall within the XMM-Newton beam [6″ (FWHM), 15″ (HPD)].
The source to the southwest of Sgr A∗ matches the radio position of IRS 13 (catalog ) to within . IRS 13 (catalog ) is known to consist of a complex of stars and a diffuse source from a strong shock at the edge of the “mini-cavity” seen in radio and mid-IR images. Paumard et al. (2001) have taken a high-resolution IR spectrum at 2.06 µm which shows that IRS 13E3 (catalog ) is a He I emission-line star with a broad P Cygni line profile. They propose that IRS 13E3 (catalog ) is one of a group of stars in the central parsec cluster that are in the WR stage. There is also a hint of excess counts from the vicinity of IRS 16SW (catalog ) (see Fig. 5), although no source was found there by wavdetect, perhaps due to its faintness and proximity to the brighter X-ray source located at the position of Sgr A∗. Ott, Eckart, & Genzel (1999) claim that IRS 16SW (catalog ) is probably an eclipsing He-star binary, raising the possibility that we may be seeing X-rays from their colliding stellar winds. Emission at levels of order ergs s-1 in the 2–10 keV band is well established in WR stars (e.g., HD 193793, Koyama et al. 1990, 1994; V444 Cyg, Maeda et al. 1999), where the hard component is attributed to colliding winds in a close binary system.
We have not detected other members of the IRS 16 (catalog ) cluster, which is known to contain a number of He I emission-line stars. Paumard et al. (2001) find that IRS 16NE (catalog ), IRS 16C (catalog ), IRS 16SW (catalog ), and IRS 16NW (catalog ) are He stars with narrow P Cygni line profiles and propose that they are in or near the luminous blue variable (LBV) phase. Such stars have substantially weaker hard X-ray emission than colliding-wind WR binaries.
The apparently diffuse emission located about 7″ northwest of Sgr A∗ in Figure 5 does not correspond with any excess of radio emission in a VLA 6-cm map of the region made by F. Yusef-Zadeh (1999, private communication, see Fig. 4); on the contrary, there seems to be an absence of radio emission at this location in the radio map. The same is true in the mid-IR (M. Morris, in preparation). We attribute this structure to emission from a group of 3 or more point sources located along a line running approximately north-south and covering a distance of about 7″. The brightest source stands out in Figure 4 as the red dot at the northern end of the structure.
The stellar identifications shown in Figure 5 are tentative; they are based solely on positional coincidence at this time. The X-ray sources marked IRS 3 (catalog ) and IRS 13 (catalog ) match the coordinates listed in SIMBAD to within 1″, while IRS 31 (catalog ) coincides only within 2″, so this latter match is not compelling. The multiple IR source IRS 15 (catalog ) is the nearest known source to the X-ray source CXOGC J174539.8290019 (catalog ), though it is displaced by 2–3″, so it is an unlikely counterpart (IRS 15SW is a He star with a broad-line profile, Paumard et al., 2001). Interestingly, no matching IR source was found within 3″ of CXOGC J174538.0290022 (catalog ), despite the fact that it is the second brightest X-ray source in the entire field and the brightest absorbed source. Likewise, no match was found within 3″ of CXOGC J174540.9290014 (catalog ). These two sources are therefore likely candidates for X-ray binaries.
9 A Limit on the Long-term X-ray Variability of Sgr A∗
The center of our Galaxy has been observed by a series of X-ray satellites over the past twenty years (§2.2). Prior to Chandra, the highest angular resolution observations were made by the PSPC and the HRI instruments on ROSAT (Predehl & Trümper, 1994; Predehl & Zinnecker, 1996). The HRI did not detect a source at the position of Sgr A∗ in a 27 ks observation. The PSPC detected a source, RX J1745.62900, in March 1992 that was coincident with Sgr A∗ within 10″. The 0.8–2.5 keV luminosity of the source was ergs s-1. Hard X-ray (2–30 keV) observations made with non-imaging instruments in the late 1980’s and early 1990’s, especially the ART-P telescope on Granat, showed a long-term variable source in the vicinity of Sgr A∗ with 2–10 keV luminosity ranging from (2– ergs s-1 (Skinner et al., 1987; Kawai et al., 1988; Pavlinsky, Grebenev, & Sunyaev, 1994, but see Maeda et al. 1996 for an alternative explanation). BeppoSAX observed the Sgr A complex in August 1997 and placed an upper limit on the 2–10 keV luminosity of Sgr A∗ of ergs s-1 (Sidoli et al., 1999). Taken together, these observations suggest that Sgr A∗ might be a variable X-ray source (by a factor of 10 or more) and that it might have been as luminous as a few ergs s-1 within the past 15 years. Alternatively, given the source confusion described in §8, it is possible that Sgr A∗ was not detected by these X-ray satellites because it was too faint.
It would be difficult to compare properly the count rate from Sgr A∗ measured with Chandra/ACIS-I in September 1999 with the count rates measured by the previous instruments with angular resolutions of order 1′ or larger, since this would require estimating the count rates of many potentially variable point sources in the field. The relatively high spatial resolution of the ROSAT/PSPC, on the other hand, makes such a comparison reasonably straightforward. Furthermore, the ROSAT observation occurred within half a year of the fourth of a series of semi-annual ART-P observations in 1990–91 that detected a source in the vicinity of Sgr A∗ with a persistent hard X-ray luminosity of ergs s-1 and variability by about a factor of two on a half-year timescale (see Table 1 in Predehl & Trümper, 1994). To simultaneously reproduce the low-energy spectrum measured with the PSPC and the higher energy spectrum measured with the ART-P, Predehl & Trümper find the absorption column to the source has to be – cm-2. This assumed column density is consistent, within the uncertainties, with the column density measured by ACIS. The PSPC observation may thus allow an indirect comparison to the ART-P observations as well.
Adopting an absorption column of cm-2, we re-fit in XSPEC the spectra of the three emission components listed in Table 3 and used the best-fit models with the response matrix pspcb_gain2_256.rsp to compute the predicted PSPC count rate for each component in the 0.8–2.5 keV band. To convert the surface brightness of the local diffuse emission into an expected count rate, we assumed the source counts were extracted from a circular region of radius 20″; for comparison, the 50% encircled energy radius of the PSPC was about 15–20″. The predicted PSPC count rates are counts s-1 for Sgr A∗, counts s-1 for the summed point sources, and counts s-1 for the local diffuse emission. Summing these contributions, we find the total predicted PSPC count rate in September 1999 would be counts s-1. The actual PSPC count rate observed in March 1992 was counts s-1 (Predehl & Trümper, 1994), consistent with the ACIS-based prediction.
Assuming the flux of the point sources and the local diffuse emission remained constant between the two epochs, we find that the upper-limit on the count rate of Sgr A∗ in March 1992 is counts s-1. Taking into account the factor of two uncertainty in the 2–10 keV luminosity of Sgr A∗ measured by Chandra, the corresponding upper-limit on the luminosity of Sgr A∗ in 1992 is – ergs s-1. The 2–10 keV luminosity measured with ART-P in autumn of 1991 was ergs s-1, which is still a factor of 4–8 times higher than the upper limit in 1992. Based on this analysis and the factor of two variability seen by ART-P over a 2-year period, it would appear that the PSPC should have seen at least an order of magnitude higher count rate if Sgr A∗ were as luminous as ergs s-1 in the ART-P energy band in late 1991. This suggests that one of the other point sources within the ART-P beam may have been responsible for the observed variation in luminosity. A likely candidate for the contaminating source is AX J1745.62901, a low-mass X-ray binary discovered with ASCA by Maeda et al. (1996).
While we cannot exclude the possibility that Sgr A∗ was as luminous as ergs s-1 during the past 15 years, all previous data are consistent with the much lower luminosity of ergs s-1 that we measured in 1999 with Chandra/ACIS-I.
10 Origin of the X-rays Coincident with Sgr A∗: MBH or Stellar?
The MBH at Sgr A∗ is embedded in a rich and massive cluster of very luminous stars. Sixteen early-type, He I/H I emission-line stars with strong winds have been spectroscopically identified within a radius of around Sgr A∗ (Krabbe et al., 1995; Najarro et al., 1997; Paumard et al., 2001). Such stars are thought to be close cousins to stars in the LBV phase and the WR stage, although their nature is not completely determined. As WR stars are significant X-ray emitters, especially those in close binaries with other WR or O stars, one must consider whether the emission we see at Sgr A∗ arises from MBH or stellar processes. For instance, Ozernoy, Genzel, & Usov (1997) predict that variable X-ray emission with ergs s-1 should be present in the Galactic Center cluster due to colliding stellar winds.
We consider the X-ray properties described in §5. The position of CXOGC J174540.0290027 (catalog ) is consistent with the radio position of Sgr A∗ at the level, where the positional uncertainty is 026. In addition, the source has an apparent diameter of . The stellar cluster is a composite structure with a dense compact component 5″ in diameter lying within a larger 20″-diameter component (Eckart, Ott, & Genzel, 1999; Paumard et al., 2001), but the compact component (the IRS 16 (catalog ) complex) is centered 2″ east of Sgr A∗ and of our X-ray source.
The He I emission-line stars nearest to Sgr A∗ (in projection) are IRS 16C (catalog ), IRS 16NW (catalog ), and IRS 16SW (catalog ). As noted in §8, an excess of counts appears around the position of IRS 16SW (catalog ), but no X-ray sources are visible in the current data at the positions of IRS 16C (catalog ) and IRS 16NW (catalog ). Importantly, no bright He I emission-line star lies closer than 12 to Sgr A∗ (Krabbe et al., 1995; Paumard et al., 2001), which is strong evidence against CXOGC J174540.0290027 (catalog ) being emission from a He I star.
The X-ray emission from single OB and WR stars is typically quite soft, with keV, and consequently cannot be observed at the Galactic Center due to the obscuration. Close binary WR+WR and WR+O systems, in which the X-rays arise from colliding winds, can show harder spectra with –3 keV and ergs s-1 in the 2–10 keV band (e.g., Corcoran, 1996; Maeda et al., 1999). The spectral and luminosity characteristics for the more extreme WR binaries are roughly consistent with those of the source coincident with Sgr A∗.
The variability tentatively reported in §5.4, if confirmed, is not consistent with the behavior of WR binaries. Variations associated with binary phase are typically seen on timescales of days to years (e.g., Williams et al., 1990). Variations on timescales of hour with amplitudes of ergs s-1, as might have been seen in Sgr A∗, are unprecedented among colliding wind binaries. A firm detection of such rapid variability would provide additional strong evidence against a WR star origin for the emission from CXOGC J174540.0290027 (catalog ).
The colliding winds model for X-ray emission (Ozernoy, Genzel, & Usov, 1997) requires that, in order to reproduce the X-ray luminosity of CXOGC J174540.0290027 (catalog ), the stars must be much closer to each other (a few cm) than the typical separation of the He I emission line stars in the central parsec (a few cm). However, Ozernoy et al. raise the possibility that a sizeable population of OB stars may be present in the cluster, and that the X-rays arise in the shocks produced at the interfaces of the winds of these OB stars and the WR-type emission-line stars. The number of O stars required for a substantial probability of a sufficiently close encounter is , however, far larger than the luminosity constraints allow, so one must appeal to WR+OB binary systems for anything but an occasional X-ray flare of several weeks duration. The most significant constraint on the WR+OB colliding wind model is that there is no known WR star coincident with CXOGC J174540.0290027 (catalog ).
In addition to the central cluster of emission-line stars, the central few hundredths of a parsec surrounding Sgr A∗ () contains a concentration, or cusp, of at least a dozen bright stars (K 14–16 mag), which, according to Eckart, Ott, & Genzel (1999), are predominantly blue and featureless, indicating that they may be O stars. This “Sgr A∗ (IR)” cluster warrants consideration as the source of the X-rays observed toward Sgr A∗ if the winds from these stars are typical of those of O stars, because colliding O-star winds can also generate measurable X-ray fluxes (c.f., Pittard & Stevens, 1997), and the size of this cusp of stars can roughly account for the observed extent of CXOGC J174540.0290027 (catalog ).
The typical separation of the stars observed in the central cusp is about 01, or cm. The calculations of Pittard & Stevens indicate that a separation cm is needed, even in the most favorable case, to reproduce the luminosity observed for CXOGC J174540.0290027 (catalog ). Therefore, one must again invoke close binary systems or expect only rare and brief events. Nothing is currently known concerning the binarity of the stars in the cusp; in this dense stellar environment, the dynamical evolution of binary systems should be relatively rapid. We note that the observed spectra of the O+O wind binaries HD 57060 and Orionis that Pittard & Stevens compare to their models have keV, which would be unobservable at the Galactic Center. The possibility that some or all of the flux of CXOGC J174540.0290027 (catalog ) is due to colliding winds remains open and can be investigated using the source variability and spectrum.
One can also consider an origin from young lower-mass stars, which are likely to be present among the luminous young OB/WR stars in the stellar cluster. Late-type stars have X-ray emission elevated by factors of above their main sequence levels during their first years due to enhanced magnetic activity (Feigelson & Montmerle, 1999). In two observed cases, X-ray flares exhibited peak – ergs s-1, with –10 keV, and decays on timescales of hours (Preibisch, Neuhäuser & Alcalá, 1995; Tsuboi et al., 1998). It is thus possible, if the rapid variation at the beginning of the observation is real rather than a statistical fluctuation, that it originated in a young star rather than the MBH. The quiescent X-ray emission from these stars does not exceed ergs s-1, so a population of magnetically active lower-mass stars would be needed to produce all of the Sgr A∗ emission. There are over a dozen O-type stars in the central 05 cusp. If we were to use the standard initial mass function (IMF) for stars in the solar neighborhood, we would expect there to be about 100 magnetically active low-mass stars per O star, so their combined luminosity would be ergs s-1. However, it is believed that the environment in the central parsec favors formation of higher-mass stars and that the IMF in the central parsec may be flatter and may have a higher low-mass cutoff than in the solar neighborhood (Morris, 1993).
The final stellar possibility that we consider for producing some fraction of the X-rays is that of a population of compact stellar objects in the entourage of the central black hole, Sgr A∗ (Morris, 1993; Lee, 1995; Miralda-Escude & Gould, 2000). If the massive stars now observed in the central parsec evolve to produce stellar mass black holes, and if those black holes are more massive than the bulk of the field stars in the stellar population of the central stellar core, then they will settle by gravitational segregation into a tight core comparable in size to the observed stellar cusp. If this process occurs in a quasi-continuous fashion over the lifetime of the Galaxy, then in the steady state, a substantial number of stellar-mass black holes may be present in the compact central cluster, perhaps as many as . Interestingly, the collective luminosity of such a large number of compact objects, possibly including the most massive neutron stars, cannot compete with emission by a single object of the same total mass, because the Bondi accretion rate is proportional to the square of the accretor mass (Bondi, 1952). If a black hole cluster is to contribute substantially to the X-ray emission, then it must contain close binaries with stellar companions that can contribute a substantial accretion flow.
Whether or not X-ray binaries exist in the cusp is a topic of considerable interest to stellar dynamicists. The velocity dispersion of stars in the cusp ( km s-1) is at least an order of magnitude larger than in globular clusters ( km s-1), so the favored mechanisms for forming binaries in globular clusters do not work in the stellar cusp at the center of our Galaxy (F. Rasio 2001, private communication; see also Rasio, 1993). Rough estimates based on the tidal capture rate from hyperbolic orbits near the MBH (Alexander & Kumar, 2001, ; T. Alexander 2001, private communication) indicate that the number of X-ray binaries in the cusp at any given time is at least 3 orders of magnitude less than unity. Furthermore, frequent collisions with surrounding stars would cause any binaries to harden rapidly, leading either to disruption of the main-sequence star or to formation of short-lived common-envelope systems. In either case, the lifetimes of binaries in the cusp are probably relatively brief.
In summary, the X-ray luminosity and spectrum of Sgr A∗ are not extremely different from those seen in colliding wind WR binaries, but the absence of any He I star coincident with the X-ray source casts doubt on the presence of an appropriate binary at the correct location. The possible presence of one or more O+O binaries in the central stellar cusp cannot be excluded, but it seems doubtful that their spectra would be sufficiently hard. A population of young, magnetically active low-mass stars in the central stellar cusp could produce the observed luminosity and spectrum, but there is no observational evidence at this time that such low-mass stars are actually present in the required numbers. A population of compact stellar-mass objects accreting hydrodynamically from the ambient medium could be present in the cusp, but their combined luminosity would be many orders of magnitude fainter than that of a single black hole. An origin in an accreting X-ray binary system cannot be confidently excluded, but it seems improbable, due to the difficulty of forming binaries in a stellar environment with such a high velocity dispersion and to the rapid dynamical evolution that would be expected for any binaries that might be formed. All things considered, a stellar origin for the emission within 15 of Sgr A∗ is unlikely, and we proceed with the discussion assuming the emission originates from accretion onto the MBH.
11 MBH Astrophysical Models of the X-ray Emission
Assuming the emission from the X-ray source we have detected with Chandra is generated by matter accreting onto the massive black hole associated with Sgr A∗, we can use the measured X-ray luminosity and spectrum to test the various black hole accretion models that have been developed for Sgr A∗. As discussed in §1, one would expect Sgr A∗ to emit ergs s-1 in the 2–10 keV band, if it were radiating at the Eddington rate. The observed 2–10 keV luminosity from Sgr A∗ reported in this paper is ergs s-1, which is times fainter than that. It is possible that some fraction of the observed emission could be contributed by stellar objects within of Sgr A∗, so the actual ratio could be even smaller. Sgr A∗ is thought to accrete matter from the stellar winds of nearby massive stars, particularly the dozen or more luminous and windy He I stars in the central parsec cluster. Current estimates for the Bondi capture rate range from yr-1 (Quataert, Narayan, & Reid, 1999b) to yr-1 (Coker & Melia, 1997). Even at these rates, Sgr A∗ is underluminous in X-rays, according to the standard model, by factors of .
11.1 Thermal Bremsstrahlung
11.1.1 Spectral Shape
The low luminosity of Sgr A∗ may be explained by accretion at a rate much below the estimated Bondi rate, or by accretion at the Bondi rate of gas that is radiating very inefficiently, or by some combination of the two. Since there appears to be an ample supply of matter available from the stellar winds, research has concentrated on the study of low radiative efficiency accretion flows. Two prominent models developed over the past decade have been the Bondi accretion and the advection-dominated accretion flow (ADAF) models. These models assume quasi-spherical infall onto the MBH.
In the Bondi model (Melia, 1992, 1994), the highly supersonic stellar winds flowing past Sgr A∗ form a bow shock that dissipates the bulk motion of the gas and heats it to a temperature of K. The ionized gas is then assumed to free-fall radially with no net angular momentum until it reaches the circularization radius at , where is the Schwarzschild radius of the MBH. Gravitational binding energy released during infall is transferred to the compressed magnetic field, which heats the ionized gas through some combination of magneto-sonic and/or magneto-turbulent processes. Plasma microinstabilities and collective effects are then invoked to set up thermal equilibrium between the electrons and ions on a timescale shorter than the infall timescale. The ionized gas within the Keplerian region is assumed to infall on a timescale much shorter than the cooling time; consequently the thermal energy stored in the gas is lost as the gas crosses the event horizon of the MBH.
In the ADAF models (Ichimaru, 1977; Rees et al., 1982; Narayan, Yi, & Mahadevan, 1995; Abramowicz et al., 1995; Mahadevan, 1998), the gas is assumed to accrete with angular momentum. Turbulent magnetic viscosity dissipates energy and transfers angular momentum outward through the flow, allowing the accreting material to move inward. The bulk of the viscous energy is assumed to be deposited in the ions, with only a small fraction of the energy transmitted directly to the electrons. It is further assumed that electrons and ions interact only via the Coulomb process. The ions, mainly protons, are unable to radiate efficiently and maintain a temperature close to the virial temperature at all radii (, where ). The electrons, on the other hand, radiate effectively via thermal bremsstrahlung at larger radii and also via synchrotron and Compton processes nearer the MBH. At large radii, Coulomb scattering keeps the electrons and ions at a common temperature, but at smaller radii the relaxation timescale is longer than the infall timescale, and their temperatures diverge. The electron temperature begins to saturate at RS, reaching a maximum of K near the MBH. Thus, a two-temperature plasma develops in the flow with the ions advecting the bulk of the released binding energy through the event horizon.
The standard Bondi and ADAF models both assume the X-ray emission from Sgr A∗ is dominated by thermal bremsstrahlung emission from electrons in the hot optically thin accretion flow. Both models can fit the absorption-corrected 2–10 keV luminosity measured with Chandra ( ergs s-1) by adjusting the accretion rate downward by factors of a few from their best-fit values to the ROSAT upper-limit (but see footnote 3 in §2.2). Given the large uncertainty in the actual accretion rate onto Sgr A∗ from the stellar winds, the measured luminosity alone cannot exclude either model; however, it can be used to fix the accretion rate at the Bondi radius and thus provides an important constraint on all hot accretion flow models (see §11.1.2).
For both models, the predicted intrinsic spectrum in the Chandra band (0.1–10 keV) has photon index () (Melia, 1994; Coker & Melia, 2000; Narayan et al., 1998a). However, in the Bondi model the emission arises from a region within the circularization radius (), while in the ADAF model the spectrum is dominated by emission from cooler gas at large radii (). This difference in the location of the dominant emitting region may be significant, as discussed below.
The best-fit, absorbed power-law model to the Chandra spectrum has , which is much steeper than the predicted Bondi/ADAF spectra in the literature. Interestingly, the predicted photon index for both models lies near the lower limit of the 90% confidence interval, even after adjusting for the systematic effects discussed in §5.3.1. Due to the poor photon statistics, we cannot exclude the Bondi/ADAF models with the current data at the level. However, it is possible that further observations to measure the spectrum accurately might well enable us to exclude them in the near future.131313There is an additional complication in comparing the observed spectrum to the ADAF model. The ADAF spectrum is dominated by bremsstrahlung emission from the outer parts of the accretion flow, so the spectral shape depends on the relative size of the telescope beam with respect to the Bondi accretion radius. This can lead to a photon index steeper than 1.4 (E. Quataert 2000, private communication). Determination of the size and radial profile of the extended X-ray emission from Sgr A∗ will therefore be important when interpreting its spectrum. Either way, the ability of Chandra to resolve the X-ray emission from Sgr A∗ out of the surrounding emission and to measure its spectrum will provide information crucial to theoretical efforts to understand the accretion and emission mechanisms in this source.
Recently, models have been developed in which it is proposed that not all the matter in the accretion flow at large radii makes its way to small radii and thence through the event horizon. The Bernoulli parameter in ADAF models is positive (Narayan & Yi, 1994; Blandford & Begelman, 1999), which means the gas accretes with positive energy and may escape. They propose that only a small fraction of the matter () in the outer accretion flow makes it to the event horizon and that the binding energy released by this matter is transported to the outer parts of the flow, where it drives a substantial wind that carries off most of the matter. Hence, the amount of matter actually accreting through the event horizon is substantially reduced. Lowering the accretion rate at small radii would alleviate the need for the flow onto Sgr A∗ to have a radiative efficiency . This is a very appealing concept, since such a low radiative efficiency would require that turbulent processes transfer energy from the protons to the electrons at an extremely low rate. As noted by Blandford & Begelman, their adiabatic inflow-outflow solutions (ADIOS) model generalizes the ADAF model to include the effects of a wind. Quataert & Narayan (1999a) have computed spectral models for Sgr A∗ using an ADAF+wind model.
It has also been realized that ADAFs are unstable to convection for small values of the dimensionless viscosity parameter . This has given rise to convection-dominated accretion flow (CDAF) models (Ball, Narayan, & Quataert, 2000; Quataert & Gruzinov, 2000a), in which it is proposed that convection transfers angular momentum inward and energy outward through the flow. The inward transfer of angular momentum almost cancels out the normal outward transfer of angular momentum, and the energy transported outward from the inner parts of the accretion flow heats the outer regions of the flow, retarding the rate of accretion. The net effect on the flow is that most of the matter circulates in convective eddies at large radii, rather than falling inward toward the event horizon. Eventually, this excess matter must be lost from the accretion flow in some manner, since otherwise a massive disk would build up over time.
One consequence of these new models is that the mass density distribution in the accretion flow rises less steeply toward the center. In the standard Bondi/ADAF models, the density () varies with radius () as , while in the CDAF/ADAF+wind models . Here is a variable used to parameterize the effect of a wind or convection on the density profile as a function of radius. Consequently, the accretion rate is constant with radius in the Bondi/ADAF models, while in the CDAF/ADAF+wind models it varies with radius (; ).
In the context of their ADAF+wind model, Quataert & Narayan (1999a) investigate the effect of wind strength on the spectrum. They find that, ignoring the weak frequency dependence of the Gaunt factor, the predicted spectrum in the Chandra band has photon index , where is the power-law index of the electron temperature profile () in the outer parts of the flow. Comparing this to our measured spectrum of Sgr A∗, we find that the ADAF model can be reconciled with the soft spectrum () of Sgr A∗ if a substantial wind or strong convection () is present.
Assuming that the observed X-ray spectrum is thermal bremsstrahlung from a hot accretion flow onto Sgr A∗ and using the current best-fit photon index, the predicted density profile through the flow would vary roughly as in these models. Unfortunately, the uncertainty in the measured photon index is too large to put tight constraints on the parameter and hence on the density profile at this time. Values of ranging from –1 are currently acceptable. Fortunately, the observations needed to put useful constraints on the density profile are entirely feasible with Chandra/ACIS.
11.1.2 Accretion Rate and Emission Measure
Assuming the observed X-ray emission is from a hot, optically thin thermal plasma accreting onto the MBH, we use our best-fit Raymond-Smith model to estimate the accretion rate at the Bondi radius () and to infer the accretion rate near the event horizon for the various hot accretion flow models discussed above. The best-estimate ambient plasma conditions are cm-3 and keV; the corresponding emission measure cm-6 pc, and the total mass of the plasma is .
The equation for the accretion radius is , where is the gravitational constant, is the mass of the black hole at Sgr A∗, and is the speed of sound in the plasma. The sound speed is given by the equation km s-1, which is comparable to the bulk velocities of the stellar winds (–1000 km s-1; Paumard et al., 2001). Here is the adiabatic index, is Boltzmann’s constant, and are the temperature and mean atomic weight of the gas, and is the mass of a hydrogen atom. For simplicity, we assume that the process is adiabatic () and that the gas is fully ionized with twice solar abundances (). Substituting the value for the sound speed into the equation above, we find that (13), comparable to the 15 radius of the circle used to extract the spectrum. In the analysis to follow, we adopt pc (15 or ) for the outer radius of the accretion flow.
Using a simple model by Bondi (1952), the accretion rate at is then yr-1, where for an adiabatic process, and is the plasma density. This value for the accretion rate lies 1–2 orders of magnitude below the most recent published estimates for the mass supply rate available from the stellar winds (see the discussion at the beginning of §11).
The accretion rate for the standard ADAF model is related to the Bondi accretion rate by , where is the dimensionless viscosity parameter in the standard thin accretion disk model (Shakura & Sunyaev, 1973). Then yr-1 at . For the ADIOS/CDAF models, the accretion rate scales as a function of radius as . Using derived above from the Chandra spectrum, the predicted accretion rate across the event horizon would be yr-1. In the CDAF model, the density profile is expected to be , so should equal 1, which is within the uncertainties allowed by the Chandra spectrum. Thus, scaling the Chandra results using the CDAF model gives an accretion rate at the event horizon of yr-1.
Recently, Aitken et al. (2000) reported the detection of linearly polarized radio emission from Sgr A∗ at frequencies above 150 GHz (see §2.1). Agol (2000) and Quataert & Gruzinov (2000b) show that the detection of linear polarization implies the Faraday rotation measure must be small and derive strong upper limits on the density and magnetic field strength at small radii in the accretion flow, where the polarized synchrotron emission is generated. Both groups find that yr-1 is required at small radii to prevent Faraday rotation from depolarizing the synchrotron emission and propose that a CDAF or ADAF with an outflow could satisfy the conditions. Comparing this limit derived from radio observations to the estimates we derived above from our Chandra data indicates that these models could plausibly satisfy this requirement.
Theoretical studies of X-ray emission lines in hot accretion flows indicate that flows with strong winds should have stronger emission lines than flows with weak or no winds (Narayan & Raymond, 1999; Perna, Raymond, & Narayan, 2000). Detection of an Fe K line at 6.7 keV in the Sgr A∗ spectrum would be a strong argument for the existence of a hot thermal accretion flow, since synchrotron models do not produce such a line, and for the presence of a strong wind or convection. In addition, emission-line ratios could provide powerful diagnostics of the run of density and temperature with radius in the flow. The first crucial step is to improve the signal-to-noise of the spectrum at 6–7 keV in order to assess our possible detection of line emission from highly ionized iron. This will require significantly more observing time with Chandra.
11.2 Synchrotron Self-Compton
Another emission mechanism which has been invoked recently to account in particular for the X-ray flux from this source is inverse Compton scattering of radio photons. The population of relativistic electrons responsible for producing the radio synchrotron emission is also held responsible for upscattering those photons into the X-ray band by inverse Compton scattering (Beckert & Duschl, 1997). This hypothesis is testable, inasmuch as it predicts that the X-ray flux is closely linked to one component of the radio spectrum and that they should vary in unison.
The primary distinction between existing synchrotron self-Compton (SSC) models lies in the nature and location of the responsible electrons. Beckert & Duschl (1997) invoke a quasi-monoenergetic electron distribution at 30 or 40 to account for the entire radio spectrum and predict an SSC luminosity of ergs s-1. Falcke & Markoff (2000), on the other hand, associate the X-ray flux with radio emission generated in the nozzle of a hypothetical jet. In their model, the jet nozzle is responsible for the sub-millimeter bump in the radio spectrum (the centimeter-wavelength flux comes from much larger distances in the jet), so it is the temporal variations of this component, on estimated time scales of days, which they expect to vary with the X-ray flux. A relativistic factor for the electrons of about 100 is needed to produce both the correct sub-millimeter spectrum and the X-ray emission.
Melia, Liu, & Fatuzzo (2000) similarly associate the X-ray flux with the sub-millimeter bump via the SSC process. They, however, place the synchrotron source at in the inner Keplerian region of the accretion disk, within the circularization radius of the accreting plasma. They stress the importance of simultaneity of future radio and X-ray measurements, not simply because the radio source is variable on time scales less than a year, but also because the X-ray flux variations are expected to be much stronger than those in the sub-millimeter. A change of a factor of two in the sub-millimeter flux would lead to a change in the X-ray flux by as much as a factor or 10 or 20.
There are a number of measurements that could be used to distinguish between the thermal bremsstrahlung and the SSC emission models. First, the bremsstrahlung models do not predict the correlated variability between the radio (cm to sub-mm) and the X-ray bands that the SSC models do. Second, X-rays from the SSC process would vary rapidly as a result of the proximity of their source to the MBH, while X-ray bremsstrahlung arising at larger radii should vary more slowly. Third, the extended source we have observed should appear more point-like when it brightens if some of the X-rays are produced via the SSC mechanism near the MBH, while the more extended emission requires a thermal mechanism. Fourth, the X-ray spectrum should not show strong emission lines if it is dominated by the SSC mechanism, while the emission from the thermal model may show strong lines. As discussed above, it is possible that both emission components may be present. In that case, analyses of changes in the morphology and spectrum of the source as it brightens and dims could be used to determine the relative strengths of the two components.
11.3 Role of the Local Diffuse X-ray Medium
The models discussed in the previous sections are based on the assumption that the MBH is accreting matter from the stellar winds of the nearby massive stars. However, it is conceivable that the MBH is embedded in a hot X-ray-emitting gaseous region and not the cooler plasma ( K) emerging from the stellar cluster.
It is evident from Figures 3–5 that hot plasma is prevalent throughout the central pc of the Galaxy, and is concentrated with higher densities in the innermost pc. This X-ray plasma will homogenize on timescales years, where km s-1 is the sound speed and pc is the characteristic length scale of the inner region around Sgr A∗. The morphology of the diffuse emission appears complex and is not symmetrical about Sgr A∗ suggesting that it formed recently or is subject to external forces.
If the high surface brightness of the diffuse X-rays indicates the presence of a local hot ISM surrounding Sgr A∗, then it could be the main source of material for accretion onto the MBH. The local diffuse plasma has keV and density cm-3 (§7 and Table 3). If this plasma is stationary with respect to the MBH, the Bondi-Hoyle accretion rate would be yr-1 (Bondi, 1952). This accretion rate decreases if the local medium is moving past the MBH at a rate , roughly as .
The relationships between the X-ray emitting plasma seen in the ACIS images and other gaseous structures observed or inferred to be present are very unclear. First, the stellar winds from the massive OB/WR stars in the cluster centered pc from the MBH may create a cavity of rapidly moving stellar gas within the hot ambient medium. This is the model discussed above and in most studies of Sgr A∗ accretion. The ram pressure of the winds is estimated to be 1–2 orders of magnitude greater than the thermal pressure of the ambient medium and should dominate the ambient medium close to the stellar cluster. However, if the winds were to extend to very large distances without thermalizing to X-ray temperatures, the observed cusp in the diffuse X-ray emission should not be present. The spatial configuration of and the pressure balance between the cluster, MBH, and ambient X-ray medium are thus not well established at the present time.
The relationships between the ambient X-ray plasma and other gaseous components in the Sgr A region are similarly unclear. First, as discussed by Maeda et al. (2001), the local plasma may have been recently compressed or pushed aside by the passage of the supernova shock wave of Sgr A East. Second, the hot medium may envelop the cooler spiral-shaped clouds of Sgr A West (Fig. 4). If these clouds originated in the surrounding molecular ring, they are likely subject to heating and evaporation as they orbit inward towards the center.
At the present time, we are unable to determine whether the local diffuse X-ray-emitting medium does or does not affect the accretion onto the MBH. However, future investigations of these issues must consider the ambient hot plasma, which is imaged at high spatial resolution for the first time in this study.
12 Conclusions
In this paper, we have presented results of our first-epoch observation of the Galactic Center performed with the ACIS-I instrument on the Chandra X-ray Observatory. We have produced the first high spatial resolution (), hard X-ray (0.5–7 keV) spectroscopic image of the central 40 pc (17′) of the Galaxy. Most importantly, we have resolved the X-ray emission from the central parsec of the Galaxy and discovered a source, CXOGC J174540.0290027 (catalog ), coincident with the radio position of Sgr A∗ to within 035, corresponding to a maximum projected distance of 16 light-days. Over 150 point sources are detected in the ACIS field of view: an increase in the X-ray source density at the Galactic Center of more than an order of magnitude over that detected by previous X-ray satellites.
A primary goal of this project is the search for an X-ray counterpart to Sgr A∗, the compact nonthermal radio source associated with the MBH at the dynamical center of the Galaxy. The X-ray source we have detected at the position of Sgr A∗ has the following properties, with the most secure results listed first:
-
1.
The 2–10 keV luminosity is ergs s-1, assuming the emission is isotropic (§5.3.1). This is times fainter than the upper limits obtained with previous X-ray satellites (§2.2) and times fainter than the X-ray luminosity that would be expected from the standard black-hole thin accretion disk model, if the source were radiating at the Eddington luminosity of the MBH (§1). The extremely low observed X-ray emissivity of the central MBH is a very powerful constraint on any model.
-
2.
The spectrum is well fit either by an absorbed power-law model with photon index or by an absorbed optically thin thermal plasma model with keV. In either case, the column density cm-2 (§5.3.1). The spectrum is softer than the canonical AGN photon index with –2.0. This latter result is not definitive due to the poor statistics of this faint source.
-
3.
The source appears extended with diameter (§5.2). This is very close to the resolution limit of Chandra/ACIS and should be confirmed with higher photon statistics from additional observations.
-
4.
The inner region of this small structure may have varied on timescales of hr with a factor of 2 amplitude (§5.4). This result is also photon limited, with significance.
-
5.
Tentative evidence for a line at 6.7 keV from He-like iron is seen with significance (§5.3.2).
Based on the fluxes and the spatial distribution of the X-ray sources in the field, we estimate that the probability of detecting an absorbed source by random chance that is as bright or brighter than the Sgr A∗ candidate and that lies within of the radio position is . The nearest windy He I emission-line stars are too far away (2) to account for the X-ray source, and other classes of normal stars are too soft to penetrate the high absorbing column. Colliding winds in O+O binaries in the central stellar cusp may be able to produce the required luminosity, but their spectra might be too soft. A large population of young, magnetically active low-mass stars in the cusp could produce the observed luminosity and spectrum, but there is currently no evidence in the radio or IR bands that such stars are actually present. A population of compact stellar-mass objects accreting hydrodynamically from the ambient medium appears an unlikely origin for the emission, since their cumulative luminosity would be many orders of magnitude fainter than that of a single black hole. It is possible that the emission could originate in an accreting X-ray binary system within the cusp, but the expected number of X-ray binaries is .
Assuming the observed emission within 15 of Sgr A∗ is from accretion onto the MBH, we can use the observed properties of the source to constrain the models. Due to the limited photon statistics, the luminosity and spectral shape of the source can be fit either by an optically thin thermal plasma model or by an SSC model. The apparent extent of the source and the possible detection of an Fe line support the thermal model, while the possible detection of rapid variability supports the SSC model. The current observations, while of limited signal-to-noise, are thus consistent with the presence of both thermal and nonthermal emission components in the Sgr A∗ spectrum.
The results presented in this paper have demonstrated the great potential of Chandra/ACIS to revolutionize our understanding of highly energetic phenomena in the central parsec of our Galaxy. No other X-ray satellite for the foreseeable future will have its unique combination of arcsecond resolution, high sensitivity, broad energy band, and moderate spectral resolution. These properties are indispensable for this study. The results also show that further observations are needed to increase the photon statistics. An improved spectrum could be used to constrain the continuum shape and to search for an emission line at 6.7 keV. Detection of such a line, for example, would show conclusively that a thermal component is present, while a nondetection would put tight constraints on the strength of a wind or outflow in the thermal models. The SSC models predict that the X-ray emission should be variable and show a close correlation with variations in the millimeter band. A vigorous campaign of simultaneous monitoring in the X-ray and millimeter bands is needed to test this prediction. Likewise, increased photon statistics could be used to measure changes in the morphology of the emission from the source, if it varies, and to examine the size of the source as a function of energy. An order of magnitude longer exposure will be needed to achieve these goals.
References
- Abramowicz et al. (1995) Abramowicz, M. A., Chen, X., Kato, S., Lasota, J.-P., & Regev, O. 1995, ApJ, 438, L37
- Aitken et al. (2000) Aitken, D. K., Greaves, J., Chrysostomou, A., Jenness, T., Holland, W., Hough, J. H., Pierce-Price, D., & Richer, J. 2000, ApJ, 534, L173
- Agol (2000) Agol, E. 2000, ApJ, 538, L121
- Alexander & Kumar (2001) Alexander, T., & Kumar, P., 2001, ApJ, in press
- Anantharamaiah et al. (1991) Anantharamaiah, K. R., Pedlar, A., Ekers, R. D., & Goss, W. M. 1991, MNRAS, 249, 262
- Backer (1996) Backer, D. C. 1996, in IAU Symp. 169, Unsolved Problems in the Milky Way, ed. L. Blitz and P. Teuben (Dordrecht: Kluwer Academic), 193
- Backer et al. (1993) Backer, D. C., Zensus, J. A., Kellermann, K. I., Reid, M., Moran, J. M., & Lo, K. Y. 1993, Science, 262, 1414
- Backer & Sramek (1999) Backer, D. C., & Sramek, R. A. 1999, ApJ, 524, 805
- Baganoff (1999) Baganoff, F. 1999, ACIS On-orbit Background Rates and Spectra from Chandra OAC Phase 1, ACIS Memo. 162, MIT Center for Space Research
- Balick & Brown (1974) Balick, B., & Brown, R. L. 1974, ApJ, 194, 265
- Ball, Narayan, & Quataert (2000) Ball, G. H., Narayan, R., & Quataert, E. 2000, preprint (astro-ph/0007037)
- Beckert & Duschl (1997) Beckert, T., & Duschl, W. J. 1997, A&A, 328, 95
- Becklin et al. (1978) Becklin, E. E., Matthews, K., Neugebauer, G., & Willner, S. P. 1978, ApJ, 219, 121
- Blandford & Begelman (1999) Blandford, R. D., & Begelman, M. C. 1999, MNRAS, 303, L1
- Bondi (1952) Bondi, H. 1952, MNRAS, 112, 195
- Bower et al. (1999a) Bower, G. C., Backer, D. C., Zhao, J.-H., Goss, M., & Falcke, H. 1999a, ApJ, 521, 582
- Bower, Falcke, & Backer (1999b) Bower, G. C., Falcke, H., & Backer, D. C. 1999b, ApJ, 523, L29
- Bower et al. (1999c) Bower, G. C., Wright, M. C. H., Backer, D. C., & Falcke, H. 1999c, ApJ, 527, 851
- Bower (2000) Bower, G. 2000, GCNEWS: The Galactic Center Electron. Newsl. 11, ed. A. Cotera, H. Falcke, & S. Markoff
- Bradt & McClintock (1983) Bradt, H. V. D., & McClintock, J. E. 1983, ARA&A, 21, 13
- Coker & Melia (1997) Coker, R. F., & Melia, F. 1997, ApJ, 488, L149
- Coker & Melia (2000) Coker, R. F., & Melia, F. 2000, ApJ, 534, 723
- Corcoran (1996) Corcoran, M. F. 1996, in Revista Mexicana de Astronomia y Astrofisica Serie de Conferencias 5, Workshop on Colliding Winds in Binary Stars to Honor Jorge Sahade, ed. V. Niemela, N. Morrell, & J. Sahade (México D.F.: Instituto de Astronomía, Universidad Nacional Autonoma de México), 54
- Dobrzycki et al. (1999) Dobrzycki, A., Ebeling, H., Glotfelty, K., Freeman, P., Damiani, F., Elvis, M., & Calderwood, T. 1999, Chandra Detect v1.0 User’s Guide, Chandra X-ray Center
- Ebeling, White, & Rangarajan (2001) Ebeling, H., White, D., & Rangarajan, V. 2001, MNRAS, submitted
- Eckart & Genzel (1997) Eckart, A. & Genzel, R. 1997, MNRAS, 284, 576
- Eckart, Ott, & Genzel (1999) Eckart, A., Ott, T. & Genzel, R. 1999, A&A, 352, L22
- Ekers et al. (1983) Ekers, R. D., van Gorkom, J. H., Schwarz, U. J., & Goss, W. M. 1983, A&A, 122, 143
- Eyles et al. (1975) Eyles, C. J., Skinner, G. K., Willmore, A. P., & Rosenberg, F. D. 1975, Nature, 257, 291
- Falcke (1999) Falcke, H. 1999, in ASP Conf. Ser. 186, The Central Parsecs of the Galaxy, ed. H. Falcke, A. Cotera, W. J. Duschl, F. Melia, & M. Rieke (San Francisco: ASP), 113
- Falcke & Cotera (1997) Falcke, H., & Cotera, A. 1997, in IAU Joint Discussion 12, Electronic Publishing, Now and the Future, 23rd meeting of the IAU, 3
- Falcke, Mannheim, & Biermann (1993) Falcke, H., Mannheim, K., & Biermann, P. L. 1993, A&A, 278, L1
- Falcke & Markoff (2000) Falcke, H., & Markoff, S. 2000, A&A, 362, 113
- Feigelson (2001) Feigelson, E. D. 2001, in ASP Conf. Ser., X-ray Astronomy 2000, ed. R. Giacconi, L. Stella, & S. Serio (San Francisco: ASP), in press
- Feigelson & Montmerle (1999) Feigelson, E. D., & Montmerle, T. 1999, ARA&A, 37, 363
- Frank, King, & Raine (1992) Frank, J., King, A., & Raine, D. 1992, Accretion Power in Astrophysics (2d ed.; Cambridge: Cambridge University Press)
- Freeman et al. (2001) Freeman, P. E., Kashyap, V., Rosner, R., & Lamb, D. Q. 2001, ApJ, submitted
- Garcia et al. (2000) Garcia, M. R., Murray, S. S., Primini, F. A., Forman, W. R., McClintock, J. E., & Jones, C. 2000, ApJ, 537, L23
- Genzel et al. (1996) Genzel, R., Thatte, N., Krabbe, A., Kroker, H., & Tacconi-Garman, L. E. 1996, ApJ, 472, 153
- Genzel et al. (1997) Genzel, R., Eckart, A., Ott, T., & Eisenhauer, F. 1997, MNRAS, 291, 219
- Genzel et al. (2000) Genzel, R., Pichon, C., Eckart, A., Gerhard, O. E., & Ott, T. 2000, MNRAS, 317, 348
- Ghez et al. (1998) Ghez, A. M., Klein, B. L., Morris, M., & Becklin, E. E. 1998, ApJ, 509, 678
- Ho et al. (2001) Ho, L. C., et al. 2001, ApJ, in press
- Høg et al. (2000) Høg, E., et al. 2000, A&A, 355, L27
- Ichimaru (1977) Ichimaru, S. 1977, ApJ, 214, 840
- Jones (1974) Jones, T. W. 1974, A&A, 30, 37
- Kaastra (1992) Kaastra, J. S. 1992, An X-Ray Spectral Code for Optically Thin Plasmas: Updated Version 2.0, SRON-Leiden
- Kawai et al. (1988) Kawai, N., Fenimore, E. E., Middleditch, J., Cruddace, R. G., Fritz, G. G., Snyder, W. A., Ulmer, M. P. 1988, ApJ, 330, 130
- Kennea & Skinner (1996) Kennea, J. A., & Skinner, G. K. 1996, PASJ, 48, L117
- Khokhlov & Melia (1996) Khokhlov, A., & Melia, F. 1996, ApJ, 457, L61
- Koyama et al. (1989) Koyama, K., Awaki, H., Kunieda, H., Takano, S., Tawara, Y., Yamauchi, S., Hatsukade, I., & Nagase, F. 1989, Nature, 339, 603
- Koyama et al. (1990) Koyama, K., Kawada, M., Takano, S., & Ikeuchi, S. 1990, PASJ, 42, L1
- Koyama et al. (1996) Koyama, K., Maeda, Y., Sonobe, T., Takeshima, T., Tanaka, Y., & Yamauchi, S. 1996, PASJ, 48, 249
- Koyama et al. (1994) Koyama, K., Maeda, Y., Tsuru, T., Nagase, F., & Skinner, S. 1994, PASJ, 46, L93
- Krabbe et al. (1995) Krabbe, A., et al. 1995, ApJ, 447, L95
- Lang, Morris, & Echevarria (1999) Lang, C. C., Morris, M., & Echevarria, L. 1999, ApJ, 526, 727
- Lee (1995) Lee, H. M. 1995, MNRAS, 272, 605
- Lynden-Bell & Rees (1971) Lynden-Bell, D., & Rees, M. J. 1971, MNRAS, 152, 461
- Maeda et al. (2001) Maeda, Y., et al. 2001, ApJ, submitted
- Maeda et al. (1996) Maeda, Y., Koyama, K., Sakano, M., Takeshima, T., Yamauchi, S. 1996, PASJ, 48, 417
- Maeda et al. (1999) Maeda, Y., Koyama, K., Yokogawa, J. and Skinner, S. 1999, ApJ, 510, 967
- Mahadevan (1998) Mahadevan, R. 1998, Nature, 394, 651
- Maoz (1998) Maoz, E. 1998, ApJ, 494, L181
- Marr, Wright, & Backer (1993) Marr, J. M., Wright, M. C. H., & Backer, D. C. 1993, ApJ, 411, 667
- Melia (1992) Melia, F. 1992, ApJ, 387, L25
- Melia (1994) Melia, F. 1994, ApJ, 426, 577
- Melia, Liu, & Fatuzzo (2000) Melia, F., Liu, S., & Fatuzzo, M. 2000, preprint (astro-ph/0010211)
- Menten et al. (1997) Menten, K. M., Reid, M. J., Eckart, A., & Genzel, R. 1997, ApJ, 475, L111
- Mewe, Gronenschild, & van den Oord (1985) Mewe, R., Gronenschild, E. H. B. M., & van den Oord, G. H. J. 1985, A&AS, 62, 197
- Mezger et al. (1989) Mezger, P. G., et al. 1989, A&A, 209, 337
- Miralda-Escude & Gould (2000) Miralda-Escude, J., & Gould, A. 2000, ApJ, 545, 847
- Monet (1998) Monet, D. G. 1998, BAAS, 193, 120.03
- Morris (1993) Morris, M. 1993, ApJ, 408, 496
- Morris & Serabyn (1996) Morris, M., & Serabyn, E. 1996, ARA&A, 34, 645
- Morris & Yusef-Zadeh (1985) Morris, M., & Yusef-Zadeh, F. 1985, AJ, 90, 2511
- Najarro et al. (1997) Najarro, F., Krabbe, A., Genzel, R., Lutz, D., Kudritzki, R. P., & Hillier, D. J. 1997, A&A, 325, 700
- Narayan et al. (1998a) Narayan, R., Mahadevan, R., Grindlay, J. E., Popham, R. G., & Gammie, C. 1998a, ApJ, 492, 554
- Narayan, Mahadevan, & Quataert (1998b) Narayan, R., Mahadevan, R., & Quataert, E. 1998b, in Theory of Black Hole Accretion Disks, ed. M. A. Abramowicz, G. Bjornsson, & J. E. Pringle (Cambridge: Cambridge University Press), 148
- Narayan & Raymond (1999) Narayan, R., & Raymond, J. 1999, ApJ, 515, L69
- Narayan & Yi (1994) Narayan, R., & Yi, I. 1994, ApJ, 428, L13
- Narayan, Yi, & Mahadevan (1995) Narayan, R., Yi, I., & Mahadevan, R. 1995, Nature, 374, 623
- Ott, Eckart, & Genzel (1999) Ott, T., Eckart, A., & Genzel, R. 1999, ApJ, 523, 248
- Ozernoy (1989) Ozernoy, L. M. 1989, in IAU Symp. 136, The Center of the Galaxy, ed. M. Morris, (Dordrecht: Kluwer Academic), 555
- Ozernoy, Genzel, & Usov (1997) Ozernoy, L. M., Genzel, R. and Usov, V. V. 1997, MNRAS, 288, 237
- Paumard et al. (2001) Paumard, T., Maillard, J. P., Morris, M., & Rigaut, F. 2000, A&A, in press
- Pavlinsky, Grebenev, & Sunyaev (1994) Pavlinsky, M. N., Grebenev, S. A., & Sunyaev, R. A. 1994, ApJ, 425, 110
- Pedlar et al. (1989) Pedlar, A., Anantharamaiah, K. R., Ekers, R. D., Goss, W. M., van Gorkom, J. H., Schwarz, U. J., Zhao, J.-H. 1989, ApJ, 342, 769
- Perna, Raymond, & Narayan (2000) Perna, R., Raymond, J., & Narayan, R. 2000, ApJ, 541, 898
- Pittard & Stevens (1997) Pittard, J. M., & Stevens, I. R. 1997, MNRAS, 292, 298
- Predehl & Schmitt (1995) Predehl, P., & Schmitt, J. H. M. M. 1995, A&A, 293, 889
- Predehl & Trümper (1994) Predehl, P., & Trümper, J. 1994, A&A, 290, L29
- Predehl & Zinnecker (1996) Predehl, P., & Zinnecker, H. 1996, in ASP Conf. Ser. 102, The Galactic Center, ed. R. Gredel (San Francisco: ASP), 415
- Preibisch, Neuhäuser & Alcalá (1995) Preibisch, T., Neuhäuser, R., & Alcalá, J. M. 1995, A&A, 304, L13
- Prigozhin et al. (2000) Prigozhin, G., Kissel, S., Bautz, M., Grant, C., LaMarr, B., Foster, R., Ricker, G., & Garmire, G. 2000, Proc. SPIE, 4012, 720
- Quataert & Gruzinov (2000a) Quataert, E., & Gruzinov, A. 2000a, ApJ, 539, 809
- Quataert & Gruzinov (2000b) Quataert, E., & Gruzinov, A. 2000b, preprint (astro-ph/0004286)
- Quataert & Narayan (1999a) Quataert, E., & Narayan, R. 1999a, ApJ, 520, 298
- Quataert, Narayan, & Reid (1999b) Quataert, E., Narayan, R., & Reid, M. J. 1999b, ApJ, 517, 101
- Rasio (1993) Rasio, F. A. 1993, PASP, 105, 973
- Raymond & Smith (1977) Raymond, J. C., & Smith, B. W. 1977, ApJS, 35, 419
- Rees et al. (1982) Rees, M. J., Begelman, M. C., Blandford, R. D., & Phinney, E. S. 1982, Nature, 295, 17
- Reid (1993) Reid, M. J. 1993, ARA&A, 31, 345
- Reid et al. (1999) Reid, M. J., Readhead, A. C. S., Vermeulen, R. C., & Treuhaft, R. N. 1999, ApJ, 524, 816
- Rieke, Rieke, & Paul (1989) Rieke, G. H., Rieke, M. J., & Paul, A. E. 1989, ApJ, 336, 752
- Rogers et al. (1994) Rogers, A. E. E., et al. 1994, ApJ, 434, L59
- Sault & Macquart (1999) Sault, R. J., & Macquart, J.-P. 1999, ApJ, 526, L85
- Shakura & Sunyaev (1973) Shakura, N. I., & Sunyaev, R. A. 1973, A&A, 24, 337
- Sidoli et al. (1999) Sidoli, L., Mereghetti, S., Israel, G. L., Chiappetti, L., Treves, A., & Orlandini, M. 1999, ApJ, 525, 215
- Skinner (1989) Skinner, G. K. 1989, in IAU Symp. 136, The Center of the Galaxy, ed. M. Morris (Dordrecht: Kluwer Academic), 567
- Skinner et al. (1987) Skinner, G. K., et al. 1987, Nature, 330, 544
- Spitzer (1978) Spitzer, L. 1978, Physical Processes in the Interstellar Medium (New York: Wiley-Interscience)
- Stolovy, Hayward, & Herter (1996) Stolovy, S. R., Hayward, T. L., & Herter, T. 1996, ApJ, 470, L45
- Terashima, Ho, & Ptak (2000) Terashima, Y., Ho, L. C., & Ptak, A. F. 2000, ApJ, 539, 161
- Tsuboi et al. (1998) Tsuboi, Y., Koyama, K., Murakami, H., Hayashi, M., Skinner, S., & Ueno, S. 1998, ApJ, 503, 894
- Watson et al. (1981) Watson, M. G., Willingale, R., Grindlay, J. E., & Hertz, P. 1981, ApJ, 250, 142
- Weisskopf et al. (1996) Weisskopf, M. C., O’dell, S., & van Speybroeck, L. P. 1996, Proc. SPIE, 2805, 2
- Williams et al. (1990) Williams, P. M., van der Hucht, K. A., Pollock, A. M. T., Florkowski, D. R., van der Woerd, H. & Wamsteker, W. M. 1990, MNRAS, 243, 662
- Wright & Backer (1993) Wright, M. C. H., & Backer, D. C. 1993, ApJ, 417, 560
- Wright et al. (2001) Wright, M. C. H., Coil, A. L., McGary, R. S., Ho, P. T. P., & Harris, A. I. 2001, in press
- Wright et al. (1987) Wright, M. C. H., Genzel, R., Güsten, R., & Jaffe, D. T. 1987, in AIP Conf. Proc. 155, The Galactic Center, ed. D. C. Backer, (New York: AIP), 133
- Yusef-Zadeh, Choate, & Cotton (1999) Yusef-Zadeh, F., Choate, D., & Cotton, W. 1999, ApJ, 518, L33
- Yusef-Zadeh & Morris (1987) Yusef-Zadeh, F. & Morris, M. 1987, ApJ, 320, 545
- Yusef-Zadeh, Melia, & Wardle (2000) Yusef-Zadeh, F., Melia, F., & Wardle, M. 2000, Science, 287, 85
- Zhao, Bower, & Goss (2000) Zhao, J.-H., Bower, G. C., & Goss, W. M. 2000, ApJ, in press
- Zhao (1989) Zhao, J., Ekers, R. D., Goss, W. M., Lo, K. Y., & Narayan, R. 1989, in IAU Symp. 136, The Center of the Galaxy, ed. M. Morris (Dordrecht: Kluwer Academic), 535
| CXOGC Name | R.A.aaPositional uncertainties are derived by combining the statistical uncertainties from centroiding with the residual RMS scatter in the X-ray positions of the Tycho-2 reference sources after aligning Chandra to the Hipparcos celestial coordinate system (§3.2). | Dec.aaPositional uncertainties are derived by combining the statistical uncertainties from centroiding with the residual RMS scatter in the X-ray positions of the Tycho-2 reference sources after aligning Chandra to the Hipparcos celestial coordinate system (§3.2). | R.A.bbPositional offsets are defined as Tycho-2 position (Høg et al., 2000) Chandra position. | Dec.bbPositional offsets are defined as Tycho-2 position (Høg et al., 2000) Chandra position. | Count RateccCount rate in the 0.5–1.5 keV band. | Tycho-2 ddTycho-2 identifiers are from Høg et al. 2000. |
|---|---|---|---|---|---|---|
| (J2000) | (J2000) | (″) | (″) | ( counts s-1) | ||
| J174525.7285626 | 17 45 25.78 0.01 | 28 56 26.8 0.2 | 0.0 | 0.1 | 6840-666-1eeOptical identifier: CSI-28-17423 (catalog ) (B star). | |
| J174530.0290704 | 17 45 30.01 0.01 | 29 07 04.4 0.2 | 0.1 | 0.2 | 6840-020-1ffOptical identifiers: HD 316224 (catalog ) (F2 star); HIP 86911 (catalog ) (parallax = 10.73 mas). | |
| J174543.9290456 | 17 45 43.92 0.01 | 29 04 56.4 0.2 | 0.1 | 0.2 | 6840-590-1 |
Note. — Units of right ascension (R.A.) are hours, minutes, and seconds; units of declination (Dec.) are degrees, arcminutes, and arcseconds.
| CXOGC Name | R.A.aaPositional uncertainties are derived by combining the statistical uncertainties from centroiding with the residual RMS scatter in the X-ray positions of the Tycho-2 reference sources after aligning Chandra to the Hipparcos celestial coordinate system (§3.2). | Dec.aaPositional uncertainties are derived by combining the statistical uncertainties from centroiding with the residual RMS scatter in the X-ray positions of the Tycho-2 reference sources after aligning Chandra to the Hipparcos celestial coordinate system (§3.2). | R.A.bbPositional offsets are defined as radio position (Yusef-Zadeh, Choate, & Cotton, 1999) Chandra position. | Dec.bbPositional offsets are defined as radio position (Yusef-Zadeh, Choate, & Cotton, 1999) Chandra position. | Count RateccCount rate in the 0.5–9.0 keV band. |
|---|---|---|---|---|---|
| (J2000) | (J2000) | (″) | (″) | ( counts s-1) | |
| J174540.0290027 | 17 45 40.02 0.01 | 29 00 27.8 0.2 | 0.2 | 0.2 |
Note. — Units of right ascension (R.A.) are hours, minutes, and seconds; units of declination (Dec.) are degrees, arcminutes, and arcseconds.
| Sgr A∗ | Integrated PointbbCounts from Sgr A∗ are excluded from the integrated spectrum of the point sources within 10″ of Sgr A∗. | Local Diffuse | ||
|---|---|---|---|---|
| Sources | Emission | |||
| Power-law Model | ||||
| [ cm-2] | 9.8 (6.8–14.2) | 13.2 (10.5–19.7) | ||
| 2.7 (1.8–4.0) | 2.5 (1.9–3.7) | |||
| Norm. [ photons cm-2 s-1 keV-1 at 1 keV] | 3.5 (0.6–28.8) | 8.2 (2.8–75.0) | ||
| 19.8/22 | 56.3/72 | |||
| Optically Thin Thermal Plasma ModelccThe optically thin thermal plasma code that we use was developed by Raymond & Smith (1977). Twice solar elemental abundances are assumed. | ||||
| [ cm-2] | 11.5 (8.4–15.9) | 12.8 (11.4–14.2) | ||
| kT [keV] | 1.9 (1.4–2.8) | 1.3 (1.2–1.5) | ||
| Norm. [ cm-5]dd, where and are the electron and ion densities (cm-3) and is the distance to the source (cm). | 5.2 (2.7–12.3) | 62 (43–87) | ||
| 16.5/22 | 119.1/121 | |||
| Flux and Luminosity (2–10 keV)eeX-ray luminosities () are corrected for absorption, while fluxes () are not corrected. The quantities and listed for Sgr A∗ are derived using the best-fit parameters of the power-law model; the optically thin thermal plasma model gives similar values. | ||||
| [ ergs cm-2 s-1] | 1.3 (1.1–1.7) | 4.0 (3.3–4.5) | 6.0 (5.6–6.2)ffDivide by square arcseconds to convert to surface brightness. | |
| [ ergs s-1] | 2.4 (1.8–5.4) | 7.8 (6.0–19.4) | 24 (18–32)ffDivide by square arcseconds to convert to surface brightness. | |
Note. — The uncertainties on the model parameters are the 90% confidence intervals computed using for one interesting parameter. The uncertainties for the fluxes and luminosities are the 90% confidence intervals computed using for two interesting parameters (§5.3.1).