In the Shadow of the Accretion Disk: Higher
Resolution Imaging
of the Central Parsec in NGC 4261
Abstract
The physical conditions in the inner parsec of accretion disks believed to orbit the central black holes in active galactic nuclei can be probed by imaging the absorption (by ionized gas in the disk) of background emission from a radio counterjet. We report high angular resolution VLBI observations of the nearby ( Mpc) radio galaxy NGC 4261 that confirm free-free absorption of radio emission from a counterjet by a geometrically thin, nearly edge-on disk at 1.6, 4.8, and 8.4 GHz. The angular width and depth of the absorption appears to increase with decreasing frequency, as expected. We derive an average electron density of cm-3 at a disk radius of about 0.2 pc, assuming that the inner disk inclination and opening angles are the same as at larger radii. Pressure balance between the thermal gas and the magnetic field in the disk implies an average field strength of gauss at a radius of 0.2 pc. These are the closest-in free-free absorption measurements to date of the conditions in an extragalactic accretion disk orbiting a black hole with a well-determined mass. If a standard advection-dominated accretion flow exists in the disk center, then the transition between thin and thick disk regions must occur at a radius less than 0.2 pc (4000 Schwarzschild radii).
1 Introduction
The nearby low-luminosity (FR I) radio galaxy NGC 4261 (3C270) is a good candidate for the detection of free-free absorption by ionized gas in an inner accretion disk. The galaxy is known to contain a central black hole with a mass of (Ferrarese, Ford, and Jaffe, 1996), a nearly edge-on nuclear disk of gas and dust with a diameter of pc, and a large-scale symmetric radio structure which implies that the radio axis is close to the plane of the sky. Nolthenius (1993) gives a distance of Mpc, or 40 Mpc for an assumed Hubble constant of . At a distance of 40 Mpc, 1 milliarcsecond (mas) corresponds to 0.2 pc.
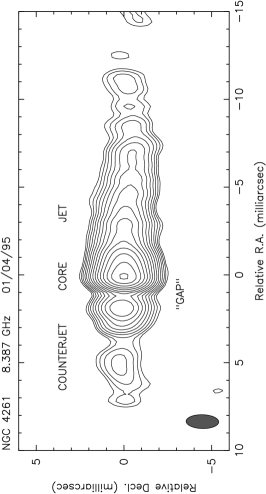
Previous VLBA observations of this galaxy revealed a parsec-scale radio jet and counterjet aligned with the kpc-scale jet (see Figure 1; Jones and Wehrle (1997)). We believe the west-pointing jet is oriented slightly towards us (so the east-pointing jet is labeled the counterjet) based on the orientation of the dust disk imaged by HST and the fact that the west-pointing kpc-scale jet is slightly brighter over most of its length in VLA images (Birkinshaw and Davies (1985); de Koff, et al. (2000)). The opening angle of the jets is less than during the first 0.2 pc and less than during the first 0.8 pc. At 8.4 GHz we found evidence for a narrow gap in radio brightness at the base of the parsec-scale counterjet, just east (left) of the brightest peak which we identified as the core based on its inverted spectrum between 1.6 and 8.4 GHz (Jones and Wehrle, 1997). We tentatively identified this gap as the signature of free-free absorption by a nearly-edge on inner disk with a width much less than pc and an average electron density of over the inner 0.1 pc.
The region labeled “gap” in Figure 1 differs from other regions of reduced emission along the counterjet in two ways. First, it is uniquely deep and narrow. This is difficult to see in the contour maps (Figures 1 and 7), but is clear in the brightness profiles (Figures 11 and 12). Second, the “gap” region has a strongly inverted radio spectrum, as shown in Figure 9. This is completely different from the spectrum anywhere else along the jet or counterjet. For these reasons we believe that the gap labeled in Figure 1 is not an intrinsically faint part of the counterjet but instead is faint because of intervening absorption.
2 Observations
We observed NGC 4261 at 1.6 and 4.9 GHz with the HALCA satellite and a ground array composed of 7 VLBA111 The Very Long Baseline Array (VLBA) and the Very Large Array (VLA) are facilities of the National Radio Astronomy Observatory, which is operated by Associated Universities, Inc., under a cooperative agreement with the National Science Foundation. antennas plus the 25-m antenna at Shanghai, China, the 34-m antenna at Kashima, Japan, and the NASA Deep Space Network 70-m antenna at Tidbinbilla, Australia, at 1.6 GHz (22 June 1999) and 8 VLBA antennas plus the phased 27 antennas of the VLA at 4.9 GHz (27 June 1999). HALCA is an 8-m diameter antenna in Earth orbit, which is used in combination with ground antennas by the VSOP project (Hirabayashi, et al., 1998). During both epochs the VLBA antennas at St. Croix and Hancock were unavailable, as was the North Liberty antenna during the 1.6 GHz session. Table 1 lists the antennas involved at each frequency. Data were recorded as two 16-MHz bandwidth channels with 2-bit sampling by the Mark-III/VLBA systems and correlated at the VLBA processor in Socorro. At 1.6 GHz we recorded 1.634-1.666 GHz, and at 4.9 GHz we recorded 4.850-4.882 GHz. Both channels were sensitive to left circular polarization. The correlator produced a total of 32 spectral channels with an averaging time of 1 second to minimize time smearing of visibility measurements on the ground-space baselines.
| Antenna | Diameter | Typical TSYS | 1.6 GHz | 4.9 GHz |
|---|---|---|---|---|
| name | (m) | (K) | (Y/N) | (Y/N) |
| VLBA-BR | 25 | 25-60 | Y | Y |
| VLBA-FD | 25 | 25-60 | Y | Y |
| VLBA-KP | 25 | 25-60 | Y | Y |
| VLBA-LA | 25 | 25-60 | Y | Y |
| VLBA-MK | 25 | 25-60 | Y | Y |
| VLBA-NL | 25 | 25-60 | N | Y |
| VLBA-OV | 25 | 25-60 | Y | Y |
| VLBA-PT | 25 | 25-60 | Y | Y |
| HALCA (VSOP) | 8 | 75-95 | N | Y |
| Kashima, Japan | 34 | Y | N | |
| Shanghai, China | 25 | Y | N | |
| Tidbinbilla, Aust. | 70 | Y | N |
Fringe-fitting was carried out in AIPS after applying a priori amplitude calibration. For VLBA antennas we used continuously measured system temperatures, while for the phased VLA we used measured values with an assumed source flux density of 5 Jy. The remaining antennas did not provide real-time calibration data, so we used typical gain and system temperature values obtained from the VSOP web site. Fringes were found to all antennas at 1.6 GHz except HALCA. The a priori amplitude calibration for Tidbinbilla was dramatically incorrect (by factors of 13.3 and 13.7 in the two channels) for unknown reasons. We calibrated Tidbinbilla by imaging the compact structure of the source using VLBA data, then holding the VLBA antenna gains fixed and allowing the Tidbinbilla gain to vary. A single time-independent gain correction was determined in this way. This produced a good match in correlated flux density where the projected VLBA and Tidbinbilla baselines overlap. At 4.9 GHz fringes were found to all antennas, including HALCA. Similar corrections to the a priori amplitude calibration for HALCA and the phased VLA were applied. For HALCA these corrections were very large () while for the phased VLA they were 0.24 and 0.25 in the two channels. The reason for the large HALCA amplitude correction is not known, but the VLA corrections may have resulted from our assumed total flux density for NGC 4261. After correction of the HALCA fringe amplitudes, the HALCA-ground baselines agreed well with ground-ground baselines and the observed SNR was consistent with the expected noise levels. This was true for the baseline phases as well, which were unaffected by the amplitude corrections.
In both observations we found that averaging in frequency over both 16-MHz channels in AIPS (using task AVSPC) produced large, baseline-dependent amplitude reductions even though the post-fringe-fit visibility phases were flat and continuous between channels. Averaging over frequency within each 16-MHz band separately fixed this problem. The Caltech program Difmap (Shepherd, Pearson, and Taylor, 1994) was used for detailed data editing, self-calibration, and image deconvolution. Both 16-MHz bands were combined by Difmap during imaging.
Imaging within Difmap used uniform weighting with the weight of HALCA data increased by a factor of 500. This prevented the intrinsically more sensitive ground baselines from completely determining the image resolution. Several iterations of phase-only self calibration, followed by amplitude self calibration iterations with decreasing time scales, resulted in good fits () between the source model and the data. The restoring beam at 1.6 GHz was mas, in position angle -45∘. The restoring beam at 4.9 GHz was mas, in position angle -5∘. The off-source rms noise levels in the images were 0.1 and 0.3 mJy/beam at 1.6 and 4.9 GHz respectively.
3 Results
3.1 1.6 GHz Image
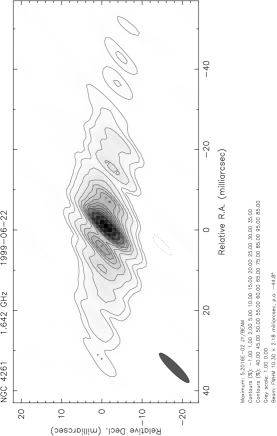
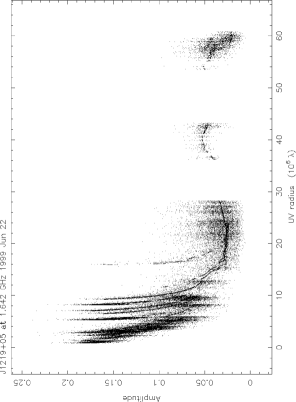
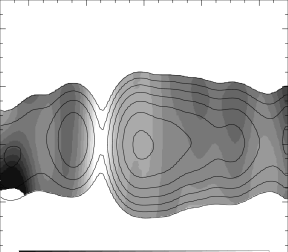
Our image at 1.6 GHz has more than twice the angular resolution of our previous 1.6 GHz image (Jones and Wehrle, 1997) due to the addition of Tidbinbilla, even though no HALCA data is included (see Figure 2). The previous image showed a symmetric structure, with the jet and counterjet extending west and east from the core. An image made from our new 1.6 GHz data, but using only VLBA antennas, also shows a largely symmetric structure (Figure 3). No evidence for absorption is seen in this image. However, with the higher resolution provided by adding Tidbinbilla to the VLBA we do detect a narrow gap in emission just east of the core, at the base of the counterjet (Figure 4). The width of the gap is less than 2 mas. Figure 5 shows the visibility data from which the image in Figure 4 was made.
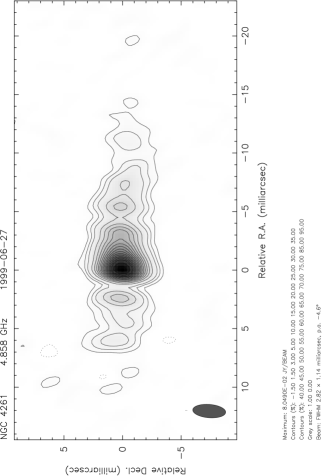
3.2 4.9 GHz Image
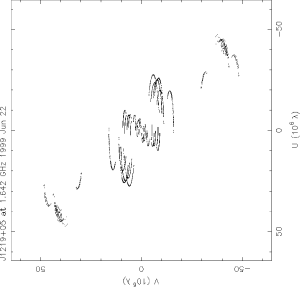
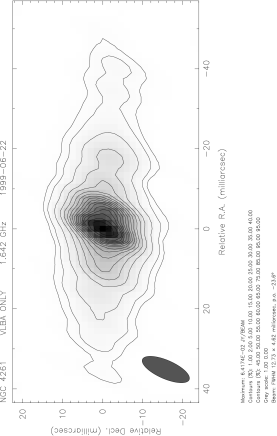
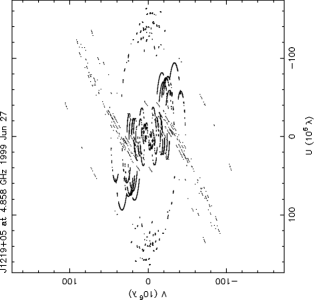
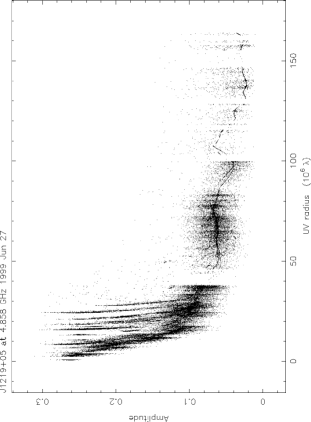
We detected fringes to HALCA at 4.9 GHz only when the projected Earth-space baselines were less than one Earth diameter. However, the HALCA data fills in the (u,v) coverage hole between continental VLBA baselines and those to Mauna Kea, and also increases the north-south resolution by a factor of two (see Figure 6). Our 4.9 GHz image is shown in Figure 7. Note that the gap in emission is again seen just east of the peak. A careful comparison of brightness along the radio axis at 4.9 and 8.4 GHz shows that the gap is both deeper and wider at 4.9 GHz, as expected from free-free absorption. The region of the gap contains far less flux at 4.9 GHz than at 8.4 GHz, and thus has a very inverted spectrum. The brightest peak (core) has a slightly less inverted spectrum, and the distant parts of both the jet and counterjet have generally steep (normal) spectra. We define the spectral index by . Thus, an “inverted” spectrum means , characteristic of either synchrotron self-absorption or free-free absorption, and a “steep” spectrum means , characteristic of optically thin synchrotron emission.
Figure 8 shows the visibility data from which the image in Figure 7 was made, showing significant structure on the longest baselines.
3.3 Spectral Index Distribution
Accurate maps of spectral index require images with matched angular resolutions at two or more frequencies and accurate registration of the images. The use of HALCA at 4.9 GHz provided east-west resolution similar to that obtained with the VLBA alone at 8.4 GHz. For registration we used the fact that the core-gap angular separation is nearly identical at both frequencies (1.2 and 1.1 mas at 4.9 and 8.4 GHz) and that this separation has remained unchanged during three epochs spanning 4 years at 8.4 GHz (Piner, Jones, and Wehrle, 2001). This indicates that the core (base of the jet) and gap (absorption by disk) are features which remain fixed in position over 4 years, and, consequently, they can be used to align VLBI images with similar resolutions. Our three epochs of data at 8.4 GHz show no evidence for large changes in flux density over 4 years. Consequently, we believe that the 4 month difference in epoch between our 4.9 and 8.4 GHz images will not lead to significant errors in spectral index determinations.
Figure 9 shows the spectral index map produced from our matched-resolution images at 4.8 and 8.4 GHz, without residuals. The registration of non-phase-referenced VLBI images is arbitrary, but we can use a combination of four features – the peak, gap, counterjet peak just east of the gap, and the jet feature 11 mas west of the peak. A single offset allowed all four of these features to be matched in position between the images.
4 Discussion
4.1 Jet Opening Angle
We see no evidence for an initial large jet opening angle similar to that described by Junor, Biretta, and Livio (1999) for M87. However, we are not probing as close to the base of the jets in terms of gravitational radii because M87 is closer than NGC 4261 and the central black hole in M87 is more massive. The parsec-scale jet and counterjet in NGC 4261 are unresolved in the transverse-to-the-jet direction at all of our observing frequencies. The core component in Figure 1 must be larger than mas ( light days) in diameter to avoid synchrotron self-absorption, but the inverted spectrum of the core in Figure 9 suggests that the core may be partially self-absorbed. The largest opening angle comes from assuming that the base of the jet (core) has zero angular size. Combined with our upper limit of mas for the jet transverse width at 10 mas from the core (as far out as we can detect the jet with high SNR at 4.9 or 8.4 GHz) this gives an upper limit of for the full jet opening angle over the first 2 pc. This assumes the jet is conical and in the plane of the sky; a more end-on view would reduce our upper limit for the jet opening angle.
A lower limit for the brightness temperature of the core is K. Although we can not rule out a Doppler factor significantly greater than unity, there is no strong evidence (rapid variability, large jet/counterjet brightness ratio, or large proper motions) that would suggest a large Doppler factor in this source.
4.2 Disk Structure
The large-scale HST disk, if intrinsically circular, is oriented from face-on and is from being perpendicular to the radio axis in the plane of the sky (Ferrarese, Ford, and Jaffe (1996); Jaffe, et al. (1996)). If we assume that is typical of the offset between the plane of the disk and the radio axis, the radio axis is likely oriented between and away from our line of sight.
VLBI observations by van Langevelde, et al. (2000) have detected absorption by neutral hydrogen (HI) as close as pc from the center of NGC 4261. HI absorption has also been seen close to the center of NGC 1052 by Kellermann, et al. (1999), indicating that the situation in NGC 4261 is not unique. van Langevelde, et al. (2000) find an HI column density of in front of the counterjet, where TSPIN is the spin temperature. These authors deduce that the HI is in a thin disk with a full opening angle of . This implies an average HI density of for T K. This is a lower limit because TSPIN may be higher in this region and the filling factor may be smaller than unity. The disk opening angle found by van Langevelde, et al. (2000) is comparable to the upper limit of Chiaberg, Capetti, and Celotti (1999), who deduce a typical disk thickness/size () ratio of for their sample of low-luminosity radio galaxies. This sample includes NGC 4261. The innermost part of the disk could be extremely thin. For the well-studied disk in the peculiar Seyfert galaxy NGC 4258, where water masers provide powerful constraints on the disk geometry, the inner 0.25 pc of the maser disk has a height/radius ratio (Moran, 2000).
For a angle between the plane of the disk and our line of sight, the angular width of absorption in Figures 4, 7, and 1 implies that the optical depth becomes at a disk radius pc at 1.6 GHz, pc at 4.9 GHz, and and pc at 8.4 GHz. Using the van Langevelde, et al. (2000) disk opening angle of () we get disk thicknesses of 0.22 pc at a radius of 1.0 pc, 0.13 pc at a radius of 0.6 pc, and 0.11 pc at a radius of 0.5 pc. The line-of-sight path lengths through the disk are pc, pc, and pc respectively (see Figure 10, with and ). Alternatively, using the Chiaberg, et al., value of (for which in Figure 10) we get upper limits for the disk thickness of 0.15 pc at a radius of 1.0 pc, 0.09 pc at a radius of 0.6 pc, and 0.08 pc at a radius of 0.5 pc. The resulting path lengths through the disk are pc, pc, and pc at radii of 1.0, 0.6, and 0.5 pc. Finally, using the disk model in the appendix of Jones, et al. (2000) we get a disk thickness of 0.012 pc, 0.006 pc, and 0.004 pc at radii of 1.0 pc, 0.6 pc, and 0.5 pc, respectively. The corresponding values of in Figure 10 are , , and . These values give path lengths through the disk of 0.03 pc, 0.014 pc, and 0.011 pc at 1.6, 4.9, and 8.4 GHz. The path lengths through the disk for each of the three disk models just discussed are summarized in Table 2.
| Disk Model | Angles (see Figure 10) | 1.6 GHz | 4.9 GHz | 8.4 GHz |
|---|---|---|---|---|
| van Langevelde, et al. | 0.52 pc | 0.31 pc | 0.29 pc | |
| Chiaberg, et al. | 0.36 pc | 0.22 pc | 0.20 pc | |
| Jones, et al. | 0.03 pc | 0.014 pc | 0.011 pc |
Therefore our choice of disk opening angle can change the line-of-sight path lengths through the disk by factors of 17, 22, and 26 at 1.6, 4.9, and 8.4 GHz. However, for a given observed optical depth the average electron density depends on , so our derived values of will vary only by factors of 4 or 5 if we assume different disk opening angles.

It is quite possible that the central region of this low-luminosity radio galaxy contains an advection-dominated accretion flow (ADAF). However, because we observe a thin disk down to a radius of 0.2 pc ( Schwarzschild radii), we conclude that the transition radius between the outer thin disk and an inner ADAF must be smaller than this value. This is a useful constraint (see, e.g., Narayan, Mahadevan, and Quataert (1998)) and is consistent with the upper limit for ADAF size of Schwarzschild radii in NGC 4258 (Herrnstein, et al., 1998). Of course, the relatively cool thin disk could contain a non-standard, hot, advection-dominated corona; our observations would not have been sensitive to it.
4.3 Optical Depth and Electron Density
If we combine the disk opening angle of from van Langevelde, et al. (2000) with the disk orientation angle of from Ferrarese, Ford, and Jaffe (1996) and Jaffe, et al. (1996) we find that the line of sight through the disk is , where is the projected distance on the sky between the center of the disk (core) and the line of sight (see Figure 10). From figures 11 and 12 we see that the location of the absorption (gap) is about 1.2 mas from the peak at 4.9 GHz and 1.1 mas from the peak at 8.4 GHz. An angular distance of 1.2 mas (0.24 pc) between the core and the center of the absorption gives a total path length through the disk of 0.31 pc. For mas (0.22 pc), the line-of-sight path length pc. These are sufficiently close that we will assume equal path lengths at both frequencies.


We would like to determine the radial distribution of electron density in the accretion disk, but this requires measurement of the optical depth along multiple paths that pass through the disk at different radii. The absorption we see at 4.9 and 8.4 GHz occurs in nearly the same narrow region. At 1.6 GHz the absorption is presumably larger, but the absorbed region is only partially resolved with our angular resolution so we have only a lower limit for the optical depth. A more sensitive 1.6 GHz experiment (that might allow fringes to HALCA to be detected) or a global VLBI experiment at 2.3 GHz could help. However, the nearly edge-on orientation of the inner disk makes any determination of spatial variations in optical depth difficult.
Assuming an intrinsic spectral index of and a covering factor of unity, the observed brightness ratio at two frequencies and is given by . The apparent reduction in brightness is about a factor of 30 at 4.9 GHz and a factor of 4 at 8.4 GHz. This implies that and , so . As a check on the plausibility of these values, we note that a brightness ratio of 7.5 between 8.4 and 4.9 GHz implies that . The spectral index comes from Piner, Jones, and Wehrle (2001). The prediction of this simple formula for (= 2.2) is in reasonable agreement with the measured value of 2.0, considering that we have not taken into account the (small) difference in path length through the disk at the two frequencies.
The free-free optical depth is given by Walker, et al. (2000) as
where the path length is in cm (not pc as in Walker, et al. (2000); see Pacholczyk (1970)), is in electrons cm-3, is in K, and is in Hz.
Astrophysical plasmas undergoing sufficient heating to stay ionized generally occupy one of two phases: a very hot phase that fills the local space at roughly the virial temperature or a warm phase at about K. (Under ambient conditions, the latter phase maintains pressure balance with the former phase, but in a black hole accretion disk situation the cooler gas will collect in a Keplerian disk whose pressure and density are determined by the black hole’s tidal forces.) The virial temperature at pc from a black hole is nearly K, producing a very tenuous, spherical plasma with little free-free absorption, rather than a thin disk with substantial absorption. A spherical, low-absorption plasma is inconsistent with our detection of narrow, deep absorption features. We therefore choose the warm, efficiently-radiating K accretion phase, for which we have developed a simple model in Jones, et al. (2000). In this case the Gaunt factor (in square brackets above) for gas within the disk is approximately 9 at both 4.9 and 8.4 GHz. We now have estimates for , and can calculate the average along the line of sight for each value of :
At Hz, we have and cm. Adding the assumption of gives us cm-3. At 8.4 GHz we get cm-3. Given the uncertainties in the optical depths and path lengths, these values for are not significantly different. These values are consistent with the electron densities derived by Jones, et al. (2000) based on lower resolution images. Note that if the thinner model disk from Jones, et al. (2000) is used the average electron densities would be only 4-5 times higher. In all cases a shorter path length or higher gas temperature would increase the average .
The electron densities derived here are low enough that Thompson scattering should not be a significant source of additional absorption. The Thompson scattering coefficient per free electron is , so a column density of electrons cm-2 gives us an absorption of only due to Thompson scattering. The plasma oscillation frequency is given by Hz, which is MHz for . This is a factor of below our observing frequencies and therefore we expect refraction or reflection of radiation within the disk plasma to be negligible.
Our result can be compared with that obtained by Walker, et al. (2000) for 3C84. These authors find for a 1 pc path length, assuming K. We find very similar average electron densities for the inner pc of the disk in NGC 4261, whose low frequency radio luminosity is about 7 times smaller than for 3C84 (Smith and Spinrad, 1980), suggesting that the density of plasma in accretion disks does not depend strongly on the radio luminosity of the central engine. It should be noted that very small or very large optical depths are difficult to measure accurately, and if typical path lengths through the ionized absorbing medium are similar in different galaxies this observational selection effect will bias the distribution of derived electron densities toward similar values. In any case, a larger number of sources covering a larger range of radio luminosities will need to be compared in this way before firm conclusions can be made.
4.4 Disk Magnetic Field
If the accretion-generated luminosity is less than times the Eddington luminosiity, there will be no radiation-pressure dominated region in the accretion disk (Shakura and Sunyaev (1973); Meier (1999)). This may be the case in NGC 4261, whose nuclear luminosity is quite small for an active galaxy. If this is the case, the average magnetic field in the disk can be estimated by assuming pressure balance between the magnetic field and the thermal disk gas: , where here is the Shakura and Sunyaev (1973) viscosity parameter and is the Boltzmann constant. For , , and we get gauss. This applies at disk radii near 0.2 pc. There is considerable uncertainty in these parameter values, particularly in the assumed value of .
We can calculate the expected rotation measure from , where is the path length (still in cm) and is the parallel component of the magnetic field. Using the magnetic field and electron density derived above we get rotation measures of about radians m-2 at 4.8 GHz and radians m-2 at 8.4 GHz. These are actually upper limits because they assume that the magnetic field is ordered and parallel to our line of sight, which is unlikely. In fact, shear created by differential rotation within the accretion disk may cause the magnetic field to be aligned along the direction of gas rotation. This would mean that the magnetic field was mainly orthogonal to our line of sight as it passes through the disk, and, consequently, the observed rotation measure would be greatly reduced. Future VLBI polarization observations may be able to directly measure the Faraday rotation and resulting depolarization in front of the radio counterjet.
5 Conclusions
Our new observations at 1.6 and 4.9 GHz confirm the free-free absorption explanation for the sub-parsec radio morphology in NGC 4261, specifically the fact that the gap in emission at the base of the counterjet is caused by shadowing of the counterjet by the accretion disk. Measurements of the angular width and optical depth in the absorbed region, and the distance between the absorption and the core, as a function of frequency show that the inner pc of the accretion disk is geometrically thin and that the average electron density is a few times at a deprojected radius of 0.2 pc. The corresponding equipartition magnetic field strength is about G. Similar observations of other galaxies covering a wide range of radio luminosities will allow correlations between the central engine fueling process (accretion disk geometry, density, mass, and magnetic field) and AGN activity level (nonthermal luminosity) to be studied. Such studies should improve our understanding of the physical processes involved in accretion-powered central engines in galactic nuclei.
References
- Birkinshaw and Davies (1985) Birkinshaw, M., and Davies, R. L. 1985, ApJ, 291, 32
- Chiaberg, Capetti, and Celotti (1999) Chiaberge, M., Capetti, A., and Celotti, A. 1999, A&A, 349, 77
- de Koff, et al. (2000) de Koff, S., Best, P., Baum, S. A., Sparks, W., Röttgering, H., Miley, G., Golombek, D., Macchetto, F., and Martel, A. 2000, ApJS, 129, 33
- Ferrarese, Ford, and Jaffe (1996) Ferrarese, L., Ford, H. C., and Jaffe, W. 1996, ApJ, 470, 444
- Herrnstein, et al. (1998) Herrnstein, J. R., Greenhill, L. J., Moran, J. M., Diamond, P. J., Inoue, M., Nakai, N., and Miyoshi, M. 1998, ApJ, 497, L69
- Hirabayashi, et al. (1998) Hirabayashi, H., Hirosawa, H., Kobayashi, H., et al. 1998, Science, 281, 1825 and erratum 282, 1995
- Jaffe, et al. (1996) Jaffe, W., Ford, H. C., Ferrarese, L., van den Bosch, F., and O’Connell, R. W. 1996, ApJ, 460, 214
- Jones and Wehrle (1997) Jones, D. L., and Wehrle, A. E. 1997, ApJ, 484, 186
- Jones, et al. (2000) Jones, D. L., Wehrle, A. E., Meier, D. L., and Piner, B. G. 2000, ApJ, 534, 165
- Junor, Biretta, and Livio (1999) Junor, W., Biretta, J., and Livio, M. 1999, Nature, 401, 891
- Kellermann, et al. (1999) Kellermann, K. I., Vermeulen, R. C., Cohen, M. H., and Zensus, J. A. 1999, BAAS, 31, 856
- Meier (1999) Meier, D. L. 1999, ApJ, 522, 753
- Moran (2000) Moran, J. M. 2000, BAAS, 32, 700
- Narayan, Mahadevan, and Quataert (1998) Narayan, R., Majadevan, R., and Quataert, E. 1998, in The Theory of Black Hole Accretion Disks, ed. M. Abramowica, G. Bjornsson, and J. E. Pringle (Cambridge: Cambridge Univ. Press), p. 148
- Nolthenius (1993) Nolthenius, R. 1993, ApJS, 85, 1
- Pacholczyk (1970) Pacholczyk, A. G. 1970, Radio Astrophysics (Freeman & Co., San Francisco), 60
- Piner, Jones, and Wehrle (2001) Piner, B. G., Jones, D. L., and Wehrle, A. E. 2001, in preparation
- Shakura and Sunyaev (1973) Shakura, N. I., and Sunyaev, R. A. 1973, A&A, 24, 337
- Shepherd, Pearson, and Taylor (1994) Shepherd, M. C., Pearson, T. J., and Taylor, G. B. 1994, BAAS, 26, 987
- Smith and Spinrad (1980) Smith, H. E., and Spinrad, H. 1980, PASP, 92, 553
- van Langevelde, et al. (2000) van Langevelde, H. J., Pihlstrom, Y. M., Conway, J. E., Jaffe, W., and Schilizzi, R. T. 2000, A&A, 354, L45
- Walker, et al. (2000) Walker, R. C., Dhawan V., Romney, J. D., Kellermann, K. I., and Vermeulen, R. C. 2000, ApJ, 530, 233