A VLA H92 Recombination Line Study of the Arched Filament
H II Complex Near the Galactic Center
Abstract
The Very Large Array has been used at 8.3 GHz in the DnC and CnB array configurations to carry out an H92 recombination line study (at 8.3 GHz) of the ionized gas in the Arched Filaments H II complex, which defines the western edge of the Galactic center Radio Arc. The Arched Filaments consist of a series of curved filamentary ridges which extend over 9′6′ (22 16 pc) and are intersected in two places by linear, nonthermal, magnetic filaments. The H92 observations cover the entire Arched Filaments region using a four-field mosaic, with an angular resolution of 128 810; an additional higher resolution (36 27) field was imaged in the SW portion of the H II complex. High resolution continuum images are also presented. The H92 line properties of the ionized gas (line-to-continuum ratio, FWHM line width, T) are consistent with photoionization from hot stars, and consistent with the physical properties of other Galactic center H II regions. The LTE electron temperatures vary only slightly across the entire extent of the source, and have an average value of 6200 K. The velocity field is very complex, with velocities ranging from +15 km s-1 to 70 km s-1 and the majority of velocities having negative values. Large velocity gradients (27 km s-1 pc-1, with gradients in some regions 10 km s-1 pc-1) occur along each of the filaments, with the velocities becoming increasingly negative with decreasing distance from the Galactic center. The negative velocities and the sense of the velocity gradients can be understood in terms of the orbital path of the underlying molecular cloud about the Galactic center. The magnitudes of the velocity gradient are consistent with the cloud residing on an inner, elongated orbit which is due to the Galaxy’s stellar bar, or with a radially infalling cloud. The ionization of the Arched Filaments can be accounted for completely by the massive Arches stellar cluster, which consists of 150 O-stars and produces a few 1051 photons s-1. This cluster is likely to be located 1020 pc from the Arched Filaments, which can explain the uniformity of ionization conditions in the ionized gas.
1 Introduction
Several of the most unusual H II regions in the Galaxy are found within 30 pc of the Galactic center. High resolution radio observations made with the Very Large Array (VLA) of the National Radio Astronomy Observatory111The National Radio Astronomy Observatory is a facility of the National Science Foundation, operated under a cooperative agreement with the Associated Universities, Inc. over the past 15 years have revealed the remarkable filamentary morphology of H II regions such as the Sickle and Pistol (Yusef-Zadeh & Morris 1987a; Lang, Goss & Wood 1997), the Arched Filaments (Yusef-Zadeh 1986), and SgrA West (Ekers et al. 1983; Schwarz, Bregman, & van Gorkom 1989, Roberts & Goss 1991, 1993). The largest and most prominent of these regions is the “Arched Filament” H II complex, comprised of a series of curved, narrow ridges of radio emission which define the western edge of the well-known Galactic center Radio Arc (Yusef-Zadeh et al. 1984). The Arched Filaments extend for 9′ 6′ (or 22 15 pc at the assumed Galactic center distance of 8.0 kpc (Reid 1993)) and are located 10′ (25 pc) in projection from the center of the Galaxy, SgrA∗. The thermal nature of these filamentary ridges was first revealed by recombination line observations (Pauls et al. 1976; Pauls & Mezger 1980; Yusef-Zadeh 1986; Yusef-Zadeh, Morris & van Gorkom 1987). In addition to the peculiar morphology of these thermal filaments, the recombination line studies have shown that the kinematics of the Arched Filaments are also very striking, with large velocity gradients along their lengths and predominantly negative velocities in a positive velocity quadrant of the Galaxy, i.e., counter to Galactic rotation for circular orbits. A large molecular cloud complex was discovered in CS (J=21) at the position of the Arched Filaments and extends southward over 16′ (or 40 pc) near SgrA. This cloud exhibits emission over a range of velocities similar to those of the ionized gas (i.e., 5 to 55 km s-1) and is therefore known as the “30 km s-1 cloud”, its name representing the average velocity of the gas in this cloud (Serabyn & Güsten 1987).
In addition to these unusual properties of the Arched Filaments, the surrounding interstellar environment is remarkable for several reasons. First, at their location near the Galactic center, the strong differential gravitational forces of this region are likely to influence both the morphology and kinematics of the interstellar gas within the inner kiloparsec (Güsten & Downes 1980; Serabyn & Güsten 1987) and may well play an important role in understanding the Arched Filaments. Second, the Arched Filaments are intersected by two prominent systems of non-thermal filaments (NTFs). These NTFs are unique to the central 250 pc of the Galaxy; the long (up to 50 pc) and narrow (0.1 pc) synchrotron filaments show strong linearly polarized radio emission and have magnetic field orientations aligned with their long axes (Yusef-Zadeh & Morris 1987b; Yusef-Zadeh, Wardle & Parastaran 1997; Lang et al. 1999ab). The NTFs are understood as evidence for a large-scale poloidal magnetic field which pervades the central 250 pc of the Galaxy (Morris 1994). The NTFs in the Radio Arc intersect the northern edge of the Arched Filaments, and to the southwest, the Northern Thread NTF crosses the southern end of two of the Arched Filaments (Morris & Yusef-Zadeh 1989, hereafter MYZ; Lang et al. 1999b). The nature of the intersection between the thermal gas and NTFs remains a major outstanding issue in understanding the interstellar medium at the Galactic center. The origin and acceleration of relativistic particles in the NTFs may be due to magnetic reconnection at positions where the NTFs are interacting with associated ionized and molecular gas (Serabyn & Morris 1994).
Finally, one of the most exceptional, massive stellar clusters in the Galaxy is located at the eastern edge of the Arched Filaments. The brightest sources in this cluster were first revealed by medium resolution, near-infrared observations (Nagata et al. 1995; Cotera et al. 1996). The near-infrared spectroscopy of Cotera et al. (1996) showed that 13 of the stars can be classified as highly-evolved massive stars such as Wolf-Rayet (WR) and Of stellar types. The ionizing flux generated by these 13 stars may provide part of the ionization of the Arched Filaments. More recent, high resolution observations of the “Arches Cluster” made at near-infrared wavelengths at the W.M. Keck Observatory and with the NICMOS camera on the Hubble Space Telescope (HST) show that it is very densely packed, harboring more than 150 O-stars (Serabyn et al. 1998; Figer et al. 1999). In addition, Figer et al. (1999) estimate that the cluster has a total mass of 104 M☉, with an age of only 2 Myr. A number of far-infrared (FIR) studies have revealed strong FIR line and continuum emission arising from the Arched Filaments (Genzel et al. 1990; Erickson et al. 1991; Morris et al. 1995; Davidson et al. 1994; Colgan et al. 1996).
Before this luminous stellar cluster was discovered, initial explanations for heating of the Arched Filaments relied on shocks between the 30 km s-1 molecular cloud and the interstellar medium in the Galactic center (Bally et al. 1988; Hayvaerts, Norman & Pudritz 1988). In addition, MYZ proposed that the source of heating of the ionized filaments was MHD-induced ionization resulting from the large relative velocity between the molecular cloud and the strong, ambient magnetic field. So far, none of these models has been able to account for all aspects of the radio and FIR observations. In particular, Colgan et al. (1996) reported that the FIR luminosity, [OIII] line fluxes, and low electron densities cannot be explained by either shocks or MHD models for ionization. Instead, these authors have concluded that the Arched Filaments must be uniformly photoionized by a distribution of massive stars.
In this paper, new VLA observations of the H92 recombination lines arising from the Arched Filaments are presented. These observations were carried out in order to make a detailed study of the ionized gas in this unusual source. These data cover the entire region of the Arched Filaments using a four-field mosaic, with higher spatial resolutions (212″) than the previous VLA H110 study of Yusef-Zadeh (1986), which was centered only on the western filaments with a resolution of 22″. The goals of these observations are to understand: (1) the peculiar morphology of the Arched Filaments, (2) the complicated kinematics and velocity field, (3) the interaction of the ionized gas with the massive and luminous stellar cluster and (4) the nature of intersections between NTFs and ionized gas. 2 provides a summary of the observations and data reductions; results from the 8.3 GHz continuum images are presented in 3; results from the H92 line observations are presented in 4, and 5 includes a discussion of the morphology, kinematics and ionization of the Arched Filaments.
2 Observations and Data Reduction
VLA continuum and recombination line observations of the Arched Filaments were made at 8.3 GHz in the DnC and CnB array configurations. Details of the observations are summarized in Tables 1 and 2. Calibration and editing were carried out using the AIPS software of NRAO. Line-free channels were used to determine the continuum, and continuum subtraction was done in the (u,v) plane using the AIPS task UVLSF. The four fields observed in DnC configuration were mosaicked using a maximum entropy deconvolution algorithm (mosmem) in the MIRIAD software package. The H92 line and corresponding continuum mosaics were imaged with natural weighting to achieve the best possible signal-to-noise ratio in the recombination line. An additional continuum mosaic was created with uniform weighting in order to obtain higher spatial resolution. The southeastern field (Arches1) was also observed in the CnB array, and these data were combined with the corresponding DnC observations using the AIPS task DBCON. The combined uv-data were imaged using the AIPS task IMAGR for both the 8.3 GHz continuum and the H92 line with natural weighting. A higher resolution 8.3 GHz image of a portion of this field was made with uniform weighting to highlight the fine-scale structure. The parameters of all images discussed in this paper are summarized in Table 3. The recombination line analysis was done using GIPSY, the Groningen Image Processing SYstem (van der Hulst et al. 1992). Spatially-integrated, continuum-weighted line profiles were made for selected regions of the Arched Filaments using PROFIL, and Gaussian models were fitted to these averaged profiles using PROFIT. Single-component Gaussian functions were also fitted to the line data for each pixel having a signal-to-noise ratio 4.
| Field | Date | Array | Phase Center | Integration Time | |
|---|---|---|---|---|---|
| (J2000) | (J2000) | (hours) | |||
| Arches 1 | Feb 1999 | DnC | 17 45 35.0 | 28 50 00 | 8 |
| “ | Nov 1998 | CnB | ” | ” | 28 |
| Arches 2 | Feb 1999 | DnC | 17 45 47.4 | 28 50 00 | 8 |
| Arches 3 | Feb 1999 | DnC | 17 45 47.4 | 28 47 18 | 8 |
| Arches 4 | Feb 1999 | DnC | 17 45 35.0 | 28 47 18 | 8 |
| Parameter | H92 Data |
|---|---|
| H92 Rest Frequency | 8309.382 MHz |
| LSR Central Velocity | 40 km s-1 |
| Total Bandwidth | 12.5 MHz (45 km s-1) |
| Number of Channels | 63 |
| Channel Separation | 195.3 kHz (7.0 km s-1) |
| Velocity Coverage | 448 km s-1 |
| Flux Density Calibrator | 3C286 |
| Bandpass Calibrator | NRAO 530 (1730-130) |
| Phase Calibrator | 1751-253 |
| Image | Resolution | PA | RMS noise | Weighting | |
|---|---|---|---|---|---|
| Arches Mosaic | continuum-high | 778 661 | 10 | 0.9 mJy beam-1 | uniform |
| continuum-low | 1284 810 | 34 | 1.5 mJy beam-1 | natural | |
| line | 1284 810 | 34 | 0.8 mJy beam-1 | natural | |
| Arches1 | continuum-high | 226 158 | 642 | 0.2 mJy beam-1 | uniform |
| continuum-low | 361 266 | 446 | 0.5 mJy beam-1 | natural | |
| line | 361 266 | 446 | 0.3 mJy beam-1 | natural |
3 Continuum Images at 8.3 GHz
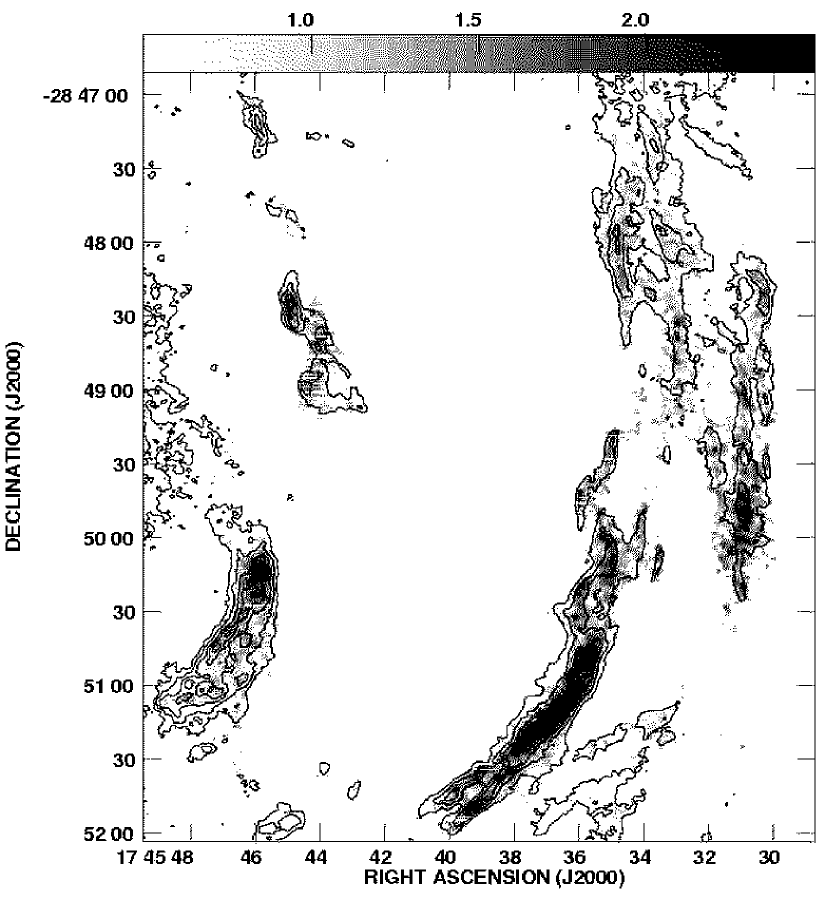
Figure 1 is a schematic of the sources near the Arched Filament H II complex which are discussed in this paper and depicted in Figures 2 and 3. The 8.3 GHz continuum mosaic of the Arched Filaments is shown in greyscale and contours in Figures 2 and 3, with a resolution of 78 66, PA=1.0. Both images have been corrected for primary beam attenuation. The 8.3 GHz continuum image is very similar to the 1.4 and 4.8 GHz continuum images of MYZ. The Arched Filaments are comprised of two pairs of filamentary structures, the “eastern” and “western” filaments: E1, E2, W1, and W2 (after MYZ). The filaments are long and very narrow structures, extending up to 9′ (22 pc) in the north-south direction, with widths of only 20″ (0.8 pc) on average. The four Arched Filaments cover an area of 6′ (15 pc) from east to west, but most of the emission is concentrated in the narrow ridges, which have an areal filling factor of 10%. The similarity in the curvature of all four Arched Filaments is especially striking, and gives the appearance of the western half of a set of concentric circles, the apparent center of which would be located 12′ to the East.
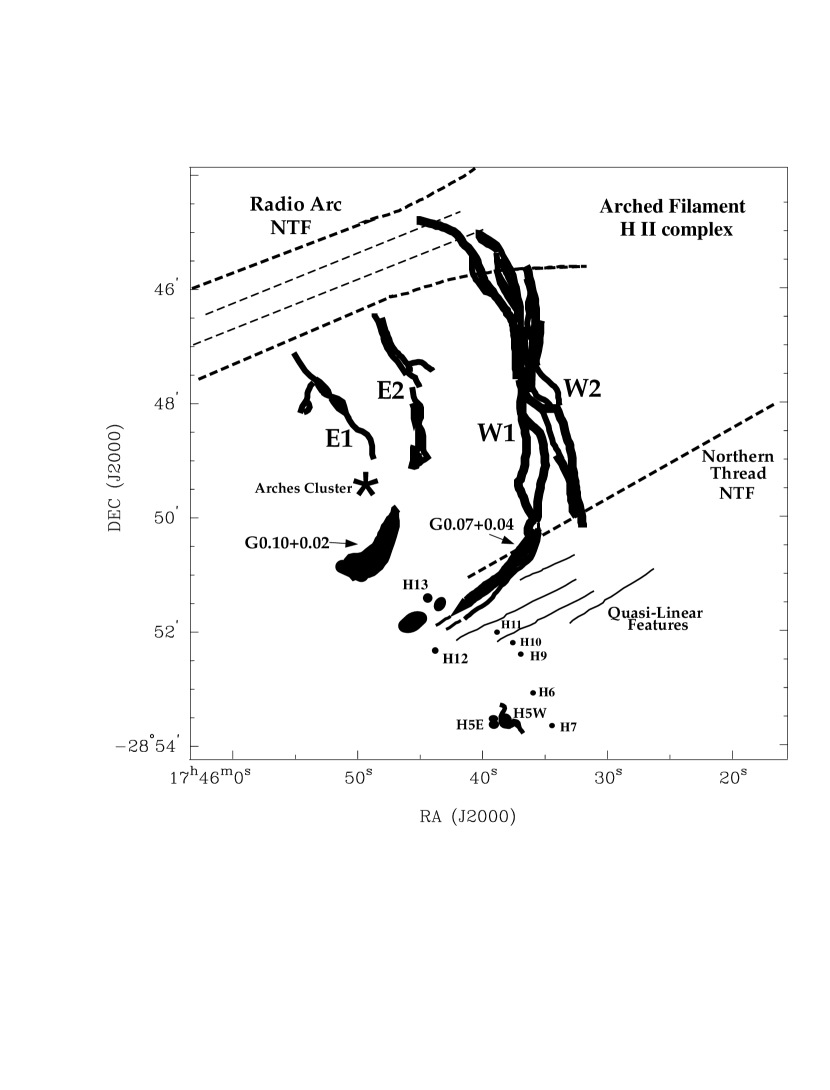
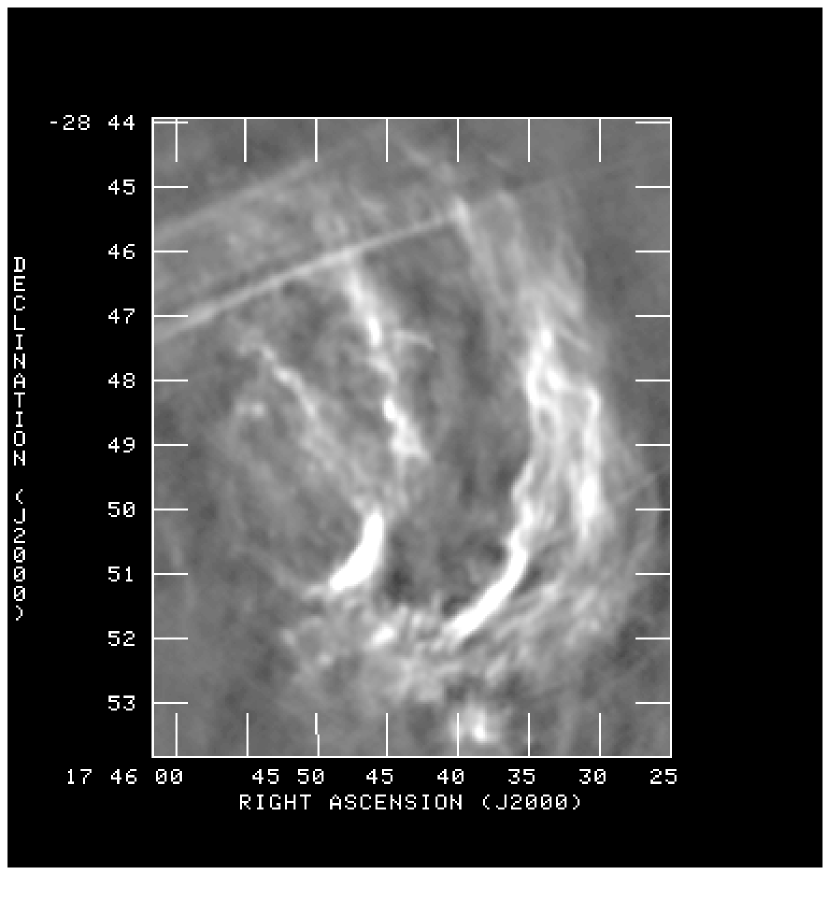
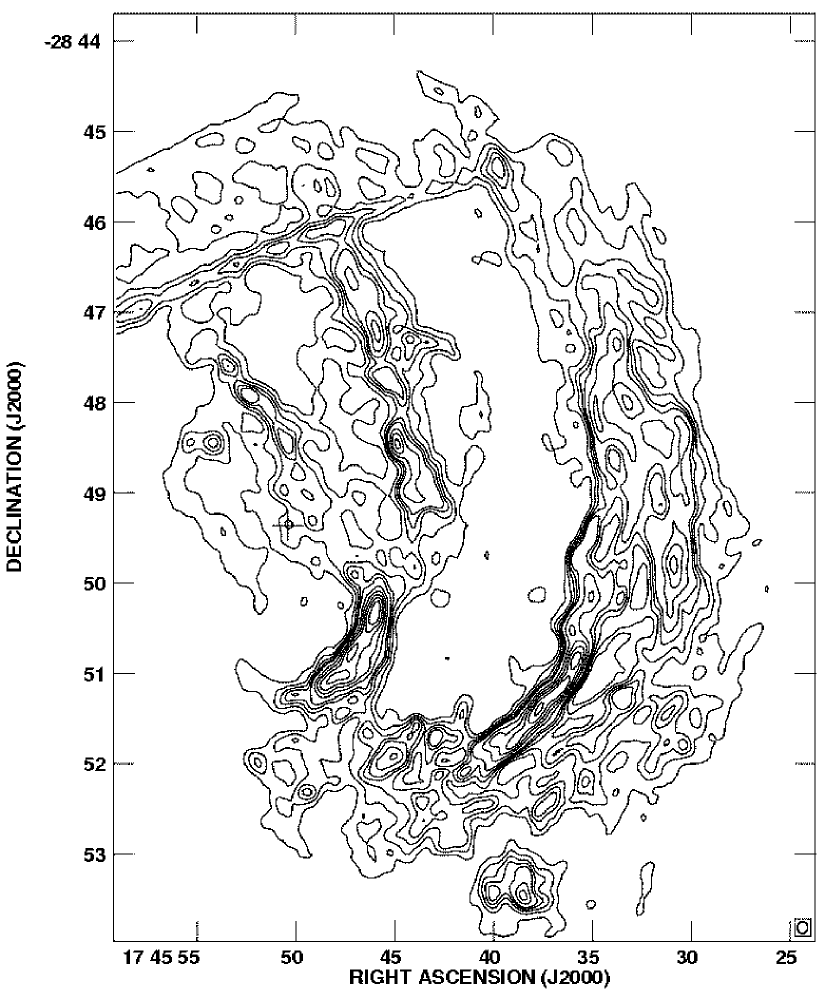
Across the Arched Filaments, the brightness is unevenly distributed, and has a diffuse and tenuous nature. In particular, along W1 and W2, the filaments appear to be comprised of multiple filamentary strands, with the edges of these regions markedly brighter than the central portions of the filaments. The brightest peaks, known as G0.07+0.04 and G0.10+0.02, have relatively uniform brightness over their 6090″ extents, whereas the brightness over the rest of the filaments is much less uniform. Although it appears that G0.10+0.02 may be connected to E1 or E2, there is a dramatic decrease in brightness between G0.10+0.02 and the southern extent of the E1 and E2 filaments (at ,(J2000)=17 45 47.0, 28 49 12). In this region, the emission drops to 15 mJy beam-1, whereas to the North (in E1), the intensity is 25 mJy beam-1, and the intensity in G0.10+0.02 exceeds 85 mJy beam-1. However, this is not the case for the G0.07+0.04 region and the W1 filament. Along W1, the emission does not vary as substantially as in the E1, E2, and G0.10+0.02 region. Moving northward along W1, the intensity increases fairly constantly from 50 to 80 mJy beam-1 for 35, followed by a decrease in intensity to 50 mJy beam-1 starting at ,(J2000)=17 46 35.0, 28 50 00. There are no dramatic changes or discontinuities in the intensity along W1, whereas G0.10+0.02 has a sharper boundary that separates it from the E1 and E2 filaments. Therefore, in this paper, G0.10+0.02 will be considered a separate source from E1 and E2, whereas the W1 filament will include G0.07+0.04.
The Radio Arc NTFs (to the North) and Northern Thread NTF (to the SW) are apparent in Figure 2 where they intersect (in projection) the Arched Filaments. Yusef-Zadeh & Morris (1988) have pointed out that the morphology and discontinuity of the NTFs where they meet the Arched Filaments suggests that there may be a physical connection. On the western side of this image, the Northern Thread NTF is just perceptible where it crosses, in projection, both W1 and W2. A collection of diffuse, extended sources is located to the south of the W2 filament. Several of these features are nearly linear and are oriented parallel to the NTFs, including the adjacent Northern Thread NTF. These “quasi-linear” features were first pointed out by MYZ.
Based on the continuum flux density at 8.3 GHz, physical parameters of the ionized gas in the Arched Filaments have been derived using the formulation of Mezger & Henderson (1967) and the corrections to this formulation (Viallefond 1991). In using these formulae, we assume a uniform density, spherical, ionization-bounded H II region with T=6200 K, and Y+=0.06 (see 4). Although the Arched Filaments are obviously not spherically-symmetric, we divide the region into segments which can be better approximated by a spherical H II region in order to derive the standard parameters for comparison with other H II regions. The ionization-bounded assumption is also valid for the regions we are considering, as the radio emission arises in the the Arched Filament complex from the ionization-bounded side of the nebula. Part of the nebula (to the east of the Arches cluster) is likely to be density-bounded, as the distribution of underlying molecular material falls off completely (Serabyn & Güsten 1987) and there is no detectable free-free emission arising from this region.
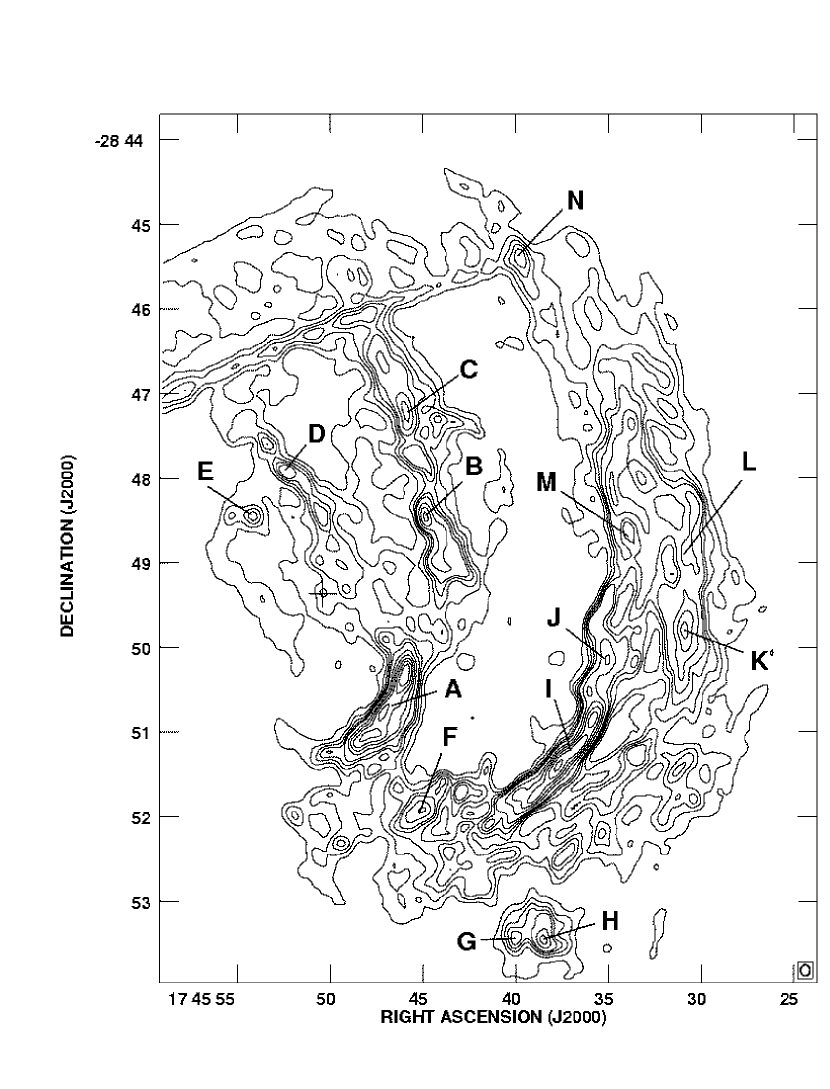
Table 4 lists the derived parameters for these regions: total flux density (Sν), measured angular size, linear size of the equivalent sphere, electron density (ne), emission measure (EM), ionization parameter (U), mass of ionized hydrogen (MHII), number of Lyman continuum ionizing photons, (NLyc), and the 8.3 GHz continuum optical depth ().
| Source | S8.3 | Size | Radius**Assuming a distance of 8.0 kpc to the Galactic center. | ne | EM | U | MHII | NLyc | |
|---|---|---|---|---|---|---|---|---|---|
| (Jy) | (″) | (pc) | (cm-3) | (pc cm-6) | (pc cm-2) | (M | (s | (8.3 GHz) | |
| AaaAlso known as radio continuum peak G0.10+0.12 from MYZ; far infrared peak in both line and continuum (Erickson et al. 1991). | 2.0 | 10030 | 1.5 | 290 | 2.6105 | 68 | 106 | 1.61049 | 0.002 |
| B | 0.9 | 7030 | 1.3 | 250 | 1.7105 | 52 | 55 | 7.21048 | 0.001 |
| C | 0.9 | 8020 | 1.1 | 310 | 2.2105 | 52 | 45 | 4.51048 | 0.002 |
| D | .05 | 1212 | 0.3 | 460 | 1.4105 | 20 | 2 | 3.61047 | 0.001 |
| E | 0.1 | 2020 | 0.6 | 360 | 1.4105 | 29 | 6 | 1.21048 | 0.001 |
| F | 0.4 | 3030 | 0.8 | 340 | 1.9105 | 41 | 21 | 2.61048 | 0.001 |
| GbbKnown H II region H5(W); 6 cm flux density=770 mJy from Zhao et al. 1993. | 0.2 | 1520 | 0.5 | 520 | 2.7105 | 32 | 6 | 1.51048 | 0.002 |
| HccKnown H II region H5(E); 6 cm flux density=330 mJy from Zhao et al. 1993. | 0.3 | 2020 | 0.6 | 510 | 3.0105 | 37 | 9 | 2.31048 | 0.002 |
| IddAlso known as radio continuum peak G0.07+0.04 from MYZ. | 2.2 | 12030 | 1.7 | 270 | 2.5105 | 72 | 132 | 1.61049 | 0.002 |
| J | 0.9 | 8020 | 1.1 | 300 | 2.2105 | 52 | 45 | 7.01048 | 0.002 |
| K | 1.2 | 7030 | 1.3 | 290 | 2.2105 | 57 | 63 | 1.01049 | 0.002 |
| L | 0.4 | 4030 | 1.0 | 250 | 1.3105 | 40 | 24 | 3.31048 | 0.001 |
| M | 1.6 | 10050 | 2.0 | 180 | 1.2105 | 63 | 140 | 1.31049 | 0.001 |
| N | 0.7 | 2525 | 0.7 | 310 | 1.4105 | 33 | 11 | 1.41048 | 0.001 |
| Source | Position | Flux Density (mJy) | Spectral | ||
|---|---|---|---|---|---|
| (J2000) | (J2000) | 3.6 cm**From Figure 5 | 6 cm****From Figure 3 in MYZ | Index | |
| H6 | 17 45 36.6 | 28 53 09 | 23.33.0 | 19.32.0 | +0.3 |
| H7 | 17 45 35.0 | 28 53 35 | 23.83.0 | 16.02.0 | +0.7 |
| H9 | 17 45 37.6 | 28 52 42 | 6.70.5 | 9.00.5 | 0.5 |
| H10 | 17 45 37.8 | 28 52 34 | 4.20.5 | 5.81.0 | 0.6 |
| H11 | 17 45 38.8 | 28 52 31 | 4.30.8 | 4.40.8 | +0.0 |
| H12 | 17 45 43.7 | 28 52 26 | 3.20.4 | 5.52.2 | 0.9 |
| H13 | 17 45 43.9 | 28 51 33 | 2.70.2 | 5.91.0 | 1.4 |
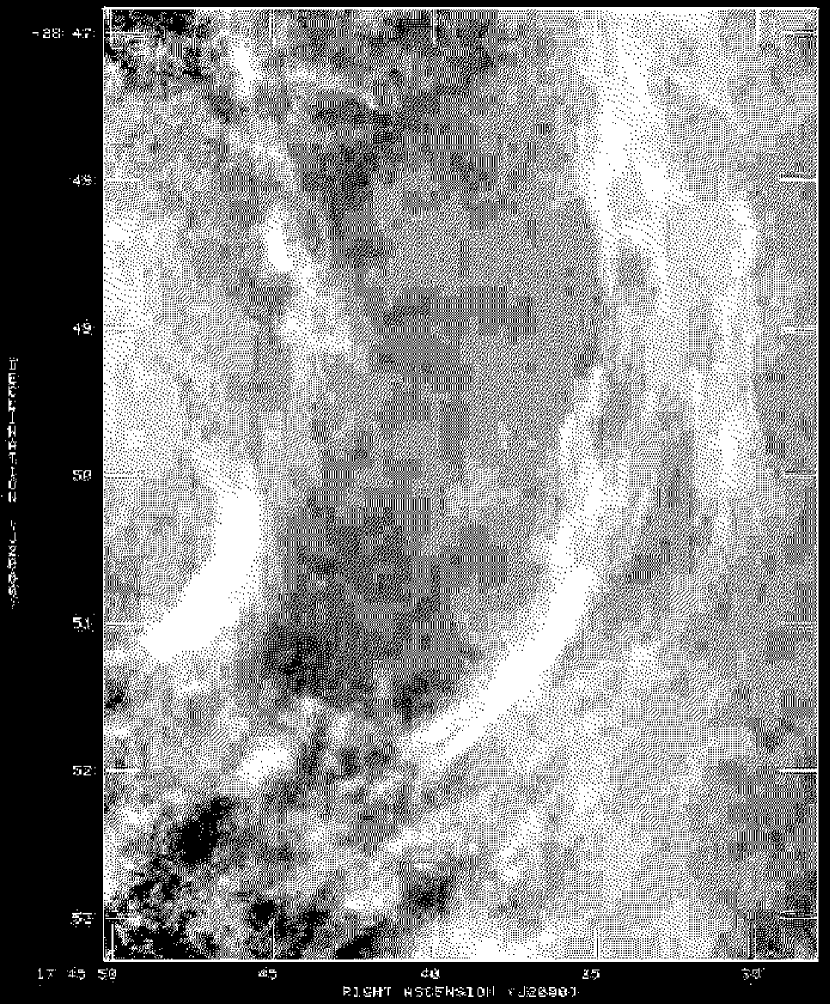
Figure 5 shows a higher resolution (23 16, PA=64°) 8.3 GHz continuum image of a single field in the southeastern portion of the Arched Filaments. As in Figure 2, W1 and W2 appear comprised of multiple filamentary strands and narrow ridges of projected width 3″ (0.125 pc). G0.07+0.04 is prominently bifurcated at an orientation nearly perpendicular to the Galactic plane. Several of the point-like sources to the south of G0.07+0.04 were catalogued by Yusef-Zadeh (1986) as H5-H7. Four additional sources appear in this image, and following the above nomenclature, they are labelled as H9-12 (see Figure 1) and the parameters are listed in Table 5.
4 H92 Recombination Line Observations
Spatially-integrated, continuum-weighted H92 profiles were made over each of the four Arched Filaments in order to characterize their global H92 properties. For these profiles, G0.10+0.02 was assumed to be a member of the E1 filament. The profiles are shown in Figure 6, and properties of the Gaussian fits to these profiles (line-to-continuum ratio, Tl/Tc; central LSR velocity, VLSR; and FWHM line width, V) are given in Table 6. Single component profiles were fitted to the H92 line in the E2, W1, and W2 filaments; region E1 was fitted with a double peaked profile. A possible detection of the He92 line was made in E2, and the intensity ratio of helium to hydrogen, Y+, was calculated to be 0.040.015. The central velocities in the W1 and W2 filaments (V=27 and 44 km s-1) are more negative than those in E1 and E2 (V=12 km s-1), and the double profile in the E1 filament suggests that the velocity field in this region may be complex and comprised of multiple components. The line widths of the integrated profiles in the Arched Filaments range from 2738 km s-1. Line widths for integrated regions within other Galactic center H II regions, such as G0.18-0.04, G0.15-0.05, and SgrA West were found to be much broader (typically 50 km s-1), although smaller integrated regions in these regions have an average line width of 30 km s-1 (Lang et al. 1997; Roberts & Goss 1993). The increased line widths for the larger integrated regions in all cases can be attributed to a combination of the large velocity gradients across each filament and the large areas over which the profiles were integrated.

| Region | Tl/Tc | VLSR | V | T |
|---|---|---|---|---|
| No. | (km s-1) | (km s-1) | (K) | |
| E1 | 0.060.006 | 12.90.9 | 27.11.9 | 6800700 |
| … | 0.050.006 | 43.81.2 | 26.42.3 | … |
| E2 | 0.080.005 | 12.30.7 | 38.21.6 | 6000400 |
| W1 | 0.100.005 | 41.20.4 | 27.10.9 | 6700400 |
| W2 | 0.090.003 | 27.30.3 | 35.20.8 | 5800300 |
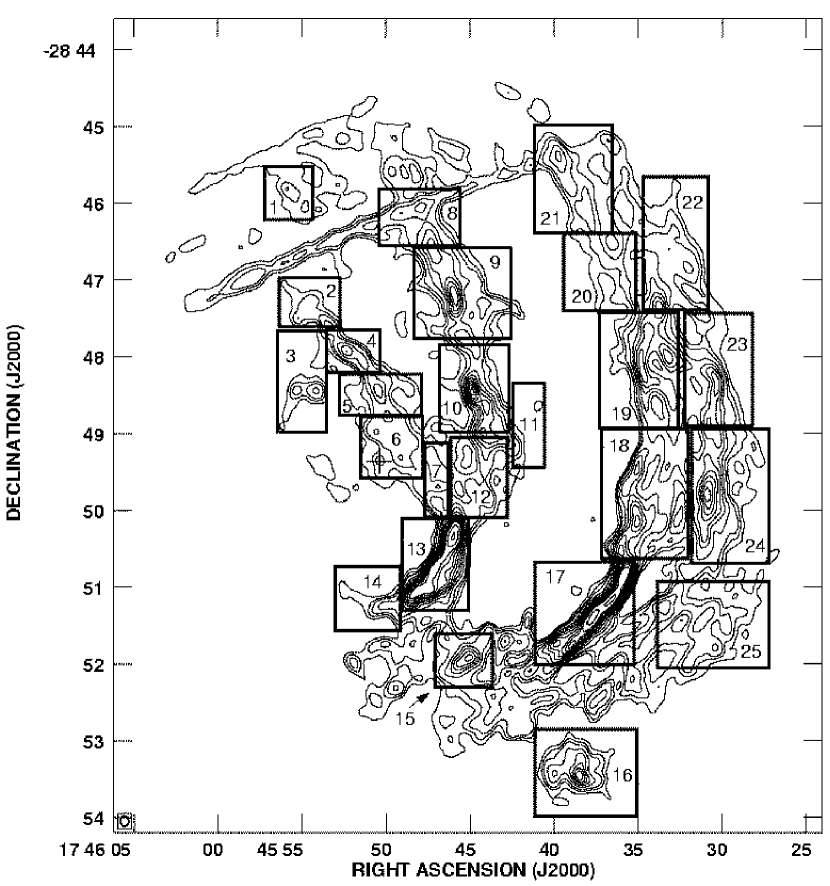
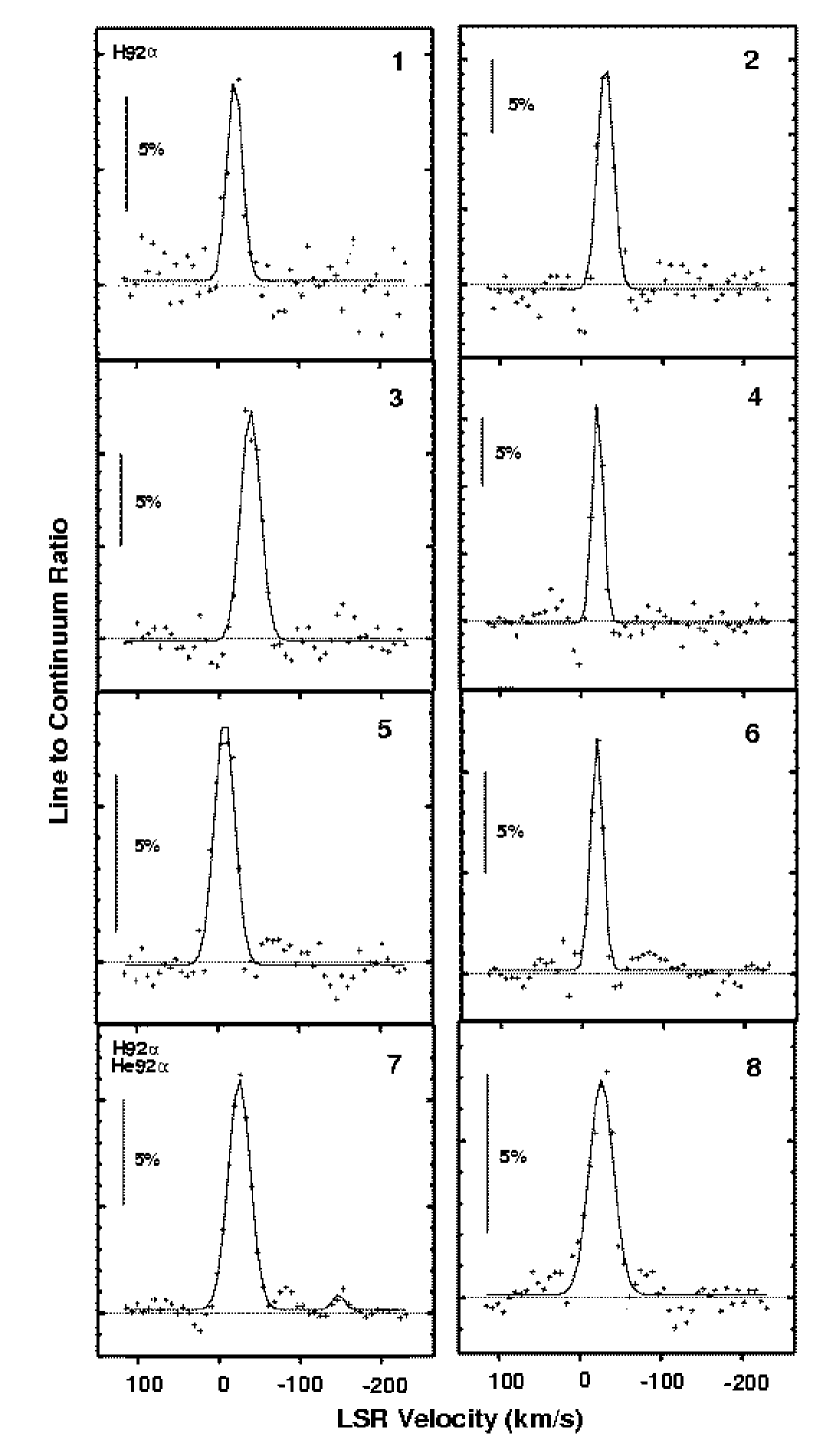
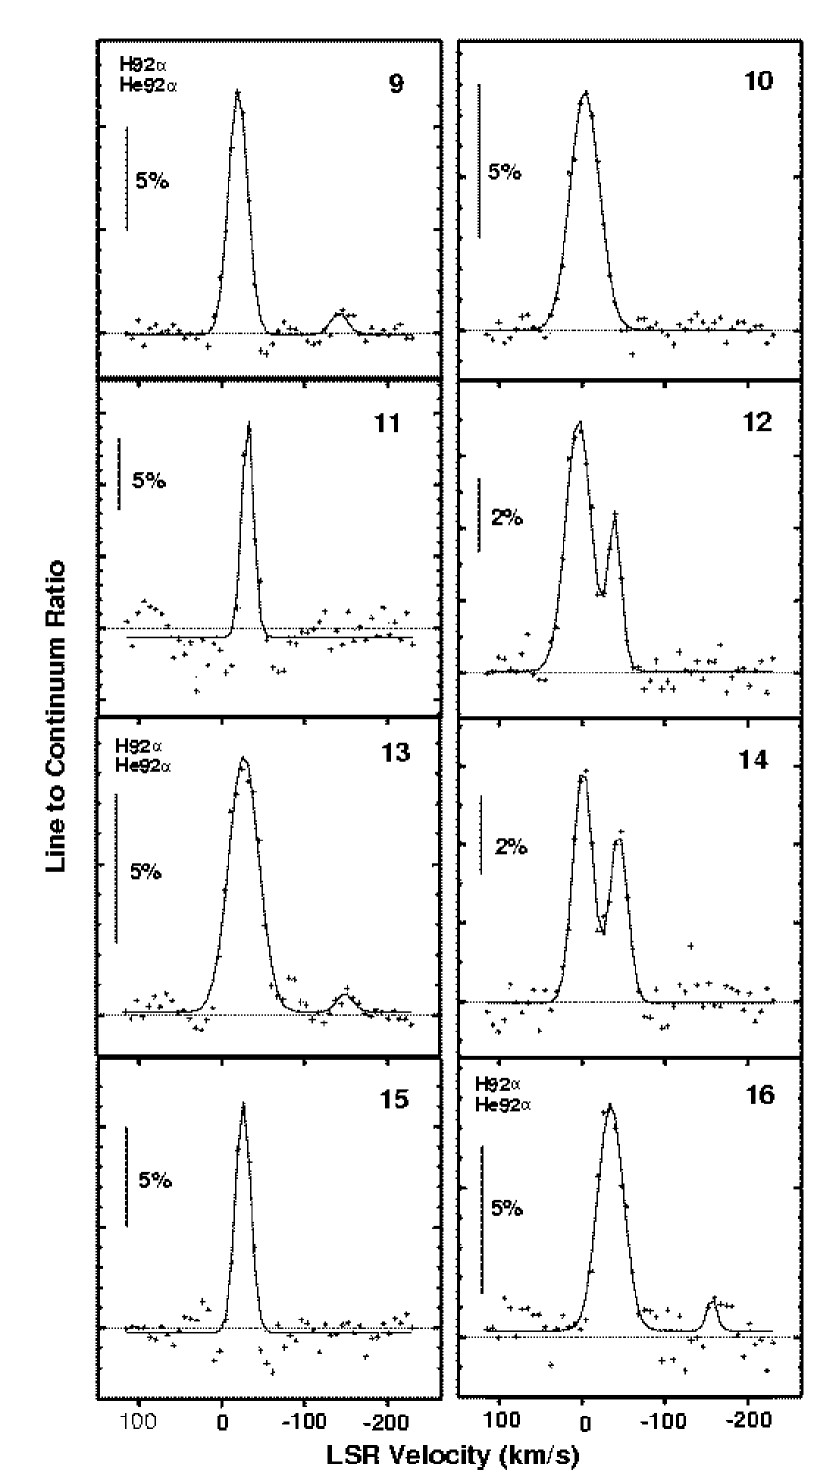
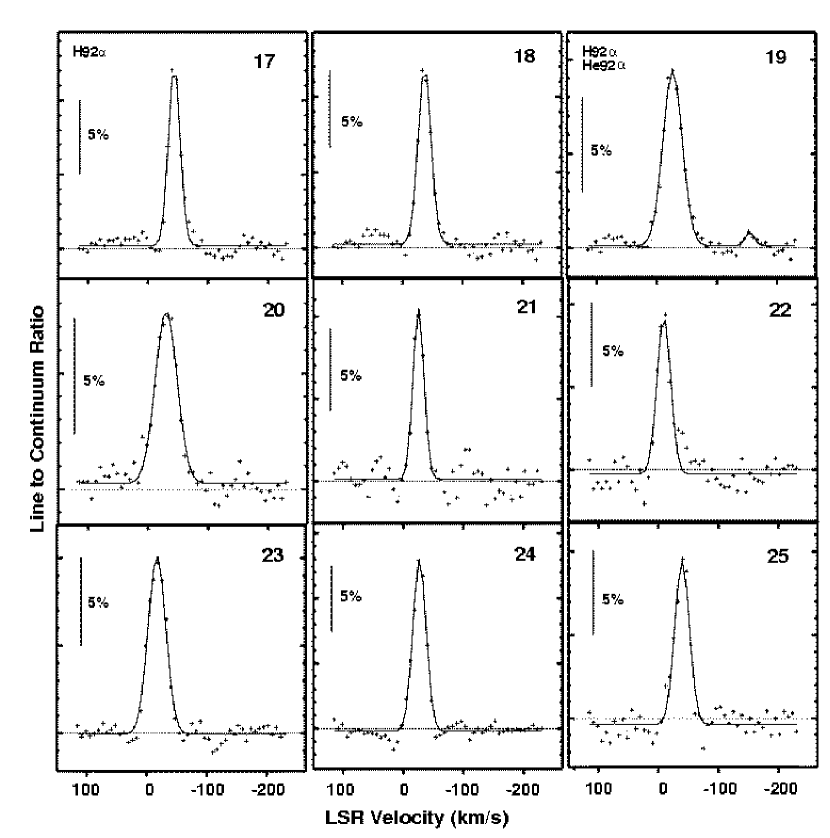
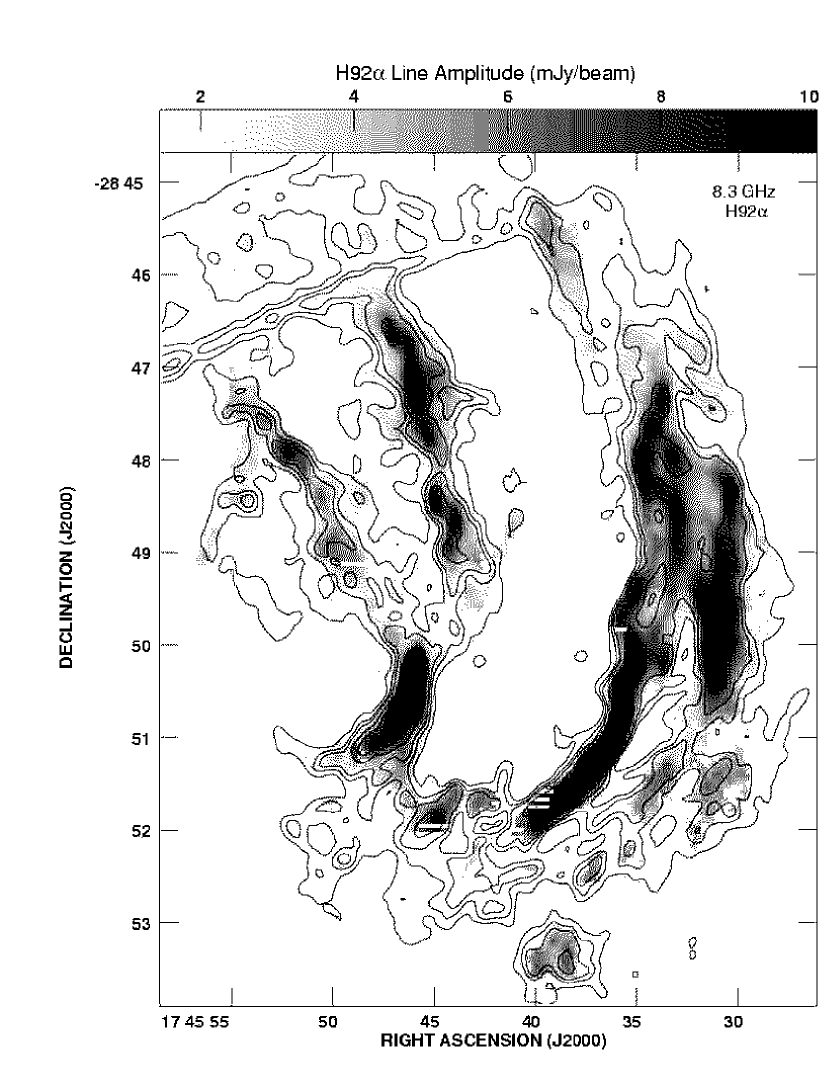
The H92 line was also sampled on smaller scales at 25 positions within the Arched Filaments, representing the well-defined emission complexes illustrated in Figure 7. These 25 H92 profiles, also spatially-integrated and continuum-weighted, are presented in Figures 8-10, and the corresponding Gaussian properties of these profiles are listed in Table 7. In order to examine the spatial variation in the H92 line properties in further detail, single-component Gaussians were fit to each pixel having a flux density above a 4 level. The resulting spatial distribution of line amplitude, FWHM line width, and LTE electron temperature (derived from the measured values of Tl/Tc and V), are presented in Figures 11-13.
The H92 recombination line flux densities have peak values in the range of 3 to 25 mJy beam-1. The strongest H92 emission (25 and 23 mJy beam-1) occurs at the continuum peaks G0.07+0.04 and G0.10+0.02. As shown in Figure 11, the H92 line emission follows the continuum emission closely, including the substructure and multiplicity of filaments apparent along the length of W1. The northern boundary of the H92 emission in the Arched Filaments coincides with the NTFs in the Radio Arc. The emission abruptly declines toward the southernmost NTF in the Radio Arc, with the exception of an H92 line arising from a small region in the Radio Arc north of E2 (Profile 1). To the South, the H II region known as H5 (E & W) (Profile 16) represents the southernmost source of H92 line emission in our data; this source has been studied in detail by Zhao et al. (1993).
Detections of the He92 line have been made at the 23 level in several regions of the Arched Filaments (Profiles 7, 9, 16 & 19). Values of Y+ range from 48% in these regions, consistent with other radio recombination line studies of Galactic center H II regions, which typically show Y+5% (Mehringer et al. 1993; Roberts & Goss 1993; Lang et al. 1997). The only known enhancement of He92 in this region is the detection of Y+=146% in portions of the Pistol nebula (Lang et al. 1997), thought to be metal-enriched ejecta from an earlier evolutionary stage of the Pistol star (Figer et al. 1998).
| Region | Tl/Tc | VLSR | V | T | TD |
|---|---|---|---|---|---|
| No. | (km s-1) | (km s-1) | (K) | (K) | |
| 1 | 0.090.01 | 20.91.1 | 22.12.5 | 6800700**Corrected for the 40% non-thermal continuum due to the NTFs in the Radio Arc. | 105001200 |
| 2 | 0.150.01 | 29.90.7 | 22.41.6 | 5500700 | 10800800 |
| 3 | 0.12.009 | 39.10.6 | 28.61.6 | 5400500 | 177001000 |
| 4 | 0.160.01 | 20.00.4 | 15.81.0 | 7100800 | 5400400 |
| 5 | 0.08.007 | 8.40.7 | 29.41.8 | 7500800 | 187001200 |
| 6 | 0.11.008 | 18.00.4 | 17.51.0 | 8900900 | 6600400 |
| 7 | 0.080.01 | 17.01.4 | 32.00.9 | 70001000 | 22100700 |
| 8 | 0.070.005 | 26.61.1 | 35.02.0 | 5000500**Corrected for the 40% non-thermal continuum due to the NTFs in the Radio Arc. | 265001500 |
| 9 | 0.12.006 | 19.80.4 | 26.81.0 | 5700400 | 15300600 |
| 10 | 0.08.003 | 3.40.5 | 41.01.2 | 5600300 | 363001800 |
| 11 | 0.170.02 | 33.00.7 | 16.71.7 | 6400900 | 6000600 |
| 12 | 0.07.004 | +4.30.6 | 36.01.7 | 5800800 | 280001400 |
| … | 0.04.005 | 39.20.8 | 18.91.9 | … | … |
| 13 | 0.09.005 | 28.10.6 | 42.41.6 | 5000300 | 390002000 |
| 14 | 0.06.005 | 1.00.8 | 27.61.9 | 5600800 | 165001100 |
| … | 0.04.005 | 43.91.0 | 25.52.5 | … | … |
| 15 | 0.120.01 | 25.70.6 | 21.41.2 | 6900600 | 10000600 |
| 16 | 0.08.007 | 34.41.0 | 35.82.4 | 6300600 | 280001900 |
| 17 | 0.12.007 | 43.60.4 | 22.60.9 | 6700500 | 11000500 |
| 18 | 0.12.006 | 36.80.4 | 25.20.8 | 6000400 | 14000500 |
| 19 | 0.09.004 | 26.40.4 | 37.41.1 | 5500500 | 300001200 |
| 20 | 0.08.004 | 28.20.7 | 42.61.6 | 5500300 | 392001500 |
| 21 | 0.100.01 | 25.70.6 | 21.71.5 | 6400700**Corrected for the 40% non-thermal continuum due to the NTFs in the Radio Arc. | 10200700 |
| 22 | 0.100.01 | 8.60.7 | 25.81.8 | 6900800 | 144001000 |
| 23 | 0.10.005 | 17.30.5 | 34.41.2 | 5400300 | 260001000 |
| 24 | 0.13.006 | 27.00.4 | 25.90.8 | 5500300 | 14500500 |
| 25 | 0.10.008 | 39.60.7 | 28.41.7 | 6400600 | 170001000 |
4.1 Physical Conditions of the Ionized Gas
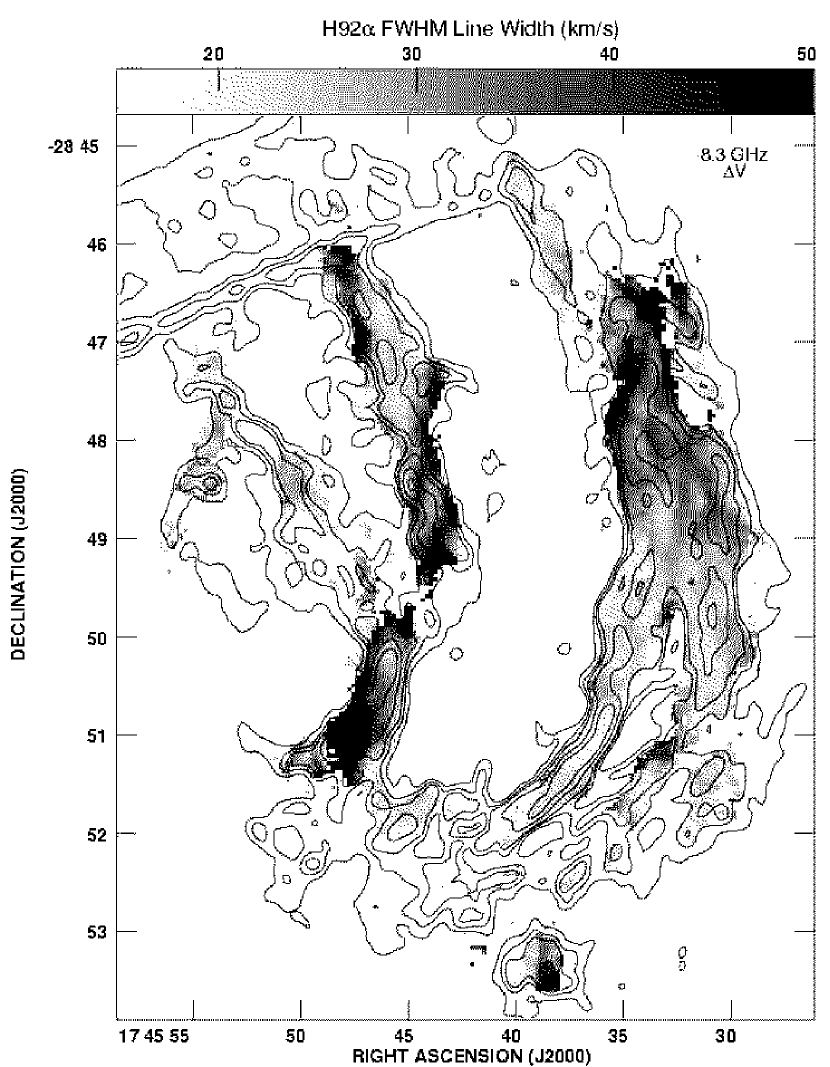
The line-to-continuum ratios across the Arched Filaments range from 0.04 to 0.17, with an average value of 0.11 (Table 7), consistent with a typical line-to-continuum ratio in the H92 line of 0.1 (calculated by assuming typical LTE conditions for Galactic center H II regions: V30 km s-1 and Te∗6000 K). The FWHM line widths in the Arched Filaments range from 15 to 44 km s-1, with an average value of 28 km s-1, similar to the radio recombination line widths observed for other Galactic center H II regions (V27 km s-1 in a survey by Downes et al. 1980; V33 km s-1 in SgrB1 by Mehringer et al. (1992); and V35 km s-1 in the Sickle and Pistol by Lang et al. (1997)). Typically, the line widths in Table 7 with values 35 km s-1 (corresponding to Profiles 10, 13, 19, & 20) are due to the substantial velocity gradients present over the integration regions. Figure 12 also illustrates that over most of the Arched Filaments, the line widths are 2030 km s-1. In a few places, the line widths exceed 50 km s-1. These positions are the sites of double profiles, and therefore the broad line widths are likely due to a poorer fit by a single Gaussian component.
4.1.1 Electron Temperatures
LTE electron temperatures, T, are calculated for the 25 regions, based on the measured values of Tl/Tc, V, and an assumed value of Y+=0.06 (eq. [22]; Roelfsema & Goss 1992). Although the He92 line was only detected in some regions of the source, this average value was used for all the regions, since T depends only weakly on Y+; assuming a value of Y+= 0 only increases T by a few percent. To determine the importance of non-LTE effects, the LTE departure coefficients (bn,n) are calculated based on average values of the electron density (ne 300 cm-3) and continuum optical depth (c0.0015) (see Table 4). The departure coefficients are used to derive non-LTE temperatures for several regions (eq. [23] of Roelfsema & Goss 1992). At most, the non-LTE temperatures are decreased by 2% from the LTE values. Therefore, the non-LTE corrections can be considered to be a negligible effect in the Arched Filaments, and we can assume that the emission occurs under LTE conditions. In addition, Shaver (1980) points out that for a given emission measure (EM), there is an observing frequency where the non-LTE effects can be considered negligible ( = 0.081 EM0.36 (GHz)). Following Shaver (1980), for the H92 line at 8.3 GHz, the EM corresponding to LTE conditions has a value of 3.8105 pc cm-6. The values of EM listed in Table 4 are in the range of 1.2 to 3.0105 pc cm-6, compatible with the assumption that the H92 lines in the Arched Filaments are emitted under LTE conditions.
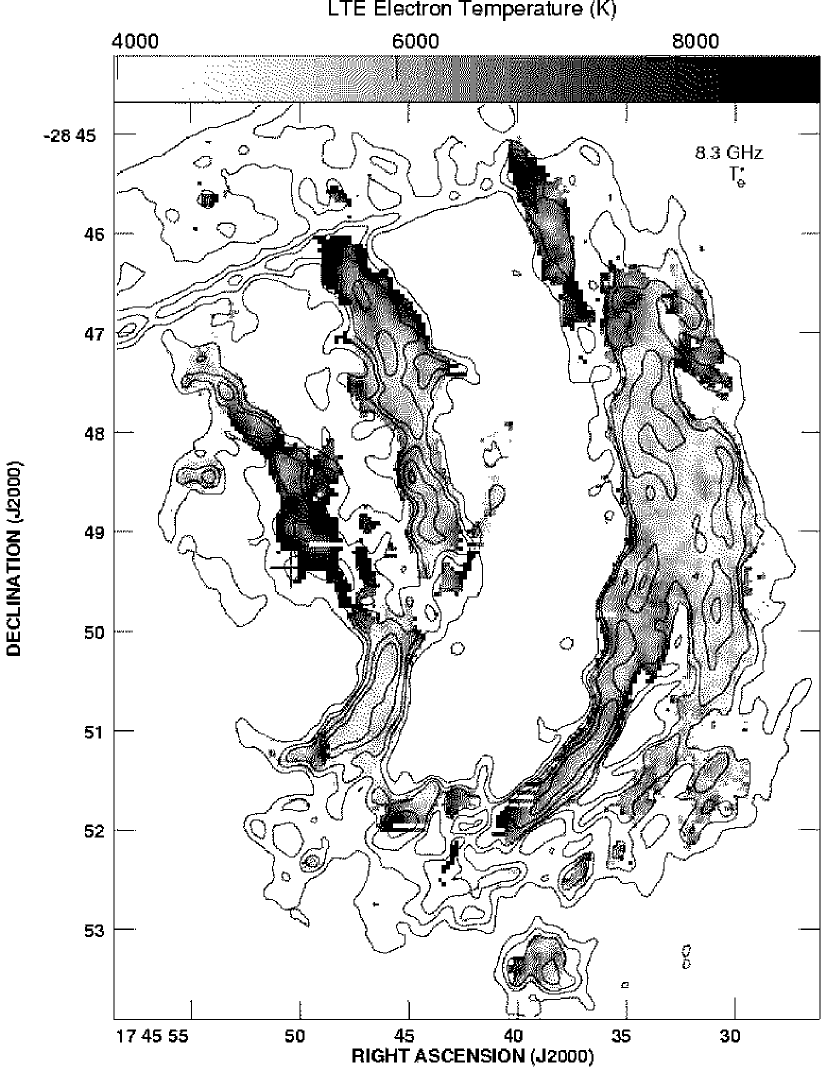
The values of T in the Arched Filaments range from 5000300 to 8900900 K, with an average value for the LTE electron temperature of 6200 K. Similar T have been measured in other H II regions in the Galactic center: 7000 K in SgrA West (Roberts et al. 1993), 6400 K in the “H” regions (Zhao et al. 1993), and 5500 K in the Sickle (Lang et al. 1997).
Several of the regions in the Arched Filaments (Profiles 4, 6, 11, & 12) show very narrow FWHM line widths (V20 km s-1) and represent some of the narrowest lines observed in Galactic center H II regions. Such narrow lines can place upper limits on the electron temperatures of the ionized gas. The Doppler temperature, TD, is defined by the line width for thermal motion in the absence of turbulence and pressure broadening (TD=21.8 (V)2 K, where V is in km s-1). Narrow line widths have been observed in only a small number of sources and provide an important demonstration that electron temperatures as low as 40005000 K do exist in some nebulae (Shaver et al. 1979, 1983; Kantharia et al. 1998). Values of TD in regions where the lines are very narrow can be compared with T to check for consistency. For this comparison, values for TD in the 25 regions are listed in Table 7. The narrowest lines in the Arched Filaments (15.8, 16.7, and 17.5 km s-1) place upper limits on the electron temperatures in these regions of 5400400, 6600400, and 6000600 K respectively. In most of the regions of the Arched Filaments, the measured electron temperatures are consistent with the Doppler temperatures within the errors. In two regions (4 and 6) there is a discrepency (only two sigma) between the Doppler temperature and the measured T.
Figure 13 shows the distribution of T across the Arched Filaments. Over most of the source, the T are 6000 K, but along the northern edges of E2 and W1, and along the middle of the E1 filament (Regions 4, 5, 6, and 7), the T appear to increase up to 10,000 K. A likely explanation for the increased T in the northern portion of E2 and W1 is that the continuum emission in these regions is contaminated by the non-thermal contribution of the NTFs in the Radio Arc; the line-to-continuum ratio is therefore underestimated, and Te is therefore overestimated, since Te (Tl/Tc)-0.87. By measuring the continuum emission in a region of the Arched Filaments adjacent to the Radio Arc NTFs, we estimate that 40% of the continuum at the positions of the NTFs is nonthermal, and we correct the values of Tl/Tc and T accordingly. Similar corrections were made to the line-to-continuum ratios in the Sickle H II region, where the values were significantly reduced due to the non-thermal contribution from the NTFs in the Radio Arc, which intersect the H II region at several positions (Lang et al. 1997).
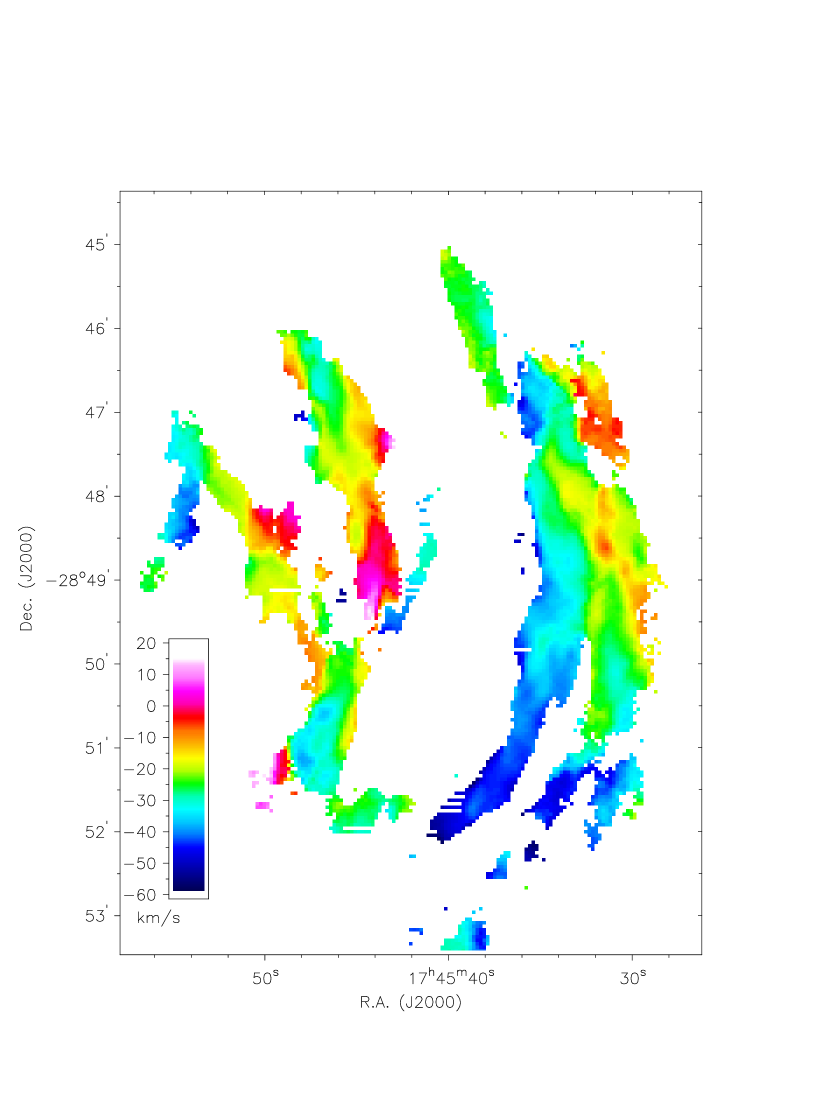
4.2 Velocity Field
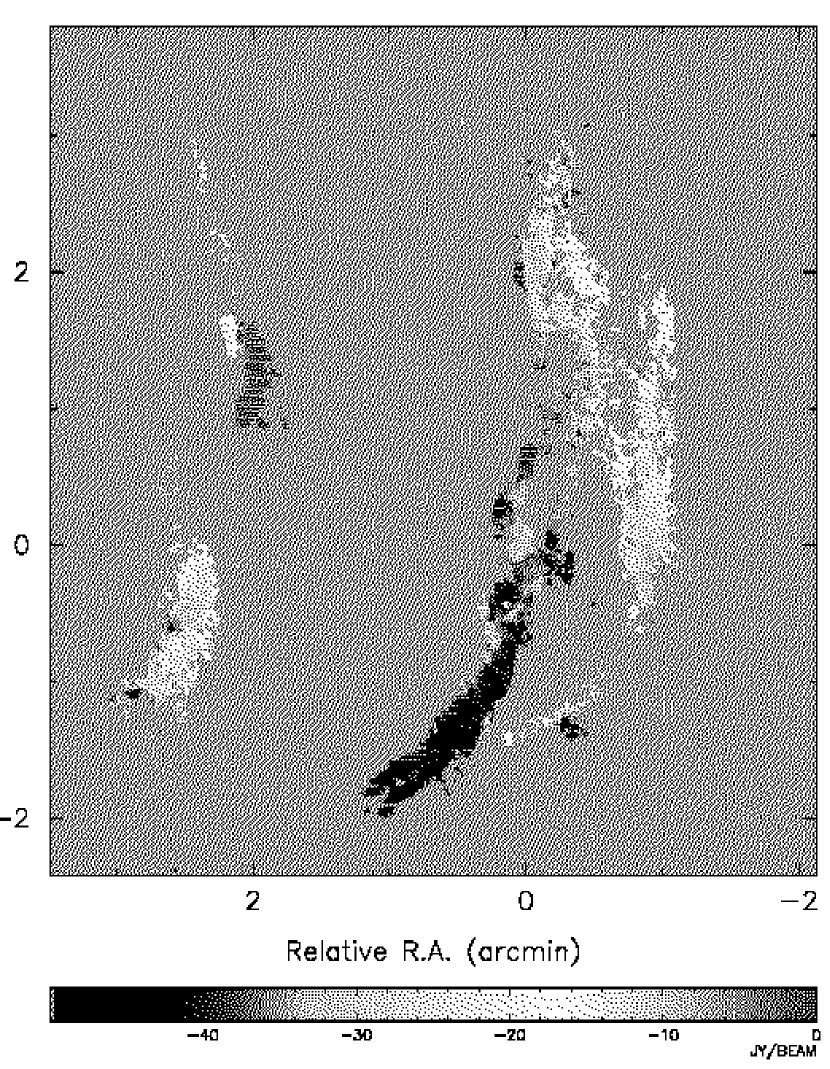
Figure 14 shows the distribution of central velocities in the Arched Filaments, which range from 70 to +15 km s-1. The most impressive feature of Figure 14 is the presence of remarkable velocity gradients along the extent of each of the Arched Filaments. Figures 15-17 show position-velocity diagrams for each filament (W1, W2, E1, E2, and G0.10+0.02). These diagrams were created to illustrate velocity as a function of position following closely the ridges of emission in each case. The velocities were sampled starting at the northernmost point (see captions for Figures 15-17) and continuing southward along each filament. The sense of the velocity gradient in W1 and W2 can be characterized by increasingly negative velocities southward along both filaments. Figures 15 a and b show that the velocities steadily decrease from 10 km s-1 to 60 km s-1 in both cases. The most negative H92 line emission in the Arched Filaments (V 50 km s-1) occurs at the southern extents of W1 and W2, in the vicinity of ,(J2000)=17 45 36.0, 28 51 30.

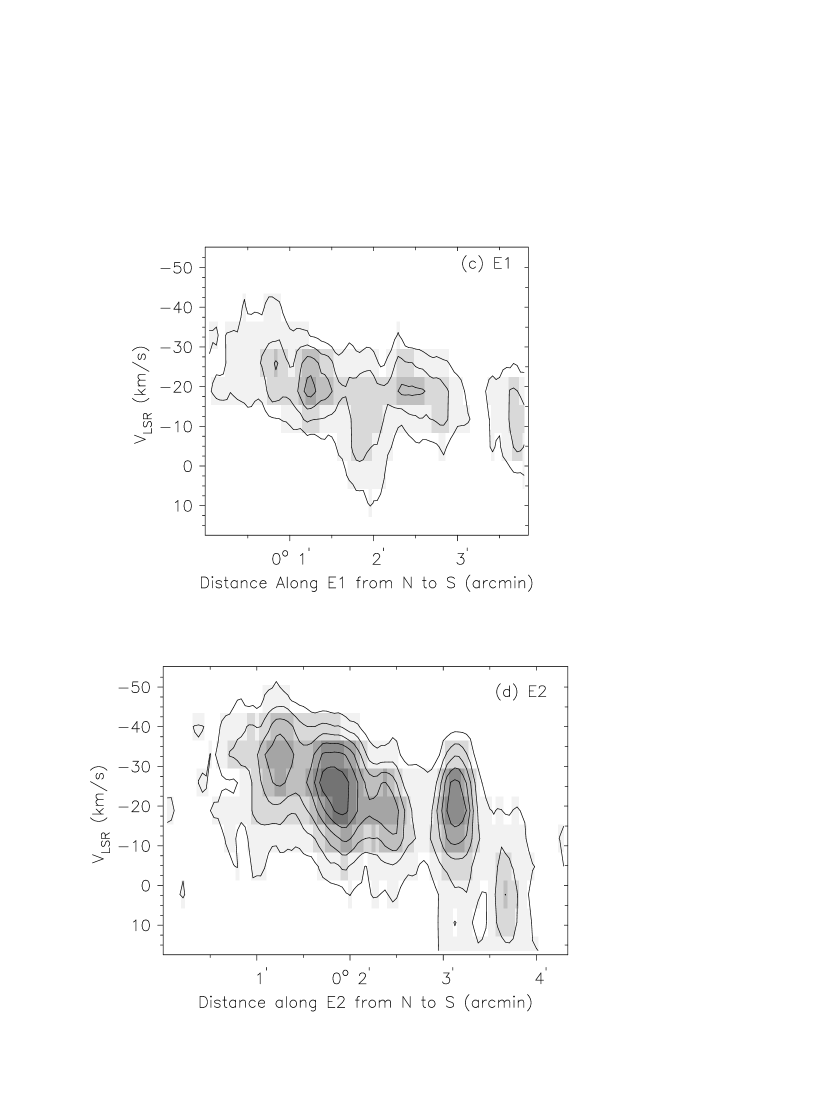
The velocity structure in E1, E2, and G0.10+0.02 is more complex, and the velocity gradients do not have the same sense, or the same degree of continuity, as those in the W filaments. In the northernmost region of E1, a small spur of line emission which is oriented nearly perpendicular to the eastern edge of the filament (at ,(J2000)=17 45 54.3, 28 48 10) has velocities which are more negative than in the rest of the filament (V40 km s-1 in the spur compared with 20 km s-1 across E1). The velocity in this spur decreases southward along its length, similar to the sense of the gradient in W1 and W2. In the middle of E1 the velocities can be characterized with values of 15 to 0 km s-1, which become only slightly more negative (V20 km s-1) in some regions to the south. Over parts of E1, the gradient has the same sense as W1 and W2, but most of the ionized gas has velocities which are less negative than those in the W filaments.
The sense of the velocity gradient in E2 is nearly opposite to that in the W filaments; the velocities become more positive southward along E2 (Figure 16d). In fact, there are several concentrations of positive velocity emission in E1 and E2, which are not present in the W filaments. The most extreme positive velocities in the Arched Filaments (V+10 km s-1), occur along the southern edge of E2. At this position (,(J2000)=17 45 42.6, 28 49 30), there is also a spur of negative velocity emission located on the west side of E2 and extends over 2′ (5 pc). The velocity gradient along this component has the same sense as in the W1 and W2 filaments.
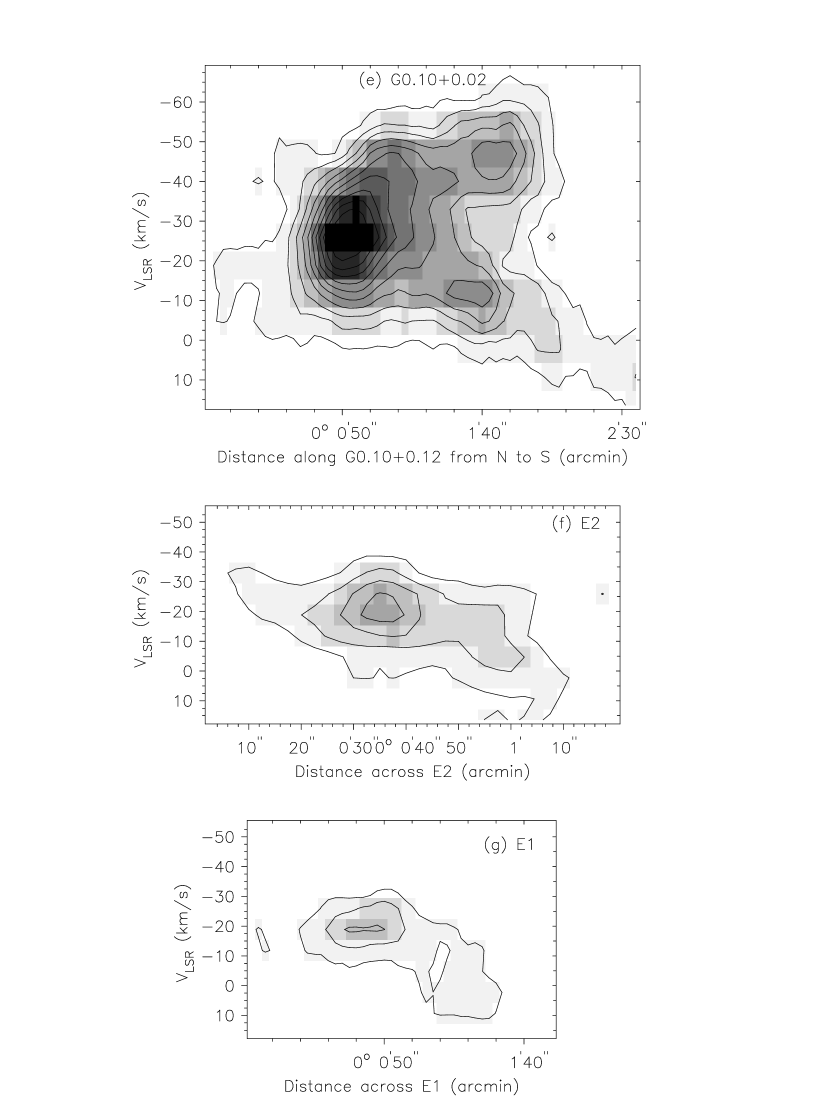
G0.10+0.02 has velocities which range from about 20 km s-1 near its northern portion, to values which are increasingly more negative (40 km s-1) along its southern extent, also resembling the gradients in W1 and W2. In addition, G0.10+0.02 has an unusual spur of positive velocity emission located at its southeastern edge.
The magnitudes of the velocity gradients vary across the Arched Filaments and represent some of the most extreme and coherent gradients in the Galaxy. In W1, the velocity smoothly decreases from N to S, equivalent to a change of 40 km s-1 over 7′, or 2.3 km s-1 pc-1. Along W2, a gradient of 5 km s-1 pc-1 is present in the N-S direction. In E2, the velocity ranges from 30 km s-1 to +20 km s-1, corresponding to a velocity gradient of 7 km s-1 pc-1, whereas in the E1 filament, the velocity varies by 2.4 km s-1 pc-1 in the N-S direction. The velocity gradients with the largest magnitude in E1 and E2 occur in a direction perpendicular to the long axis of the filament. Figures 17f and g show position-velocity diagrams for slices of 1′15 (2.53.8 pc) length taken across E1 and E2 in a direction nearly perpendicular to the long axis of the filament where it is apparent that the velocities are changing rapidly. In both cases the gradients in this direction are 16 km s-1 pc-1 , several times larger than the gradients observed in the N-S direction in the other filaments. The velocity gradients in the Arched Filaments are only surpassed in magnitude by the nearby ionized streamers of SgrA West, which surround the nuclear black hole, SgrA∗, and have velocities varying from 200 km s-1 to 200 km s-1 over 3 pc (Roberts & Goss 1993).
4.2.1 Double-Peaked H92 Profiles
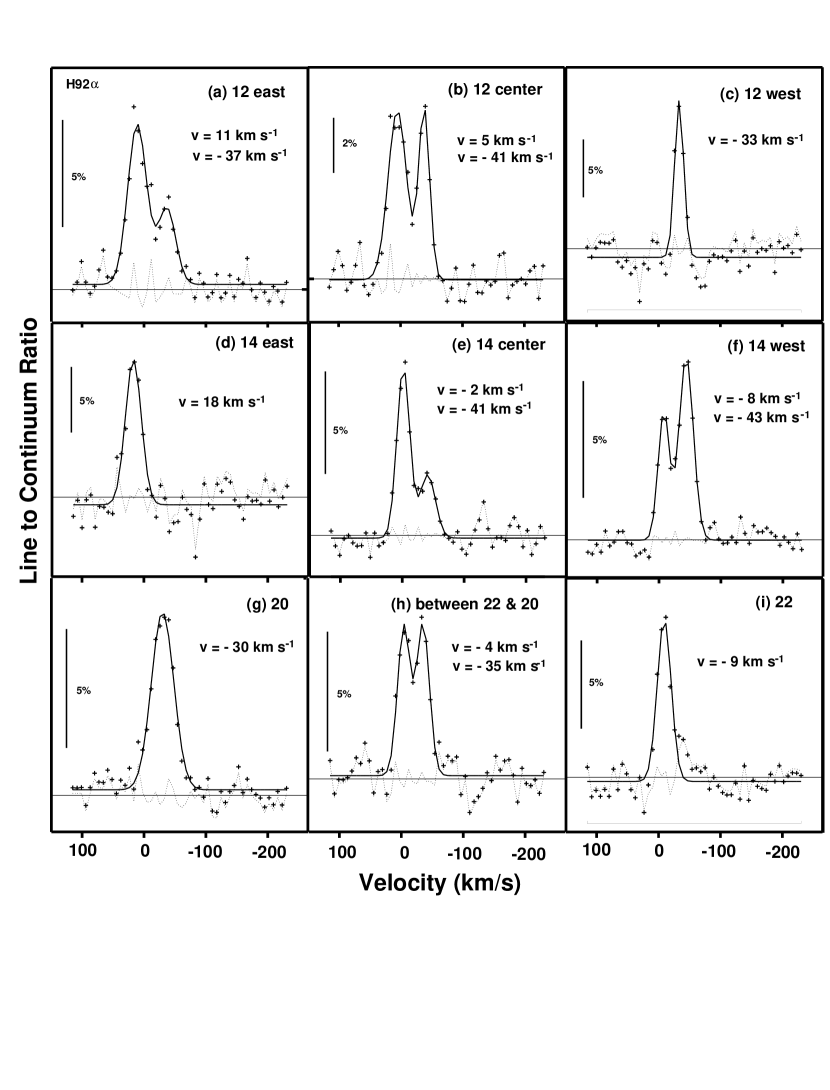
Three of the profiles have double-peaked structure: Regions 12 and 14, as well as a a double profile between Regions 20 and 22 (at ,(J2000)=17 45 33.5, 28 47 30). At each of these positions there are large differences in the velocities of adjacent filaments as can be seen in Figure 14. The double profiles in the Arched Filaments do not have a systematic or symmetric distribution across any part of the source, such as might be indicative of an expanding, H II shell. Therefore, it appears that the double profiles simply occur at the interfaces of two gas components which have different velocities. These velocities, however, are consistent with the previous velocity results presented above.
Figure 18 illustrates that a simple superposition of ionized gas components which have largely different velocities can explain the double profiles in all three regions. Figure 18 shows three integrated profiles from each of these double-peaked regions; each profile has been sampled at 15″ intervals from east to west across the region (corresponding to left to right in Figure 12). The central profile in Region 12 (Figure 18 b) shows a double profile with velocities of +5 km s-1 and 41 km s-1. In the east and west parts of Region 12 (Figures 18 a and 18 c), the dominant components of velocity are +11 km s-1 and 33 km s-1, respectively, which appear to correspond to the two velocity components apparent in Figure 18. The positive velocities likely arise from the ionized gas in the adjacent part of E2, which is characterized by a similar velocity range (+5 to 5 km s-1). The negative velocity emission arises from a negative velocity spur located to the south and east of E2 (Region 11) which was previously discussed and found to have velocities in the range of 30 to 45 km s-1. A similar pattern is detected in the double components of Regions 14 and between W1 and W2. The eastern portion of Region 14 (Figure 18d) is characterized by a positive velocity (V=18 km s-1), in contrast to the negative velocity (40 km s-1) in the western part of this region (Figure 18e). At this position, the superposition of the negative-velocity emission in G0.10+0.012 and a positive-velocity component produces the two peaks in Profile 14. The position-velocity diagram of G0.10+0.02 (Figure 17e) also shows the two velocity components which differ by 60 km s-1. There is a large velocity gradient in this positive-velocity component and the velocities range from +20 to 10 km s-1. The two peaks in Figure 18 h have velocities of 4 and 35 km s-1, corresponding closely to the central velocities of the W1 and W2 filaments (Figures 18g and 18i). The presence of such double-peaked profiles illustrates that this H II complex consists of a series of independent filaments of ionized gas having different kinematics and different displacements along the line of sight.
4.3 High Resolution H92 Line Observations
The CnB and DnC array observations of a single field in the southwestern portion of the Arched Filaments were combined to produce a higher resolution (36 27, PA=45°) H92 line cube. This region was chosen since it has strong emission and contains the intersection of the Northern Thread NTF with both the W1 and W2 filaments. Figure 19 shows the distribution of H92 emission in this region in greyscale, with 8.3 GHz continuum contours. The strongest emission arises from along the W1 filament, in a series of “knots”, with most of the emission concentrated at G0.07+0.04. The emission along the rest of W1 is tenuous, and along portions of W1, the line emission is dramatically edge-brightened, so that the center of the filament appears hollow. The velocity field of the high resolution data (Figure 20) resembles the overall structure of the lower resolution image (Figure 14). The velocity gradients in the W1 and W2 filaments are consistent with those measured in the lower resolution data: 2 to 4 km s-1 pc-1.
At the locations of intersection between W1, W2 and the Northern Thread NTF, there do not appear to be any significant changes or discontinuities in the line properties (FWHM line width or velocity field). If there were significant discontinuities, this would indicate that a physical interaction is taking place between the ambient magnetic field and the ionized gas. However, the velocity along the southern portion of W1 varies as smoothly as in the lower resolution data (Figure 14), becoming increasingly negative toward the southern extent of the filament. In fact, the central velocity changes more abruptly in the northern portion of W2, where values range from 0 km s-1 to 35 km s-1 over several pc. Thus, large disturbances in the velocity field at the positions of projected intersection with the Northern Thread NTF are not observed.
5 Discussion
5.1 Morphology
The close correspondences between the velocities and morphology of the ionized and molecular gas in the Arched Filaments that Serabyn & Güsten (1987) illustrated indicate that the Arched Filaments represent the ionized edge of the 30 km s-1 cloud. The Arched Filaments therefore derive their morphology in part from the distribution of molecular gas. Tidal disruption due to the large differential gravitational forces near the Galactic center is likely to have influenced the morphology of the 30 km s-1 cloud. In fact, Serabyn & Güsten (1987) propose that this molecular cloud is just at the stability limit for tidal disruption (n5 104 cm-3 for a radius of 30 pc) and has become tidallly unstable as it has fallen in toward the Galactic center from an outer radius. The elongated morphology of the Arched Filaments therefore can be ascribed in part to such tidal shearing of the cloud, given that the overall length of the filaments (20 pc) is comparable to their projected radial displacement from the Galactic center (25 pc). The CS emission in the inner 0.5-1° from the survey of Bally et al. (1988) shows that the clouds in this region are elongated along the Galactic plane, whereas at 15, the clouds are oriented orthogonal to the plane.
Other evidence for shearing of the cloud includes the orientation of the magnetic field in the Arched Filaments, traced by the far-IR polarization vectors (Morris et al. 1992; Morris et al. 1995). The inferred magnetic field orientation is aligned along the length of the filaments, suggesting that shearing occurs in a direction parallel to the filament long axis. This conclusion can be drawn for any arbitrary initial magnetic field geometry as long as the kinetic energy density in the shear motions exceeds the energy density in the magnetic field, in which case the magnetic field will be deformed until it is oriented in a direction parallel to the shearing (Morris et al. 1992). Of course, the location of the ionizing source in relation to the molecular cloud will also affect the morphology of the Arched Filaments.
Several clues suggest that the ionized gas in the Arched Filaments is likely to be on the near edge of the molecular cloud. Observations of the Brackett- line at 2.166 m reveal an extinction toward the Arched Filaments consistent with the general extinction toward the Galactic center, indicating that the ionized gas is on the near side of the molecular cloud (Figer 1995; Cotera et al. 2000). These results are consistent with the fact that the observed H92 velocities are blueshifted at some locations relative to the velocities of the molecular gas at the same positions (Serabyn & Güsten 1987). A further, more detailed study of the relative locations and velocities of ionized and molecular gas in the Arched Filaments is the subject of Paper II (Lang et al., in prep.).
5.2 Kinematics
The H92 line observations provide several important clues for understanding the kinematics and velocity field of the ionized edge of this peculiar molecular cloud. From these data we have deduced the sense and the magnitude of the velocity gradients at several positions across the source. The velocity gradients along the W1 and W2 Arched Filaments are well-organized and remain coherent over extents as large as 20 pc. It therefore seems appropriate to describe the velocity field of the Arched Filaments in terms of the orbital motion of the larger, underlying molecular cloud about the Galactic center.
5.2.1 Possible Orbits
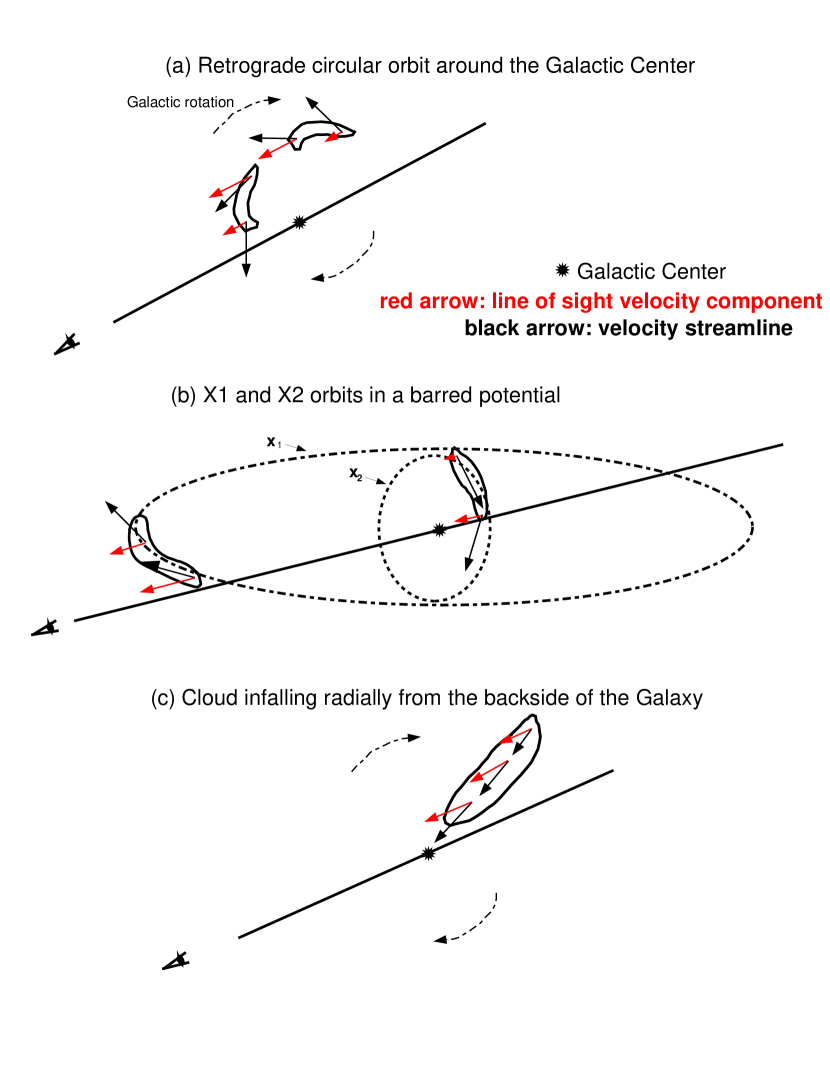
Retrograde Circular Orbit. A simple possibility is to place a tidally-stretched molecular cloud on a circular orbit with a direction of motion counter to Galactic rotation, consistent with the negative velocities of both the ionized and molecular gas. The origin of such a retrograde cloud is unknown, but Serabyn & Güsten (1987) propose that it has infallen from a large radius and has been streched in the process. In the presence of the large gravitational potential gradient near the Galactic center (where, at 30 pc, the total enclosed mass is 2 108 M☉; Genzel & Townes 1987), a cloud will be sheared in a direction perpendicular to the gradient in the potential and will become elongated in that direction. The schematic shown in Figure 21a illustrates two possible locations of this cloud on a counter-rotating orbit about the center of the Galaxy. As a result of shearing, the leading edge of the cloud is closest to the center of the Galaxy. The black arrows represent the velocity streamline of the molecular cloud, whereas the red arrows represent the observable, line-of-sight velocity component. The measured velocities along most of the Arched Filaments are increasingly negative in a direction along the filament toward the Galactic center. As shown in Figure 21a, the sense of the velocity gradient resulting from a cloud on such an orbit is exactly opposite to the observed H92 line gradients. Therefore, the kinematics of the 30 km s-1 cloud cannot be explained by retrograde circular motion.
Molecular Cloud Orbits in a Central Barred Potential. Observations of the distribution of stellar and gaseous material in the central kiloparsec of the Galaxy indicate the presence of a stellar bar with a co-rotation radius of about 2.4 kpc, and an estimated orientation of 1520° to the line of sight (Morris & Serabyn 1996, and references therein). Such a non-axisymmetric component in the Galaxy’s potential will lead to clouds following elongated, and therefore non-circular, orbits about the Galactic center (Binney et al. 1991). These authors propose that clouds in the presence of such a potential will first shear, and then move onto a set of closed orbits, slowly migrating to orbits of lower energy as they lose angular momentum. The two families of orbits include those inbetween the co-rotation radius and the inner Lindblad resonance, known as the “x1” orbits (on which gas approaches the center of the barred potential) and those which are nested deeper in the potential well, known as the “x2” orbits (Contopolous & Mertzanides 1977). Figure 21b shows a schematic of the x1 and x2 orbits with a molecular cloud placed on each so that the sign of the Galactic longitude, the sign of the velocity, and the sense of the gradient in the cloud are consistent with the H92 observations. The cloud on the x2 orbit is located on the far side of the Galactic center and has a larger negative velocity component arising from the portion closer to the Galactic center than the trailing edge. The cloud on the x1 orbit is positioned at the near extremity of its orbit along the line of sight, so that the leading edge is leaving our sight line, producing the sense of the velocity gradient that is observed. Both orbits can explain the so-called “forbidden” velocities of the 30 km s-1 molecular cloud, but it is necessary to further distinguish between them.
Radially Infalling Molecular Cloud. Yet another possibility is that the molecular cloud is infalling radially from a larger radius behind the Galactic center and is thereby stretched in the radial direction. Figure 21c shows a sketch of this possibility. For this scenario, the sign of the velocity and the sense of the velocity gradient are consistent with the H92 data in three of the four Arched Filaments (E1, W1, W2). However, the sense of the velocity gradient in E2 is exactly opposite to these (that is, the velocities increase southward along the filament).
5.2.2 Comparison with Observed Kinematics
In order to determine whether the velocity field in the Arched Filaments can be ascribed to the x1 or x2 family of orbits, or to a radially infalling molecular cloud, one can compare the magnitude of the predicted velocity gradient for these scenarios to that measured from the H92 data.
In the case of the x1 and x2 orbits, it is possible to compare the H92 velocity gradients with the values from the simulated position-velocity (,v) diagrams of Jenkins & Binney (1994), which represent gas flows in the central Galaxy. These authors have supplemented the orbital models of Binney et al. (1991) by carrying out sticky-particle simulations of the molecular clouds on the x1 and x2 orbits, in order to include the hydrodynamical effects of the collisions of such clouds in the inner Galaxy and the subsequent exchange of mass and momentum. Their simulated (,v) plots reproduce some, but not all aspects of the 13CO parallelogram from the Bell Labs survey (Bally et al. 1988). The gradients measured in H92 along W1 and W2 have magnitudes of 27 km s-1 pc-1, which have increasingly negative velocities for decreasing longitude on the positive longitude side of the Galaxy, can be compared with Figure 12 of Jenkins & Binney (1994), which shows the resulting (,v) diagram for the end-point (near steady state) of their simulation at a viewing angle of 10° to the long axis of the bar. The velocity gradients in the corresponding region of their Figure 12 are in the range of 0.51 km s-1 pc-1 for the x2 orbits, and 0.10.2 km s-1 pc-1 for the x1 orbits. The x2 orbits have velocity gradients closest in magnitude to those measured in the H92 data, yet the models underestimate what we measure by at least a factor of two. Jenkins & Binney (1994) suggest that their simulated (,v) diagram for an intermediate time (0.4 Gyr; their Figure 6) better reproduces several of the features in the CO parallelogram; the x2 orbits at that time have a velocity gradient of 12 km s-1 pc-1, in better agreement with what is measured, though still somewhat low.
In the case of the radially infalling cloud, the velocity gradient is established as a result of the radial extent of the cloud, since the infall velocity is primarily a fixed function of radius. It is possible to calculate the work done by the central gravitational potential on a parcel of infalling gas, and thereby to estimate the resulting velocity gradient. Using the mass distribution of Genzel & Townes (1987), MG(r)=2 108 M☉ , the expected velocity gradient at a Galactic radius of r=25 pc due to infall is 6.4 km s-1 pc-1. This value is consistent with the magnitudes of velocity gradients measured along the W2 and E2 filaments (5 km s-1 pc-1 & 7 km s-1 pc-1), and is of the same order of magnitude as the velocity gradients measured in all four filaments. Both the x2 orbit and the radially infalling cloud, however, have difficulty explaining the opposite sense of the velocity gradient in E2 without invoking a different orientation for this filament. In addition, the 16 km s-1 pc-1 gradients which are measured in E1 and E2 in a direction perpendicular to the filaments also can not be easily explained by the two scenarios without some alteration of the filament geometry.
Although large portions of the H92 velocity data are well-matched with the radially infalling cloud scenario, the possibility that this cloud resides on an x2 orbit should not be completely ruled out, since some of the smaller gradients are also consistent with the gradients predicted for the x2 family of orbits. On the other hand, the x1 orbits can probably be ruled out, since they underestimate all measurements of the gradient by an order of magnitude or more. Both Binney et al. (1991) and Jenkins & Binney (1994) suggest that the giant and dense Galactic center molecular clouds (for example, the Sgr A, B and C cloud complexes) are likely to reside on the x2 orbits. In addition, the CS emission, which traces the dense populations of clouds, overlaps in the (, v) plane very clearly with the family of x2 orbits and is not consistent with the x1 orbit group (Bally et al. 1988). The kinematics of the Arched Filaments are therefore best described by a cloud residing on an orbit that is intermediate in its properties between an x2 orbit and pure radial infall. Determining the distance to the 30 km s-1 cloud relative to the bulk of stars in the bulge will help to further distinguish the properties of the cloud orbit. Using a model for the stellar distribution in the inner Galaxy and comparing with images of the near-infrared extinction can provide information on the distance to the 30 km s-1 cloud. However, currently available extinction studies of the Arched Filaments region do not provide adequate resolution for this determination (Schultheis et al. 1999), but a future study will address this question in detail.
5.3 Ionization of the Arched Filaments
The H92 observations of the Arched Filaments show that the physical conditions in the ionized gas (line-to-continuum ratios, FWHM line widths, and T) are similar to those found in other Galactic center H II regions, such as SgrA West (Roberts & Goss 1991), the “H”-regions (Zhao et al. 1993), and the Sickle (Lang et al. 1997), which are all photoionized by nearby massive stars. The Arches Cluster is a stellar cluster located at the base of the E1 filament, at ,(J2000)=17 45 50.4, 28 49 21.83, now thought to be among the most massive and dense clusters (Mtot104 M☉, 3105 M☉ pc-3) in the Galaxy, with an age of 2 Myr (Nagata et al. 1995; Cotera et al. 1996; Serabyn et al. 1998; Figer et al. 1999). Before the Arches cluster was well-studied, FIR and radio observations raised the question of whether it could be capable of providing the ionizing radiation necessary to account for the ionization of the Arched Filaments. Based on the uniformity of the FIR fine-structure line emission across the entire Arched Filaments region, Erickson et al. (1991) and Colgan et al. (1996) argue that additional stars, in excess of the G0.12+0.02 cluster as cataloged by Cotera et al. (1996), must be present and uniformly distributed, to account for the ionization of the gas. Similarly, using FIR spectroscopy, Timmermann et al. (1996) report that the G0.10+0.02 portion of the Arched Filaments has properties consistent with an H II region and with the adjacent, lower excitation, photodissocation region, but that additional stars are necessary to ionize all the filaments. Recent studies of the Arches cluster, however, indicate that the number of O-stars in this cluster exceeds 150 (Figer et al. 1999), likely to provide the ionizing radiation to account for the uniformity of the FIR ionization tracers. Based on infrared and radio observations, Morris et al. (2001) calculate the number of ionizing photons from the Arches cluster to be 4.4 1051 photons s-1, comparable to the estimate of Serabyn & Güsten (1998) based on a rough stellar census, and at least an order of magnitude more than the initial estimates from Cotera et al. (1996).
In order to determine whether the ionization of the entire Arched Filaments complex can be accounted for by the Arches Cluster, we compare the ionizing flux based on the 8.3 GHz continuum flux density with the ionizing flux intercepted by different portions of the Arched Filaments. As in 3, calculation of the requisite number of Lyman continuum photons (NLyc) is based on T=6200 K (except for the area of E1, which has T=8900 K) and ne=300 cm-3. We also assume that the solid angle subtended at the Arches cluster by each portion of the Arched Filaments can be scaled from the observed solid angle, and we assume initially that the distance between the portions of the Arched Filaments and the cluster is the projected distance. This latter assumption provides a lower limit to the ionizing flux; if the Arches cluster cannot explain the ionization at the projected distances to the filaments, then additional stars would be required. Table 8 lists the nine regions of the Arched Filaments (column one), the projected distance between the cluster and the region (column two), the dimensions on the sky of each region (column three), the number of Lyman continuum photons (NLyc) intercepted per second by this volume of gas, assuming that the cluster has an ionizing flux of 4.4 1051 s-1 (column four), the 3.6 cm continuum flux density of each region (column five), and the corresponding value of NLyc (column six).
| Region | Projected | Region | NLyc | Sν | NLyc | Total | LOS |
|---|---|---|---|---|---|---|---|
| Distance | Size | Intercepted | 8.3 GHz | Required | Distance | Distance | |
| to Cluster | (pc) | (photons s-1) | (Jy) | (photons s-1) | to Cluster | to Cluster | |
| G0.10+0.02 | 4.5 pc | 4.41.5 | 1.11050 | 2.0 | 1.51049 | 13 | 12 |
| G0.07+0.04 | 8.3 pc | 5.60.8 | 2.21049 | 1.9 | 1.41049 | 11 | 7 |
| E2S | 3.8 pc | 1.02.5 | 4.41049 | 1.0 | 7.31048 | 11 | 10 |
| W2 | 10.6 pc | 5.61.3 | 1.51049 | 1.8 | 1.41049 | 14 | 9 |
| E1N | 2.5 pc | 5.01.3 | 3.51050 | 0.6 | 4.01048 | 24 | 23 |
| W1 | 9.0 pc | 5.61.3 | 3.01049 | 1.1 | 8.71048 | 17 | 14 |
| W2N | 10.8 pc | 5.61.3 | 2.21049 | 0.7 | 5.31048 | 24 | 21 |
| E2N | 6.3 pc | 4.51.3 | 4.41049 | 1.4 | 1.01049 | 15 | 14 |
| E1 | 3.0 pc | 3.81.3 | 1.81050 | 0.7 | 4.51048 | 19 | 19 |
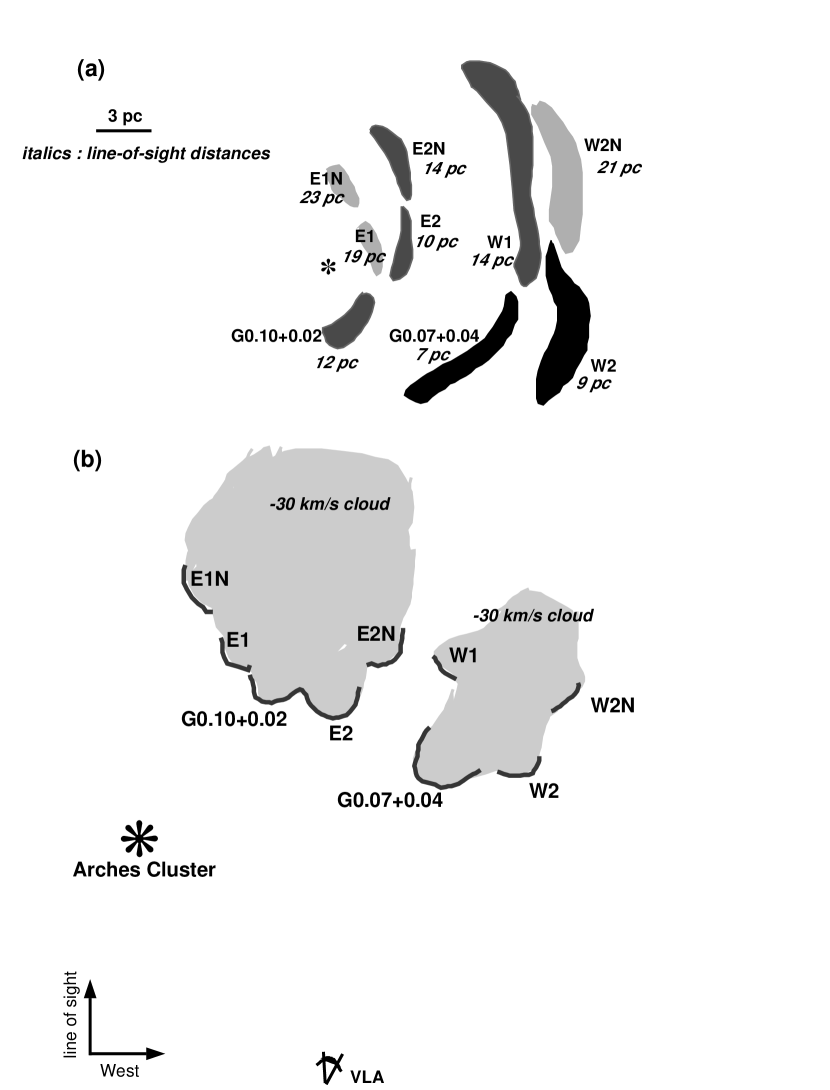
For all portions of the Arched Filaments, the available ionizing photons from the cluster are able to account for the ionization of the H II regions. In most cases, a substantial excess in the number of available ionizing photons exists compared with the number implied by the radio continuum. If the assumed ionizing flux of the cluster is correct, the excess ionizing flux indicates that the distance between the Arches cluster and the Arched Filaments must be larger than the projected distance. By assuming that the actual number of photons required is equal to the estimated intercepted photon flux, it is possible to solve for the line-of-sight component of distance for each portion of the ionized gas. These derived line-of-sight components are listed in Table 9, and range from 7 to 23 pc, about twice as large as the 3-10 pc range of projected distances. Of course, if we have overestimated the Lyman continuum output of the Arches cluster, then the deduced line-of-sight distances would be smaller. Figure 22a shows a schematic of the main portion of the Arched Filaments at their projected distances from the Arches cluster, with greyscale representing the magnitude of the line-of-sight component. The line-of-sight distances to the cluster for the E1 filament have the largest values (23 pc for E1N and 19 pc for E1), whereas the estimated distances to the southern portions of the W1 and W2 filaments are only 7-9 pc along the line of sight to the cluster. With such large total distances between the cluster and ionized gas (11-24 pc), the uniformity of the physical conditions observed across the H II complex in these H92 line and in previous FIR studies can be understood (Erickson et al. 1991; Colgan et al. 1996).
Using the derived line-of-sight distance between each filament and the cluster, we can construct a schematic of a possible arrangement of the filaments and the cluster. Figure 22b shows a view from above (looking down the long axis of the cloud) of the 30 km s-1 cloud and the ionized filaments, which lie on its edge, and indicates the position of the true observer. This schematic assumes that the ionized filaments are on the near side of the molecular cloud (see 5.1), and that they are all located behind the Arches cluster. In order to produce the narrow, adjacent filaments in the Arched Filaments, one may imagine a “finger-like” or columnar morphology of the underlying molecular gas, such that the dense edges are ionized by the Arches cluster. However, the relationship between the ionized and molecular gas in the Arched Filaments is complex and Figure 22b is likely to be an oversimplification of the system. A more detailed comparison between the ionized and molecular gas in this region will be presented in Paper II (Lang et al., in prep.). In addition, velocity information on the stars in the Arches cluster will provide valuable information on the relative geometry of the stars, ionized, and molecular gas and will be available in the near future.
5.4 Comparison with Giant H II Regions NGC 3603 and 30 Dor
To better understand the ionization of the Arched Filaments, it is useful to compare its environment to the nebular structures which are ionized by similarly powerful clusters: NGC 3603 and 30 Doradus in the Large Magellanic Cloud. NGC 3603 is the largest optically visible H II region in the Galaxy with a nebular diameter of 6 pc and a ionized gas mass of 104 M☉ (Goss & Radhakrishnan 1969; Melnick, Tapia & Terlevich 1989). The ionizing cluster embedded in NGC 3603 contains at least 20 O-stars and several Wolf-Rayet stellar types (Drissen et al. 1995). The R136 cluster which lies at the core of the giant extragalactic H II region 30 Doradus contains more than a dozen Wolf-Rayet stars, and 150 O-stars (Hunter et al. 1995). The nebula in 30 Dor has a linear extent of more than 180 pc, but the structures in the central 40 pc or so have been the subject of several recent studies (Hunter et al. 1995; Scowen et al. 1998). The Arched Filament nebula, with a linear size of 20 pc and an ionizing cluster consisting of 150 O-stars has similar characteristics to the clusters and nebulae of NGC 3603 and 30 Dor. In terms of the ionizing clusters, Figer et al. (1999) report that the total cluster mass of the Arches (104 M☉) is larger than that of NGC 3603, and comparable to that of the R136 cluster in the 30 Dor region. Similarly, the Arches, NGC 3603 and R136 clusters are relatively young, with estimated ages of 2, 4, and 2.5 Myr, respectively (Figer et al. 1999; Drissen et al. 1995; Hunter 1995). The ionizing fluxes from these sources are also comparable: the core of NGC 3603 (HD97950) produces 1051 photons s-1 (Drissen et al. 1995), the R136 cluster ionizing flux is 21051 photons s-1 (Hunter et al. 1995), both similar in value to the estimated 41051 photons s-1 for the Arches cluster (Morris et al. 2000). The nebular structure of NGC 3603 and 30 Dor have been the subject of many optical studies over the years, and the kinematics of both regions are very complex (Clayton 1986, 1988, 1990; Hunter et al. 1995).
However, there is an important difference between the Arched Filaments and these other complexes. In the case of the Arched Filament complex, the gravitational shearing forces on a molecular cloud located only 30 pc from the Galactic center are strong enough to either substantially displace the cluster from its natal cloud (with the help of stellar winds, supernovae, or radiation pressure) or to signficantly tidally disrupt the cloud over the lifetime of the cluster (2 Myr) so that it is no longer recognizable as a coherent cloud structure (see also 5.1). Therefore, we cannot assume that the cluster formed out of this molecular cloud; consequently, the cluster is not likely to be ionizing away its natal material as is presumably occuring in NGC 3603 and 30 Dor. Instead, the 30 km s-1 cloud is by chance passing by the cluster and as a consequence, is being strongly ionized. Although the relationship of the components of these stellar and nebular complexes may be different, the comparisons between the morphology and energetics of the Arched Filaments with 30 Dor and NGC 3603 can be quite instructive.
As in most H II regions, the ionized, molecular and stellar components in NGC 3603 are physically related. Clayton (1990) determined from optical nebular lines that the motions of the gas in the core of NGC 3603 can be attributed to a number of stellar-wind driven bubbles that have cleared out an area of the surrounding interstellar medium around the cluster. Melnick et al. (1989) also find that the spatial distribution of O-stars, ionized gas and dust provide evidence that there is a cavity surrounding the cluster. The radio recombination line study of NGC 3603 show kinematics consistent with at least one expanding shell conicident with a faint optical wind bubble (DePree et al. 1999). In 30 Doradus, Chu & Kennicutt (1994) identify a large number of optical expanding shells, ranging in size from 1-100 pc. Recent high-resolution HST optical images of the core of the 30 Dor nebula in H and other optical emission lines reveal a cavity around the stellar cluster, defined by a partial circular ring of emission at a radius of 5 pc from the cluster. The nebulosity outside of this cavity consists of arcs and filamentary ridges up to 20 pc in extent, with extremely edge-brightened morphology (Scowen et al. 1998). The ionized gas in 30 Dor detected in the H90, H92, and H109 radio recombination lines shows a concentration of emission along the western side, which defines a semi-circular cavity around the stellar cluster. In addition, a double-peaked line profile is observed, coincident in its velocity separation and position with a known shell structure (Peck et al. 1997).
As 30 Dor and NGC 3603 have similarly massive ionizing clusters at their cores, we might expect to detect shell-like structures in the vicinity of the Arches cluster. In addition, a cavity surrounding the Arches cluster might also be expected to be produced as the cluster begins to ionize and clear out lingering interstellar material. However, the velocity field of the H92 line observations does not reveal any expanding shell structures, and double-peaked profiles are observed in only two small regions. The Arched Filaments form a series of concentric, partial rings of emission, centered roughly upon the Arches Cluster, which could have an origin in a stellar wind-driven bubble structure. The narrow, curved arcs that make up the Arched Filaments extend over a range of scales from 2 to 15 pc, and at several positions (most notably in W1 in Figure 5), the ionized gas appears edge-brightened. The Eastern set of concentric rings is absent, indicating that the Arched Filaments H II complex is density-bounded on one side, and ionization-bounded on the other side, where the 30 km s-1 molecular cloud is present (Serabyn & Güsten 1987). Several bubbles in the Galactic center have already been detected in the mid-IR, the most prominent of which is suggestively centered in the vicinity of the Radio Arc (Egan et al. 1998). It is likely to have been created by the Quintuplet cluster, an apparently older version of the Arches cluster (Kim et al. 1999). Correspondances between mid-IR features and those at other wavelengths remain to be investigated. In addition, the large velocity gradients in a direction perpendicular to the E1 and E2 filaments are not consistent with the kinematics of the proposed molecular cloud orbit (see 5.2). These anomolous gas motions could be due to an interaction between the ionized gas and the collective stellar winds from the Arches cluster.
An important contribution to the overall energetics in the nebular gas in both NGC 3603 and 30 Dor has been attributed to kinetic energy deposited to the gas from the stellar winds of the cluster stars. In the case of NGC 3603, 31038 erg s-1 is released, and for 30 Dor, a wind luminosity of 11039 erg s-1 is estimated, which can produce wind-blown bubbles for NGC 3603 and 30 Dor with radii of 20 pc and 190 pc, respectively (Drissen et al. 1995; Hunter et al. 1995). Over the lifetimes of these clusters (4 and 2.5 Myr respectively), the mechanical energies released by the clusters are substantial (1052 ergs). A portion of this energy goes into clearing out and heating the interstellar gas to very high temperatures (107-108 K) through stellar winds. In 30 Dor, ROSAT observations revealed that X-ray emission arises from “blister-shaped” regions closely correlated with loops of ionized gas (Wang 1999). Canto, Raga & Rodriguez (2000) predict that diffuse X-ray emission arising from the combined stellar winds of the Arches cluster members (a “cluster wind”) should be detectable with sensitive X-ray observations. These authors predict that the Arches cluster wind luminosity should be 11038 erg s-1, comparable to the wind luminosities of the NGC 3603 and 30 Dor clusters. Such a wind is capable of imparting a significant amount of energy to the H II and molecular gas in the Arched Filaments in the form of peculiar gas motions and shell-like morphological structures. Thus, it is curious that shell structures are not more in evidence in the vicinity of the Arched Filaments.
6 Conclusions
A VLA H92 recombination line and continuum study at 8.3 GHz of the kinematic and ionization properties of the Arched Filaments has been carried out. The following conclusions have been made:
(1) The 8.3 GHz continuum emission strongly resembles the 1.4 and 4.8 GHz continuum images of the Arched Filaments from MYZ. The high resolution (226 158, PA=642) continuum image shows that the filaments have a remarkably uneven brightness with prominent ridges defining the edges of filaments.
(2) The H92 recombination lines were imaged with a resolution of 128 810, PA=1° and fit with single-component Gaussian models across the entire Arched Filaments. The H92 line properties (line-to-continuum ratios 0.1, V 28 km s-1, average T6200 K) are found to be consistent with those for other Galactic center H II regions which have been photoionized by massive stars.
(3) Narrow lines (V 20 km s-1) are found in several regions of the Eastern Arched Filaments and these narrow lines place upper limits on the electron temperatures of 5400400 K, 6600400 K, and 6000600 K in three regions in the E1 and E2 filaments.
(4) There are extremely large velocity gradients along each of the Arched Filaments. The sense of the velocity gradients in the W1, W2, and G0.10+0.02 portions is increasingly negative velocities southward along the filaments, whereas in E1 and E2, the velocity gradients are not as organized, and in some cases have the opposite sense. The magnitudes of the velocity gradients range from 27 km s-1 pc-1 in the W1 and W2 filaments, and exceed 10 km s-1 in the Eastern filaments. These magnitudes represent some of the largest gradients observed outside of the ionized gas streamers surrounding the black hole within a parsec of SgrA∗.
(5) High resolution H92 line observations (361 266) were carried out for the SW region of the Arched Filaments. The recombination line properties are consistent with the lower resolution results. There do not appear to be any significant discontinuities in the velocity field, line widths, or line-to-continuum ratios in the region of the W1 filament where the Northern Thread NTF crosses in projection. Thus, the nature of a physical interaction, if any, remains unclear.
(6) The kinematics of the Arched Filaments are complex but can be broadly understood in terms of the orbit of the underlying molecular cloud around the Galactic center. The sense and magnitudes of the velocity gradient are consistent with the cloud residing on an x2 orbit (a non-circular orbit family set up in response to the Galaxy’s stellar bar) or to a radially infalling cloud, or to some combination of the two. Retrograde circular motion about the center cannot explain the observed kinematics and can be ruled out.
(7) The Arched Filaments appear to be completely photoionized by the massive stars in the nearby Arches cluster. The cluster is likely to have a line-of-sight distance from the ionized filaments ranging from 7 to 23 pc, about a factor of two larger than the projected displacements. With a source of ionization located such large distances, the uniformity of the the physical conditions across the Arched Filaments can be understood.
7 Acknowledgements
We thank Debra Shepherd for help with the mosaicking and Marc Verheijen for help with GIPSY and the construction of the position-velocity diagrams. We also acknowledge Angela Cotera for useful discussions regarding the ionization of the Arched Filaments, and Jun-Hui Zhao for making a preliminary study of the H92 lines in the Arched Filaments.
References
- Bally et al. (1987) Bally, J., Stark, A.A., Wilson, R.W., & Henkel, C. 1987, ApJS, 65, 13
- Bally et al. (1988) Bally, J., Stark, A.A., Wilson, R.W., & Henkel, C. 1988, ApJ, 324, 223
- Binney et al. (1991) Binney, J., Gerhard, O., Stark, A., Bally, J., & Uchida, K. 1991, MNRAS, 252, 210
- Chu and Kennicutt (1994) Chu, Y. & Kennicutt, R. C. 1994, ApJ, 425, 720
- Clayton (1986) Clayton, C. A. 1986, MNRAS, 219, 895
- Clayton (1990) Clayton, C. A. 1990, MNRAS, 246, 712
- Colgan et al. (1996) Colgan, S., Erickson, E., Simpson, J., Haas, M. & Morris, M., 1996, ApJ, 470, 882
- Contopoulos & Mertzanides (1977) Contopoulos, G. & Mertzanides, C. 1977, A&A, 61, 477
- Cotera et al. (1996) Cotera, A., Erickson, E., Colgan, S., Simpson, J., Allen, D. & Burton, M. 1996 ApJ, 461, 750
- Davidson et al. (1994) Davidson, J., Morris, M., Harvey, P., Lester, D., Smith, B., & Werner, M. 1994, in The Nuclei of Normal Galaxies, R. Genzel & A. Harris, eds., Kluwer: the Netherlands, 231
- DePree, Nysewander and Goss (1999) DePree, C. G., Nysewander, M. C. & Goss, W. M. 1999, AJ, 117, 2902
- Downes et al. (1980) Downes, D., Wilson, T.L., Bieging, J. & Wink, J. 1980,A&AS, 40, 379
- Drissen, Moffat, Walborn and Shara (1995) Drissen, L., Moffat, A. F. J., Walborn, N. R. & Shara, M. M. 1995, AJ, 110, 2235
- Egan, et al. (1998) Egan, M. P., Shipman, R. F., Price, S. D., Carey, S. J., Clark, F. O. & Cohen, M. 1998, ApJ, 494, L199
- Ekers et al. (1983) Ekers, R., van Gorkom, J. Schwarz, U. & Goss, W.M. 1983, A&A, 122, 143
- Erickson et al. (1991) Erickson, E., Colgan, S., Simpson, J., Rubin, R., Morris, M., & Haas, M. 1991, ApJL, 370, L69
- Figer et al. (1998) Figer, D.F., Najarro, F., Morris, M., & McLean, I., Geballe, T. R., Ghez, A. M., & Langer, N. 1998, ApJ, 506, 384
- Figer et al. (1999) Figer, D.F., Kim, S., Morris, M., Serabyn, E., Rich, M. & McLean, I. 1999, ApJ, 525, 750
- Figer (1995) Figer, 1995, PhD thesis, University of California at Los Angeles
- Genzel & Townes (1987) Genzel & Townes 1987, ARA&A, 25, 377
- Genzel et al. (1990) Genzel, R., Stacey, G., Harris, A., Townes, C., Geis, N., Graf, U., Poglitsch, A. & Stutzki, J. 1990, ApJ, 356, 160
- Gusten & Downes (1980) Güsten, R. & Downes, D. 1980, A&A, 87, 6
- Hayvaerts et al. (1988) Hayvaerts, J., Norman, C. & Pudritz, R. 1988, ApJ, 330, 718
- Hunter, et al. (1995) Hunter, D. A., Shaya, E. J., Scowen, P., Hester, J. J., Groth, E. J., Lynds, R. & O’Neil, E. J. 1995, ApJ, 444, 758
- Jenkins & Binney (1994) Jenkins, A. & Binney, J. 1994, MNRAS, 270, 703
- Kantharia et al. (1998) Kantharia, N., Anantharamaiah, K.R. & Goss, W.M. 1998, ApJ, 504, 375
- Lang et al. (1999b) Lang, C.C., Anantharamaiah, K.R., Kassim, N. & Lazio, T.J.W. 1999b, ApJ, , L
- Lang et al. (1997) Lang, C.C., Goss, W.M., & Wood, D.O.S. 1997, ApJ, 474, 275
- Lang et al. (1999a) Lang, C.C., Morris, M., & Echevarria, L. 1999a, ApJ, 525, 727
- Lang et al. (2001) Lang, C.C., Goss, W.M., & Morris, M., in preparation (Paper II)
- Mehringer et al. (1993) Mehringer, D.M., Palmer, P., Goss, W.M. & Yusef-Zadeh, F. 1993, ApJ, 412, 684
- Melnick, Tapia and Terlevich (1989) Melnick, J., Tapia, M. and Terlevich, R. 1989, A&A, 213, 89
- Mezger & Henderson (1967) Mezger, P.G. and Henderson, A.P. 1967, ApJ, 147, 471
- Morris (1994) Morris, M. 1994, in The Nuclei of Normal Galaxies: Lessons from the Galactic Center, R. Genzel & A. Harris, eds., Boston: Kluwer, 185
- Morris et al. (1992) Morris, M., Davidson, J., Werner, M., Dotson, J., Figer, D., Hildebrand, R., Novak, G., & Platt, S. 1992, ApJL, 399, L63
- Morris et al. (1995) Morris, M., Davidson, J. & Werner, M. 1995, in Airborne Astronomy Symposium on the Galactic Ecosystem, M. Haas, J. Davidson & E. Erickson, eds., ASP vol. 73, 477
- Morris & Serabyn (1996) Morris, M. & Serabyn, E. 1996, A&A Review, 34, 645
- Morris & Yusef-Zadeh (1989) Morris, M. and Yusef-Zadeh, F. 1989, ApJ, 343, 703
- Morris et al. (2001) Morris et al. 2001, in prep.
- Nagata et al. (1995) Nagata, T., Woodward, C., Shure, M. & Kobayashi, N. 1995, AJ, 109, 1676
- Pauls et al. (1976) Pauls, T., Downes, D., Mezger, P. & Churchwell, E. 1976, A&A, 46, 407
- Pauls & Mezger (1980) Pauls, T. & Mezger, P. 1980, A&A, 85, 26
- Peck, et al. (1997) Peck, A. B., Goss, W. M., Dickel, H. R., Roelfsema, P. R., Kesteven, M. J., Dickel, J. R., Milne, D. K. & Points, S. D. 1997, ApJ, 486, 329
- Reid (1993) Reid, M. 1993, A&A Review, 31, 345
- Roberts et al. (1991) Roberts, D. & Goss, W.M., van Gorkom, J.H. & Leahy, J.P. 1991, 366, 15
- Roberts & Goss (1993) Roberts, D. & Goss, W.M. 1993, ApJS, 86, 133
- Roelfsema & Goss (1992) Roelfsema, P.R. & Goss, W.M. 1992, A&AReview, 4, 161
- Schwartz et al. (1989) Schwarz, U., Bregman, J. & van Gorkom, J. 1989, ApJS, 86, 133
- Serabyn & Güsten (1987) Serabyn, E. & Güsten, R. 1987, A&A, 184, 133
- Serabyn & Morris (1994) Serabyn, E. & Morris, M. 1994, ApJ, 424, L91
- Serabyn et al. (1998) Serabyn, E., Shupe, D., & Figer, D. 1998, Nature, 394, 448
- Shaver (1980) Shaver, P. 1980, A&A, 91, 279
- Shaver et al. (1979) Shaver, P., McGee, R., & Pottasch, S. 1979, Nature, 280, 476
- Shaver et al. (1983) Shaver, P., McGee, R., Newton, L., Danks, A., & Pottasch, S. 1983, MNRAS, 204, 53
- Schultheis et al. (1999) Schultheis, M.; Ganesh, S.; Simon, G.; Omont, A.; Alard, C.; Borsenberger, J.; Copet, E.; Epchtein, N.; Fouqu , P.; Habing, H. 1999, A&A, 349, 69
- Timmermann et al. (1996) Timmermann, R., Genzel, G., Poglitsch, A., Lutz, D., Madden, S. & Nikola, T. 1996, ApJ, 466, 242
- van der Hulst et al. (1992) van der Hulst, J.M., Terlouw, J.P., Begeman, K.G., Zwister, W., & Roelfsema, P.R. 1992, in Astronomical Data Analysis Software and Systems I, D.M. Worrall, C. Biemsderfer, J. Barnes, eds., ASP: San Fransisco, 131
- Viallefond (1991) Viallefond 1991, private communication
- Wang (1999) Wang, Q. D. 1999, ApJ, 510, L139
- Yusef-Zadeh (1986) Yusef-Zadeh, F. 1986 Ph.D. thesis, Columbia University
- Yusef-Zadeh et al. (1984) Yusef-Zadeh, F., Morris, M., & Chance, D. 1984, Nature, 310, 557
- Yusef-Zadeh et al. (1987) Yusef-Zadeh, F., Morris, M., & van Gorkom, J. 1987, in The Galactic Center, Backer, D.C., ed., AIP: New York, 190
- (63) Yusef-Zadeh, F. & Morris, M. 1987a, AJ, 94, 1178
- (64) Yusef-Zadeh, F. & Morris, M. 1987b, ApJ, 322, 721
- (65) Yusef-Zadeh, F. & Morris, M. 1988, ApJ, 329, 729
- Yusef-Zadeh et al. (1997) Yusef-Zadeh, F., Wardle, M. & Parastaran, P. 1997, ApJ, 475, L119
- Zhao et al. (1993) Zhao, J.H., Desai, K., Goss, W.M. & Yusef-Zadeh, F. 1993, ApJ, 418, 235