Multi-Epoch Multiwavelength Spectra and Models
for Blazar 3C 279
Abstract
Of the blazars detected by EGRET in GeV rays, 3C 279 is not only the best-observed by EGRET, but also one of the best-monitored at lower frequencies. We have assembled eleven spectra, from GHz radio through GeV rays, from the time intervals of EGRET observations. Although some of the data have appeared in previous publications, most are new, including data taken during the high states in early 1999 and early 2000. All of the spectra show substantial -ray contribution to the total luminosity of the object; in a high state, the -ray luminosity dominates over that at all other frequencies by a factor of more than 10. There is no clear pattern of time correlation; different bands do not always rise and fall together, even in the optical, X-ray, and -ray bands.
The spectra are modeled using a leptonic jet, with combined synchrotron self-Compton + external Compton -ray production. Spectral variability of 3C 279 is consistent with variations of the bulk Lorentz factor of the jet, accompanied by changes in the spectral shape of the electron distribution. Our modeling results are consistent with the UV spectrum of 3C 279 being dominated by accretion disk radiation during times of low -ray intensity.
1 Introduction
Partly because of its bright -ray flare shortly after the launch of the Compton Gamma Ray Observatory (Hartman et al. 1992; Kniffen et al. 1993; Hartman et al. 1996), 3C 279 has received a great deal of coverage during the following nine years, at many frequencies in addition to the -ray range. In addition to much routine monitoring, it has also been the subject of six intensive multiwavelength campaigns. It has been detected by the EGRET high-energy instrument on CGRO every time it has been observed, even (at rather low significance) during the very low quiescent state of winter 1992-1993. It has varied in -ray flux by roughly two orders of magnitude (Maraschi et al. 1994; Wehrle et al. 1998), and has displayed factor-of-two variation on timescales as small as 8 hours.
Its detection by EGRET during the very low state of 1992 December – 1993 January (Maraschi et al. 1994) is undoubtedly due to the fact that 3C 279 is one of the closest () of the EGRET-detected flat-spectrum radio-loud quasars (FSRQ), also described recently as quasar-hosted blazars (QHB; Kubo et al. 1998).
In this paper we have collected multiwavelength data simultaneous or (for radio) quasi-simultaneous with gamma-ray observations in order to establish a detailed model picture for this prototype gamma-ray loud AGN, and to constrain the dynamics and physics of relativistic jets.
2 Observations
This paper concentrates on the time intervals during which the CGRO instruments COMPTEL and EGRET were observing 3C 279. In some cases, adjacent CGRO viewing periods have been combined since the -ray flux did not vary significantly. The intervals used are defined in Table 1.
Because the radio fluxes do not vary as rapidly as those at higher frequencies, we have utilized a few radio observations that are a few days outside the time intervals listed in Table 1. For frequencies above 70 GHZ all of the observations used were strictly within the listed time intervals.
Data points have been taken from three earlier papers: Maraschi et al. (1994) for the 1992 December – 1993 January (P2) spectrum, Hartman et al. (1996) for the 1991 June (P1) spectrum, and Wehrle et al. (1998) for the two spectra (P5a and P5b) in 1996 January – February. For those four spectra the EGRET and COMPTEL -ray data have been reprocessed and reanalyzed for use here.
Data were also obtained from the references and observations described below.
2.1 Radio
The flux data at 4.8, 8.0, and 14.5 GHz were obtained with the University of Michigan 26 m paraboloid using rotating-horn polarimeters. For each day’s source observation, a standard noise signal was injected to determine the radiometer gain, position scans were made in right ascension and declination to provide the best source position, and a series of 2.5 minute on-off (4.8 GHz) or on-on (14.5 and 8.0 GHz) measurements were made. The typical duration of a full observation of 3C 279 is 30–40 minutes per day. The primary flux standard used is Cassiopeia A (3C 461) (allowing for the measured decay rate of this source) on the scale of Baars et al. (1977). Secondary flux standards (3C 274 and 3C 286) were observed at 1.5–2 hour intervals near 3C 279 observations to monitor temporal changes in the gain of the telescope. Details of these calibration and reduction procedures can be found in Aller et al. (1985).
Observations made during P2, P3a, P3b, and P4 at Effelsberg have been published in Reich et al. (1993, 1998). The flux tables are available at http://cdsweb.u-strasbg.fr/Abstract.html . Additional measurements at Effelsberg were obtained within a long-term program of flux density monitoring of selected AGN (Peng et al. 2000).
Radio observations at 22 and 37 GHz were carried out at the Metsähovi Radio Observatory as a part of a long term monitoring program. The 1999 and 2000 data have not been published previously; earlier data were presented by Maraschi et al. (1994), Hartman et al. (1996), Teräsranta et al. (1998; the observations and data reduction are described in full there), and Wehrle et al. (1998).
2.2 Millimeter and Submillimeter
3 mm and 1.3 mm observations were made with the 15 m Swedish-ESO Submillimetre Telescope (SEST) at the European Southern Observatory site on Cerro La Silla in Chile. Until June 1995 the 3 mm observations were made using a dual-polarization Schottky receiver; after that the measurements were made with an SIS receiver. As a backend, a wide-band (1 GHz) acousto-optic spectrometer (AOS) was used. For the 1.3 mm observations, since 1991 measurements have been mainly obtained with a single channel bolometer. The bolometer has a bandwidth of about 50 GHz, centered at 236 GHz. All the flux density measurements were made in a dual beamswitching mode, and the flux densities were calibrated against planets. Details about the SEST continuum observations as well as the full data base of the project through 1994 June can be found in Tornikoski et al. (1996).
Flux densities at 3 mm, 2 mm, and 1.3 mm wavelength were determined from observations at the IRAM 30m telescope applying procedures, calibration, and data reduction similar to those described by Steppe et al. (1988) and Reuter et al. (1997). During regular observations made to update the pointing model of the telescope or during VLBI campaigns, we make cross-scans over the source in azimuth and elevation, using SIS (superconductor-insulator-superconductor) receivers at all three wavelengths. The data are calibrated to the scale of corrected antenna temperature, , by observing loads at ambient and cold temperature, as in the conventional ”chopper-wheel” calibration for millimeter wavelength observations. The peak intensity is determined by fitting a Gaussian to the scans in both directions, and corrected for the observed position offsets. Another correction accounts for the elevation-dependence of the telescope gain for a point source. Finally the conversion factor from to flux density is measured using the same observing mode on Mars or Uranus, or on selected Galactic sources, i.e., K3-50A, NGC 7027, NGC 7538, or W3OH, which are used as secondary standards.
Two 3C 279 fluxes (86 GHz in P5a; 90 GHz in P8) were used from the BIMA (Welch et al. 1996) on-line calibration archive (http://bima2.astro.uiuc.edu/calibrators/).
3C 279 was observed with the OVRO millimeter-wave interferometer (Padin et al. 1991) on 1994 December 8, 1999 January 8, 1999 January 11, 1999 January 20, and 1999 February 16. These observations were part of normal calibration measurements taken during science tracks in order to correct for temporal phase variation and gain variation across the spectrometer band. Continuum data was recorded with an analog continuum correlator using a setup which provides a bandwidth of 1 GHz on each sideband. The upper sideband was centered on frequencies of 114.68 and 228.17 GHz. Stringent requirements on coherence, system temperatures, and elevation were used to select the best data, and the flux calibration of 3C 279 was carried out with the Owens Valley millimeter array software (Scoville et al. 1993). The tracks did not include planet observations; therefore the quasar 3C 273 was used to determine the absolute flux scale.
JCMT data for P1, P2, and P5b were taken from Hartman et al. (1996), Maraschi et al. (1994), and Wehrle et al. (1998), respectively. For P3a, P3b, and P4, the UKT14 bolometer (Duncan et al. 1990) was used on the JCMT (Matthews 1991) to observe 3C 279 at 2 mm, 1.3 mm, 1.1 mm, 0.8 mm, and 0.45 mm. The data analysis was similar to standard photometric studies at optical wavelengths; details of the techniques used can be found in Robson et al. (1993), who present the results of very similar observations. The planets Uranus and Mars were used as primary flux density calibrators whenever possible, and strong unresolved sources were observed regularly to correct the pointing and focus of the antenna. To correct for atmospheric extinction, a plane-parallel atmosphere was assumed, and optical depths were calculated directly from observations of the calibrators, which were observed on roughly an hourly basis throughout each session.
Submillimeter data for P6b and P8 were obtained using the Submillimetre Common-User Bolometer Array, SCUBA (Holland et al. 1999) on the JCMT. The observations are from two programs: (1) a dedicated blazar monitoring program with SCUBA in photometry mode. The data reduction method is almost identical to that used for UKT14 although for observations made with the arrays, off-source bolometers can be used to correct for sky noise; and (2) automated reduction of archival 850 m pointing observations (Robson, Stevens & Jenness, in prep.). The data reduction is similar to conventional methodology. As described in Jenness et al. (in prep.), it uses the new JCMT SCUBA pipeline with automatic atmospheric extinction correction. This comes from an extensive database of extinction estimates to correct for the atmosphere, and reduces reliable observations only, using a standard flux conversion factor determined from observations of Uranus and CRL618. This factor was found to be stable to within 10 per cent over a 3 year period.
2.3 Infrared
The infrared observations during P1, P2, P5 (a and b) were taken from Hartman et al. (1996), Maraschi et al. (1994), and Wehrle et al.(1998), respectively.
The P5b (1996 January 31 and Februay 3) CTIO observations used the 1.5 m telescope and near-IR camera CIRIM in photometric conditions. The data were reduced using apphot routines in the IRAF software package. Flux densities were obtained by reference to four UKIRT faint standard stars using normal CTIO extinction coefficients and CIRIM color coefficients.
The UKIRT observation during P3a (1994 December 9) used the UKT9 1–5 m single-channel photometer under photometric sky conditions. The flux was obtained by comparison with nearby standard stars, with uncertainties in the magnitudes of 0.03–0.05.
2.4 Optical
3C 279 was observed during P8 (1999 Jan 18 – Feb 13) and P9 (2000 Jan 29 – Feb 19) at the Abastumani Astrophysical Observatory (Republic of Georgia) using a Peltier-cooled ST-6 CCD camera attached to the Newtonian focus of the 70 cm meniscus telescope (1/3). The full frame field of view is 14.9x10.7 arcmin2. All observations are performed using combined filters of glasses which match the standard B, V (Johnson) and (Cousins) bands well. Because the scale of the CCD and the meniscus telescope resolution are 2.3x2.7 arcsec2 per pixel and 1.5 arcsec respectively, the images are undersampled; therefore the frames were slightly defocused to satisfy the sampling theorem. A full description of the Abastumani blazar monitoring program is given in Kurtanidze & Nikolashvili (1999).
P5a and P5b observations at the Boltwood Observatory, presented previously in Wehrle at al. (1998), were made with an 18 cm refractor, using Johnson-Cousins BVRI filters and a Thomson CSF TH7883 CCD camera. Photometry was done differentially based on star 1 of Smith & Balonek (1998).
A P5a observation at NURO (1996 January 12) used the 0.8 m telescope and a Tektronix CCD camera with Johnson-Cousins BVRI filters. Photometric reference stars were Landolt equatorial standards (Landolt 1992). Atmospheric extinction coefficients were determined for that night from observations of standards. This observation was presented previously in Wehrle et al. (1998).
Observations were taken with the 1.2 m telescope of Calar Alto Observatory, Spain, and with the 0.7 m telescope of the Landessternwarte Heidelberg. Both telescopes are equipped with -cooled CCD cameras. Observations in Heidelberg are carried out with a Johnson R band filter. The Calar Alto observations were carried out in Johnson R (in 2000) and Röser R (in earlier years). Standard de-biasing and flat-fielding was carried out before performing differential aperture photometry. (Finding charts and comparison sequences are available at http://www.lsw.uni-heidelberg.de/projects/extragalactic/charts.html for 3C 279, along with many other blazars.)
Observations were performed using Lowell Observatory’s 42 inch Hall telescope and the 24 inch telescope of the Mount Stromlo / Siding Spring Observatories. Both telescopes are equipped with a direct CCD camera and an autoguider. The observations were made through VRI filters. Repeated exposures of 90 seconds were obtained for the starfield containing 3C 279 and several comparison stars (Smith et al. 1985). These comparison stars were internally calibrated and are located on the same CCD frame as 3C 279. They were used as the reference standard stars in the data reduction process. The observations were reduced following Noble et al. (1997), using the method of Howell and Jacoby (1986). Each exposure is processed through an aperture photometry routine which reduces the data as if it were produced by a multi-star photometer. Differential magnitudes can then be computed for any pair of stars on the frame. Thus, simultaneous observations of 3C 279, several comparison stars, and the sky background permit removal of variations which may be due to fluctuations in either atmospheric transparency or extinction. The aperture photometry routine used for these observations is the phot task in IRAF.
Observations were taken with the 2.5 m Nordic Optical Telescope (NOT) on La Palma, Canary Islands, Spain, using the ALFOSC intrument with a 2000x2000 CCD camera (0.189 arcsecond per pixel), and V and R filters. Data reduction (including bias amd flat field corrections) were made either with standard IRAF or MIDAS (J. Heidt) routines. The data taken in 1999 and 2000 are previously unpublished.
Observations at the Tuorla Observatory used the 1.03 m telescope with a ST-8 CCD camera and a V-filter (Katajainen et al. 2000). Data reduction was done using IRAF (with bias and flatfield corrections). Some portions of the Tuorla data have been previously published in Wehrle et al. (1998) and Katajainen et al. (2000).
Observations at the Perugia Observatory were carried out with the Automatic Imaging Telescope (AIT). The AIT is based on an equatorially mounted 40 cm f/5 Newtonian reflector, with a 15 cm f/15 refractor solidly joined to it. A CCD camera and Johnson-Cousins filters are utilized for photometry (Tosti et al 1996). The data were reduced using aperture photometry with the procedure described in that reference.
Observations at the Torino Observatory were done with the 1.05 m REOSC telescope. The equipment includes an EEV CCD camera ( pixels, 0.467 arcsec per pixel) and standard (Johnson-Cousins) filters. Frames are reduced by the Robin procedure locally developed (Lanteri 1999), which includes bias subtraction, flat fielding, and circular Gaussian fit after background subtraction. The magnitude calibration was performed according to the photometric sequence by Raiteri et al. (1998). Magnitudes were converted to fluxes by using a -band Galactic extinction of 0.06 mag and following Rieke & Lebofsky (1985) and Cardelli et al. (1989). Data from 1994–1995 were published in Villata et al. (1997); data around P5a and P5b were partially shown in Wehrle et al. (1998) and Villata et al. (1998).
P9 observations were made with the 60 cm KVA telescope on La Palma, Canary Islands, using a ST-8 CCD camera with BVR filters. The data reduction was done using IRAF (with bias and flatfield corrections). These data are previously unpublished.
2.5 UV
IUE data for P1 and P2 appeared in Hartman et al. (1996) and Maraschi et al. (1994), respectively, but were reanalyzed by Pian (1999). The IUE data for P3b and P4 were presented in Koratkar et al. (1998) and Pian et al. (1999), and those of P5a and P5b were presented in Wehrle et al. (1998).
2.6 X-Ray
ROSAT data for P2 and P5a were presented in Maraschi et al. (1994) and Wehrle et al. (1998), respectively, but were reanalyzed by Sambruna (1997).
ASCA data for P3b and P5a were presented in Wehrle et al (1998) and Pian et al. (1999), respectively; they were reanalyzed by Kubo (1997). ASCA data for P4 have appeared only in Kubo (1997).
3C 279 was observed by BeppoSAX during 5 pointings in P6a (1997 Jan 11–21), for a total exposure time of 150 ks. The spectra taken by the BeppoSAX LECS (0.1–4 keV; Parmar et al. 1997) and MECS (1.6–10 keV; Boella et al. 1997) instruments have been extracted from the linearized event files using extraction radii of 8′′ and 4′′, respectively, and corrected for background contamination using library files available at the BeppoSAX Science Data Center.
The spectra measured by the BeppoSAX PDS instrument (13–300 keV; Frontera et al. 1997) have been accumulated from on-source exposures of the collimator units, and corrected using background spectra obtained during the off-source exposures. A further correction for the energy and temperature dependence of the pulse rise time, devised for weak sources, has been applied.
No emission variability has been detected among different pointings, therefore the spectral signal has been coadded over all exposures to maximize the S/N. The average spectrum of the source exhibits significant signal up to 50 keV and appears featureless; see Pian (in preparation) for a detailed presentation of these data.
After rebinning the spectrum in intervals where the signal exceeds a 3 significance, we fitted it to a single absorbed power-law using the XSPEC routines and response files available at the Science Data Center. The normalization between the MECS and the LECS instruments has been treated as a free parameter, while that between the MECS and PDS instruments was fixed. The fit is satisfactory; the fitted neutral hydrogen column density is consistent with the Galactic value (Elvis, Lockman, & Wilkes 1989) and the L/M normalization is consistent with the expected intercalibration between the two instruments.
Ginga fluxes for P1 were taken from Hartman et al. (1996).
RXTE data from P5a and P5b have been presented previously in Wehrle et al. (1998). Full details of those analyses are given in Lawson et al. (1999). Subsequent data were analysed in almost exactly the same manner but, for completeness, we summarise the observations and analysis briefly.
3C 279 was the target for a series of 36 RXTE monitoring observations during 1999 January 2 – February 16, for a total on-source time of 67 ksec. The X-ray data presented here were obtained using the Proportional Counter Array (PCA) instrument in the “Standard 2” and “Good Xenon” configurations, with time resolutions of 16 sec and sec respectively. Only PCUs 0, 1, and 2 were reliably on throughout the observations, and we limit our analysis to data from these detectors.
A further sequence of 28 monitoring observations was performed with RXTE in 2000 February, using the same instrumental configurations, for a total on-source time of 104 ksec. For this sequence we utilized data from PCUs 0 and 2.
Data analysis was performed using RXTE standard analysis software, FTOOLS 5.0. Background subtraction of the PCA data was performed utilizing the “L7-240” models generated by the RXTE PCA team. The quality of the background subtraction was checked in two ways: (i) by comparing the source and background spectra and light curves at high energies (50–100 keV) where the source itself no longer contributes detectable events; and (ii) by using the same models to background-subtract the data obtained during slews to and from the source.
2.7 Gamma-Ray
OSSE consists of four identical scintillation detectors which make measurements in the 50 keV – 10 MeV gamma ray energy band. The detectors are actively shielded and the rectangular fields of view, full width at half-maximum, are defined by tungsten collimators. OSSE utilizes a sequence of two-minute source observations alternated with offset-pointed background observations to determine a source contribution above background. Generally, equal times are spent on source and background measurements. See Johnson et al. (1993) for a more detailed description of the instrument, its performance and data analysis techniques.
The background-subtracted data from each observation period are summed to obtain a time-averaged count rate spectrum for that period. Prior to fitting, systematic errors are included. These systematics are computed from the uncertainties in the low energy calibration and response of the detectors using both in-orbit and pre-launch calibration data. The energy-dependent systematic errors are expressed as an uncertainty in the effective area in the OSSE response. These systematic errors were added in quadrature to the statistical errors prior to spectral fitting. They are most important at the lowest energies ( uncertainty in effective area at 50 keV, decreasing to 0.3% at 150 keV and above).
Simple spectral models are fit to the residual count spectra from each viewing period or to the sum of several viewing periods using the OSSE data analysis system. The fitting procedure consists of folding model photon spectra through the OSSE response matrix and adjusting the model parameters to minimize, through a test, the deviations between the model count spectrum and the observed count spectrum. For observations with insignificant count data, upper limits to the flux are derived by fitting a power law spectrum with a photon index of 2.0.
OSSE results for P5a and P5b were presented in Wehrle et al. (1998), but were reanalyzed for this work. For P3b, P6b, P8, and P9, the OSSE 50–150 keV fluxes or upper limits were obtained from routine automatic processing. For P2, P4, and P6a, the standard analysis was performed on sums of several viewing periods.
The COMPTEL experiment, mounted parallel to EGRET on CGRO, always observes simultaneously with EGRET, but is sensitive to lower-energy -rays, from 0.75 MeV to 30 MeV. For details about the COMPTEL instrument see Schönfelder et al. (1993). The COMPTEL data have been analyzed following the standard COMPTEL procedures (see e.g. Collmar et al. 2000a and references therein). The COMPTEL data of 1991 (P1) were previously presented in Hermsen et al. (1993), Williams et al. (1995), and Hartman et al. (1996); the data of 1993 (P3a, P3b) in Collmar et al. (1996); the data of 1996 (P5a, P5b) in Collmar et al. (1997) and Wehrle et al. (1998); and those of 1999 (P8) in Collmar et al. (2000b).
The EGRET instrument on CGRO is sensitive to -rays in the energy range 30 to 30,000 MeV. Its capabilities and calibration are described in Thompson et al. (1993) and Esposito et al. (1999). Point source data are analyzed using likelihood techniques (Mattox et al. 1996). The data from P1 have been previously presented in Hartman et al. (1996); those from P2 in Maraschi et al. (1994); and those from P5a and P5b in Wehrle et al. (1998).
For the present work, the data from COMPTEL, EGRET, and OSSE have been completely reprocessed and reanalyzed; the results of the reanalysis are consistent with the earlier publications, although not identical.
3 Gamma-Ray Light Curve and Multiwavelength Spectra
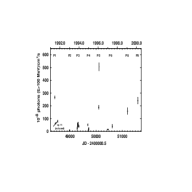
In order to illustrate the general activity level of 3C 279 at the time of each of the spectra shown below, the light curve of all EGRET observations of 3C 279 () is shown in Figure 1. The fluxes shown vary by a factor of about 56, which is greater than the variation observed in any other frequency band over this time span. (Note that the -ray fluxes shown are from integrations over at least one week. However, the one-day flux for 4 Feb 1996 was greater than 1000 on the same scale, making the total range of variation well over a factor of 100.) Dramatic variability on short time scales is a well-known characteristic of this object at all frequencies (see, e.g., Webb et al. 1990), but the amplitude seems to increase with frequency.
The eleven multiwavelength spectra assembled from the observations described above are shown in Figure 2(a–k) with the model fits described in the next section. The CGRO observation during October 1991 is not included in that figure, because 3C 279 was too close to the Sun for observations to be made at lower frequencies.
In the Web-based version of this paper (http://etcetc), Tables P1, P2, P3a, P3b, P4, P5a, P5b, P6a, P6b, P8, and P9 give the values of the data points plotted in Figure 2(a–k), in a form suitable for computer download.
4 Modeling
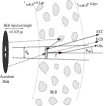
The broadband spectra were modeled with the pair plasma jet simulation code described in detail in Böttcher et al. (1997) and Böttcher & Bloom (2000). In this model, blobs of ultrarelativistic pair plasma are moving outward from the central accretion disk along a pre-existing straight cylindrical jet structure, with relativistic speed and bulk Lorentz factor (see Figure 3). In the following, primed quantities refer to the rest frame comoving with the relativistic plasma blobs. At the time of injection into the jet at height above the accretion disk, the pair plasma is assumed to have an isotropic power-law energy distribution in the comoving frame, with index and low- and high-energy cut-offs . The blobs are spherical in the comoving frame, with radius , which does not change along the jet. A randomly oriented magnetic field is present, where is the magnetic field corresponding to equipartition with the energy density of pairs at the base of the jet. The observer is misaligned by an angle with respect to the jet axis.
As the blob moves out, various radiation and cooling mechanisms are at work: synchrotron radiation, synchrotron self-Compton radiation (SSC; Marscher & Gear 1985, Maraschi et al. 1992, Bloom & Marscher 1996), inverse-Compton scattering of external radiation from the accretion disk, either entering the jet directly (ECD, for External Compton scattering of direct Disk radiation; Dermer et al. 1992, Dermer & Schlickeiser 1993) or after being rescattered by surrounding (broad-line region) material (ECC for External Compton scattering of radiation from Clouds; Sikora et al. 1994, Blandford & Levinson 1995, Dermer et al. 1997).
The contribution from Comptonization of infrared emission from heated dust in the circumnuclear region can become quite significant and even dominant over the ECC radiation in the soft gamma-ray regime in the case of continuous reinjection or reacceleration of relativistic pairs in the jet, because the energy density of this radiation field remains approximately constant over a much longer length scale than the radiation field due to accretion disk radiation reprocessed in the BLR (Blazejowski et al. 2000). However, in the case of instantaneous particle injection and subsequent cooling, considered in the model applied in this paper, that contribution is negligible since in this case the relativistic electrons have transformed virtually all their kinetic energy into radiation by the time the blob leaves the BLR.
The broad-line region (BLR) is represented by a spherical layer of material with uniform density and total Thomson depth , extending between the radii from the central black hole. The central accretion disk is radiating a standard Shakura-Sunyaev (1973) disk spectrum around a black hole of solar masses. The total disk luminosity is assumed to be erg s-1. The full angle dependence of the disk radiation field, according to its radial temperature structure, is taken into account. Compton scattering of all radiation fields is calculated using the full Klein-Nishina cross section. The SSC mechanism is calculated to arbitrarily high scattering order.
After the initial injection of ultrarelativistic pairs, all of the mechanisms mentioned above are taken into account in order to follow the evolution of the electron/positron distribution functions and the time-dependent broadband emission as the blob moves out along the jet. absorption intrinsic to the source and the re-injection of pairs due to pair production is taken into account completely self-consistently using the exact analytic solution of Böttcher & Schlickeiser (1997) for the pair injection spectrum due to absorption.
Given the necessary integration times of at least several days for EGRET to obtain spectral information (longer than the cooling time of pairs in the jet), we use the time-integrated spectrum of our simulated relativistic blobs, and re-convert the resulting fluence into a flux by dividing it by an average repetition time of blob ejection events. This repetition time determines the overall normalization of our model spectra, which is constrained by the requirement that subsequent blobs are not allowed to overlap.
The parameters that were fixed for modeling all eleven spectra are shown in Table 2. These are thought to be fairly well constrained by other observations, or do not appear to affect significantly the values obtained for the parameters obtained from the modeling, which are shown in Table 3.
The model used here addresses only emission from the innermost portion of the jet. In that region, the centimeter-wavelength radio emission is strongly synchrotron self-absorbed. The centimeter fluxes seen in the spectra of Figure 2 are believed to come from much farther out along the jet, i.e., one to several parsecs from the central engine. That parsec-scale radio emission has been modeled by, for example, Hughes et al. (1991) and Carrara et al. (1993). With those models, much larger angles of the jet to the line of sight (30∘ to 40∘) have been found to be appropriate. The inner jet must be directed at smaller angle to the line of sight to be consistent with the observed superluminal motion. This change can be attributed to bending of the jet, which is seen as a common feature in VLBI maps of blazars.
In general, the millimeter radio emission in blazars seems to be more closely connected to the gamma-ray variations, being either cospatially or slightly farther out along the jet (Reich et al. 1993; Valtaoja & Teräsranta 1996). Combining VLBI and total flux density variation data, Lähteenmäki & Valtaoja (1999) estimated that the jet Lorentz factor is about 9 and the viewing angle 2 degrees, in good accordance with the values presented here.
5 Discussion and Conclusions
With the exception of P9, we find the same trends found by Mukherjee at al. (1999) for PKS 0528+134, i.e., that the high states are consistent with a higher bulk Lorentz factor and lower (low-energy cutoff of the electron/positron spectrum). However, because the spectra for 3C 279 contain better simultaneous optical and X-ray coverage, with detailed X-ray spectral information, some of the parameters are better-determined for 3C 279 than for PKS 0528+134, in particular the electron density and the cutoffs and .
The broadband spectrum of 3C 279 during P9 constitutes a rather special case. In this spectrum, the level and index of the -ray points lead to difficulties with the modeling; therefore, the EGRET data for P9 were examined carefully to determine whether the effect might be due to unexpected instrument degradation. No such unexpected degradation was found. The EGRET performance was found to be very similar to that in P8. In addition, a spectrum of the Vela pulsar, from the EGRET observation immediately prior to P9, was found to be very similar to those observed previously throughout the CGRO mission. Therefore, the P9 EGRET spectrum was assumed to be correct.
In analogy to our fits to the other epochs, the P9 EGRET spectrum at GeV might be dominated by Comptonization of direct accretion disk radiation. Allowing for a finite contribution due to Comptonization of reprocessed accretion disk radiation at GeV, and fitting simultaneously the optical (synchrotron) and COMPTEL/EGRET -ray spectra, we find a best-fit electron spectral index of and a bulk Lorentz factor of with the standard accretion disk spectrum used for the fits to the other observation epochs. The additional constraints of the sharp fall-off of the -ray spectrum below MeV and the very hard X-ray spectrum, implying a peak energy of the SSC component at keV, lead to a strong constraint on and cm-3 (for the fit presented in Fig. 2k, we actually use cm-3).
However, with these values for and and the standard parameters for the accretion disk luminosity and the BLR structure, the multi-GeV -ray flux would be overestimated because of a strongly dominant contribution from the ECC component in this energy range. We have tried different combinations of the electron energy cutoffs, electron density, and the bulk Lorentz factor, but did not find appropriate parameters to fit the P9 spectrum with the standard ECC parameters used for the other fits. The most convincing way to solve this problem is to assume variability of the accretion disk. Specifically, we assumed that during period P9, 3C 279 had just recovered from a temporary low-state of the accretion flow. This could have lead to a reduced flux in reprocessed accretion disk emission as the source for the ECC component. With a photon energy density in reprocessed accretion disk radiation of 25% of the value used for the other observing periods, we find a satisfactory fit to the P9 broadband spectrum.
The accretion disk low-state postulated above should have been quite obvious in an optical spectrum of 3C 279 taken during the P9 EGRET observation, or during the previous few months. Attempts have been made to locate an observer who has taken such a spectrum during or around the relevant time period. The only optical spectrum known to us (Sillanpää et al., private communication) was taken in June 2000, about four months after the P9 observations. At that time, 3C 279 showed no lines at all. Although conditions for that observation were far from ideal, the result provides support for the idea that reprocessed accretion disk emission could have been low at the time of the P9 EGRET observation.
Returning to the ensemble of 11 models, the electron pair spectral index is seen to vary in a way that is apparently not related to the -ray flux state of the source ( is very well constrained by the synchrotron spectral index, so this is not an artifact of a special choice of parameters). Variations of are of minor importance. In contrast to the fits to PKS 0528+134, for 3C 279 the high-energy cutoff is rather well constrained in most of the spectra because of the simultaneous optical and X-ray coverage and good X-ray spectral information.
Note that the thermal emission from the 3C 279 accretion disk is apparent only during states of low activity. This has been noted previously by Pian et al. (1999), who find evidence in IUE data for a thermal component underlying the beamed jet only during the lowest UV states.
It has been suggested (e.g. Stecker 1999) that 3C 279, being located relatively nearby (on a cosmological scale) at , would be a promising candidate for detection at multi-GeV energies ( GeV) with the new generation of air Čerenkov detector facilities, such as STACEE, CELESTE, VERITAS, or HESS (for a recent review of these detector developments see, e.g., Krennrich 1999), if the intrinsic spectrum of 3C 279 is a simple continuation of the best-fit power-law to the EGRET spectrum of 3C 279 measured during bright -ray flares. However, our model fits predict that the intrinsic multi-GeV spectra even in the flaring states of 3C 279 are rather steep, with photon indices . Table 4 lists the predicted photon indices and integrated fluxes (not accounting for absorption by the intergalactic infrared background radiation (IIBR)) at GeV for the 4 -ray high states of periods P1, P5a, P5b, and P8. During the lower -ray states, no appreciable multi-GeV emission is predicted.
Stecker & de Jager (1998) calculate a absorption opacity due to interactions of 50 GeV photons with the IIBR of 0.2 – 0.3, whereas the computations of Primack et al. (1999) yield a slightly higher value of 0.4 – 0.5. This leads to predicted GeV fluxes of erg cm-2 s-1, even during extremely bright -ray flares. This is at least one order of magnitude lower than the projected thresholds of STACEE and VERITAS, but might be reached by the MAGIC telescope (Krennrich 1999).
Table 1 - Observation intervals
| Interval | Start date | End date |
|---|---|---|
| P1 | 1991 Jun 15 | 1991 Jun 28 |
| P2 | 1992 Dec 22 | 1993 Jan 12 |
| P3a | 1993 Oct 19 | 1993 Dec 01 |
| P3b | 1993 Dec 13 | 1994 Jan 03 |
| P4 | 1994 Nov 29 | 1995 Jan 10 |
| P5a | 1996 Jan 16 | 1996 Jan 30 |
| P5b | 1996 Jan 30 | 1996 Feb 06 |
| P6a | 1996 Dec 10 | 1997 Jan 28 |
| P6b | 1997 Jun 17 | 1997 Jun 24 |
| P8 | 1999 Jan 19 | 1999 Feb 01 |
| P9 | 2000 Feb 08 | 2000 Mar 01 |
Table 2 - Model parameters fixed for all epochs
| Parameter | Value |
|---|---|
| Accretion disk luminosity††Although the parameters above were used also for P9, in that case only, it was necessary to reduce artificially the density of reprocessed disk photons to 25% of that calculated by the computer code. | erg s-1 |
| Observing angle wrt jet | 2∘ |
| Thomsom depth of BLR | 0.003 |
| Inner boundary of BLR | 0.1 pc |
| Outer boundary of BLR | 0.4 pc |
| Blob injection height | 0.025 pc |
| Blob radius | 61016 cm |
| Magnetic field | 1.5 G |
| Observation | ray state | |||||
|---|---|---|---|---|---|---|
| P1 | high; moderate flare | 350 | 100103 | 1.90 | 28 | 14 |
| P2 | very low | 1200 | 14103 | 2.95 | 30 | 6 |
| P3a | moderate | 700 | 15103 | 2.10 | 25 | 6 |
| P3b | moderate | 1500 | 20103 | 3.10 | 15 | 5.5 |
| P4 | low | 1500 | 50103 | 3.10 | 40 | 10 |
| P5a | high; some variability | 600 | 100103 | 2.40 | 20 | 10 |
| P5b | very large flare | 400 | 100103 | 3.00 | 35 | 13 |
| P6a | low | 750 | 30103 | 2.50 | 10 | 4 |
| P6b | moderate | 1350 | 15103 | 2.70 | 10 | 5.5 |
| P8 | high; some variability | 450 | 100103 | 2.20 | 10 | 6 |
| P9 | high; some variability | 600 | 50103 | 2.60 | 9 | 8 |
Table 4. Predicted photon spectral indices and integrated unabsorbed GeV fluxes from our model fits to the -ray high states of 3C 279
| Period | [erg cm-2 s-1] | |
|---|---|---|
| P1 | 5.0 | |
| P5a | 5.0 | |
| P5b | 3.5 | |
| P8 | 5.0 |
References
- (1)
- (2) Aller, H.D., Aller, M.F., Latimer, G.E, & Hodge, P. E. 1985, ApJS, 59, 513
- (3) Baars, J.W.M., Genzel, R., Pauliny-Toth, I.I.K., & Witzel, A. 1977, A&A, 61, 99
- (4) Blandford, R.D., & Levinson, A. 1995, ApJ, 441, 79
- (5) Blazejowski, M., Sikora, M., Moderski, R., & Madejski, G.M. 2000, ApJ, in press (Dec. 20 2000)
- (6) Bloom, S.D., & Marscher, A.P. 1996, ApJ, 461, 657
- (7) Boella, G., et al. 1997, A&AS, 122, 327
- (8) Böttcher, M., et al. 1997, A&A, 324, 395
- (9) Böttcher,M., & Bloom, S.D. 2000, AJ, 119, 469
- (10) Böttcher, M., & Schlickeiser, R. 1997, A&A, 325, 866
- (11) Cardelli J.A., Clayton G.C., Mathis J.S., 1989, ApJ, 345, 245
- (12) Carrara, E.A., Abraham, Z., Unwin, S.C., & Zensus, J.A. 1993, A&A, 279, 83
- (13) Collmar, W., et al. 1996, A&AS, 120, 515
- (14) Collmar, W., et al. 1997, in Proc. of the Fourth Compton Symposium, eds. C.D. Dermer, M.S. Strickman, & J.D. Kurfess (Woodbury, New York: AIP Conf. Proc. 410), 1341
- (15) Collmar, W., et al. 2000a, A&A, 354, 513
- (16) Collmar, W., et al. 2000b, in Proc. of the Fifth Compton Symposium, eds. M.L. McConnell & J. M. Ryan (Melville, New York: AIP Conf. Proc. 510), 303
- (17) Dermer, C.D., Schlickeiser, R., & Mastichiadis, A. 1992, A&A, 256, L27
- (18) Dermer, C.D., & Schlickeiser, R. 1993, ApJ, 416, 458
- (19) Dermer, C.D., Sturner, S.J., & Schlickeiser, R. 1997, ApJS, 109, 103
- (20) Duncan, W. D., Robson, E. I., Ade, P. A. R., Griffin, M. J., & Sandell, G. 1990, MNRAS, 243, 126
- (21) Elvis, M., Lockman, F. J., & Wilkes, B. J. 1989, AJ, 97, 777
- (22) Esposito, J.A., et al. 1999, ApJS, 123, 203
- (23) Frontera, F., Costa, E., Dal Fiume, D., Feroci, M., Nicastro, L., Orlandini, M., Palazzi, E., & Zavattini, G. 1997, A&AS, 122, 357
- (24) Hartman, R.C., et al. 1992, ApJ, 385, L1
- (25) Hartman, R.C., et al. 1996, ApJ, 461, 698
- (26) Hermsen, W., et al. 1993, A&AS, 97, 97
- (27) Holland, W.S., et al. 1999, MNRAS, 303, 659
- (28) Howell, S.B., & Jacoby, G.J. 1986, PASP, 98, 802
- (29) Hughes, P.A., Aller, H.D., & Aller, M.F. 1991, ApJ, 374, 57
- (30) Johnson, W.N., et al. 1993, ApJS, 86, 693
- (31) Katajainen, S., Takalo, L.O., & Sillanpää, A., et al. 2000, A&AS, 143, 357
- (32) Kniffen, D.A., et al. 1993, ApJ, 411, 133
- (33) Koratkar, A., Pian, E., Urry, C. M., & Pesce, J. E. 1998, ApJ492, 173
- (34) Krennrich, F., 1999, Astroparticle Phys., 11, 235
- (35) Kubo, H. 1997, PhD Thesis, Univ. of Tokyo, available as ISAS Research Note RN-679
- (36) Kubo, H., et al. 1998, ApJ, 504, 693
- (37) Kurtanidze, O.M., & Nikolashvili, M.G. 1999, Proc. of the OJ-94 Annual Meeting 1999, Blazar Monitoring Toward the Third Millennium, ed. Raiteri, C.M., Villata, M., & Takalo, L.O. (Pino Torinese:Osservatorio Astronomico di Torino)
- (38) Landolt, A. U., 1992, AJ, 104, 34
- (39) Lanteri, L., 1999, in OJ-94 Annual Meeting 1999, Blazar Monitoring towards the Third Millennium, ed. Raiteri, C.M., Villata, M., & Takalo, L.O. (Pino Torinese:Osservatorio Astronomico di Torino), 125
- (40) Lähteenmäki, A., & Valtaoja, E., 1999, ApJ, 521, 493
- (41) Lawson, A. J., McHardy, I. M., Marscher, A. P. 1999 MNRAS, 306, 247
- (42) Maraschi, L., Ghisellini, G., & Celotti, A. 1992, ApJ, 397, L5
- (43) Maraschi, L., et al. 1994, ApJ, 435, L91
- (44) Marscher, A.P., & Gear, W. 1985, ApJ, 298, 114
- (45) Matthews, H. E. 1991, The James Clerk Maxwell Telescope: A Guide for the Prospective User (Hilo: Joint Astronomy Centre)
- (46) Mattox, J.R., et al. 1996, ApJ, 461, 396
- (47) Mukherjee, R., et al. 1999, ApJ, 527, 132
- (48) Noble, J. C., Carini, M. T., Miller, H. R., & Goodrich, B. 1997, AJ, 113, 1995
- (49) Padin, S., et al. 1991, PASP, 103, 461
- (50) Parmar, A.N., et al. 1997, A&AS, 122, 309
- (51) Pian, E., et al. 1999, ApJ, 521, 112
- (52) Primack, J.R., Bulock, J.S., Somerville, R.S., MacMinn, D. 1999, Astroparticle Phys., 11, 93
- (53) Raiteri, C.M., Villata, M., Lanteri, L., Cavallone, M., Sobrito, G. 1998, A&AS, 130, 495
- (54) Reich, W., Steppe, H., Schlickeiser, R., Reich, P., Pohl, M., Reuter, H.P., Kanbach, G., Schönfelder, V. 1993, A&A, 273, 65
- (55) Reich, W., Reich, P., Pohl, M., Kothes, R., Schlickeiser, R. 1998, A&AS, 131, 11
- (56) Reuter, H.-P., et al., 1997, A&AS, 122, 271
- (57) Rieke, G.H., & Lebofsky, M.J. 1985, ApJ, 288, 618
- (58) Robson, E. I., et al. 1993, MNRAS, 262, 249
- (59) Sambruna, R.M. 1997, ApJ, 487, 536
- (60) Schönfelder, V., et al. 1993, ApJS, 86, 657
- (61) Scoville, N.Z., Carlstrom, J.E., Chandler, C.J., Phillips, J.A., Scott, S.L., Tilanus, R.P.J., Wang, Z. 1993, PASP, 105, 1482
- (62) Stecker, F. W., & de Jager, O. C., 1998, A&A, 334, L85
- (63) Stecker, F. W., 1999, Astroparticle Phys., 11, 83
- (64) Shakura, N. I., & Sunyaev, R.A. 1973, A&A, 24, 337
- (65) Sikora, M., Begelman, M.C., & Rees, M.J. 1994, ApJ, 421, 153
- (66) Smith, P. S. 1985, AJ, 90, 1184
- (67) Smith, P. S., & Balonek, T.J. 1998, PASP, 110, 1164
- (68) Steppe, H., Salter, C.J., Chini, R., Kreysa, E., Brunswig, W., Lobato Perez, J. 1988, A&AS, 75, 317
- (69) Teräsranta, H., et al. 1998, A&AS, 132, 305
- (70) Thompson, D.J., et al. 1993, ApJS, 86, 629
- (71) Tornikoski, M., Valtaoja, E., Teräsranta, H., et al. 1996, A&AS, 116, 157
- (72) Tosti, G., Pascolini, S., & Fiorucci, M. 1996, PASP, 108, 706
- (73) Valtaoja, E., & Teräsranta, H. 1996, A&AS, 120, 491
- (74) Villata, M., et al. 1997, A&AS, 121, 119
- (75) Villata, M., Raiteri, C.M., De Francesco, G., Lanteri, L., Ghisellini, G. 1998, in Proc. OJ-94 Annual Meeting 1997, Multifrequency Monitoring of Blazars, ed. Tosti, G., & Takalo, L. (Perugia:Publicazioni Osservatorio Astronomico Università di Perugia), 3, 121
- (76) Webb, J.R., et al. 1990, AJ, 100, 1452
- (77) Wehrle, A.E., et al. 1998, ApJ, 497, 178
- (78) Welch, W.J., et al. 1996, PASP, 108, 93
- (79) Williams, O.R., et al. 1995, A&A, 298, 33
- (80)
3C 279 light curve in rays 100 MeV, 1991 to 2000. Horizontal error bars show the length of each observation.
Broadband 3C 279 spectra for the eleven time intervals listed in Table 1. Filled triangle with error bars, single measurement (or upper limit); vertical bar with no triangle, range of two or more measurements, including errors. The curves are for the model described in section 4 and Tables 2 and 3: short-dashed line ( Hz), thermal emission from the accretion disk; short-dashed line ( Hz), disk emission comptonized in the jet; long-dashed line, synchrotron radiation from the jet; dotted line, synchrotron self-Compton radiation from the jet; short-long-dashed line, BLR emission comptonized in the jet.
Schematic showing the geometric properties of the model.