Spectral and temporal properties of X-ray emission from the ultra-luminous source X-9 in M81
V. La Parola, Universitá di Palermo; G. Fabbiano, Smithsonian CfA, Cambridge (MA); D.W. Kim, Smithsonian CfA, Cambridge (MA); G. Peres, Universitá di Palermo.
Abstract
We have analysed the spectra and the variability of individual
X-ray sources in the M-81 field using data from the available ROSAT-PSPC and
ROSAT-HRI observations of this nearby spiral galaxy.
Here we present the results on the second brightest source in the field (X-9 - Fabbiano, 1988 ApJ 325 544), whose identification and interpretation is still unclear. Our work includes the study of the shape of X-9 from HRI data, the light curve and hardness ratio evolution, and the spectral analysis.
1 Fundamental characteristics
X9-M81, a very bright X-ray source, is located 12.5’ far from M81 nucleus, at coordinates 09h 57m 54s +69 03’ 48” (J2000). It was first detected with Einstein and, since then many hypotheses have been made on its nature, also on the basis of the very high X-ray luminosity (more than if at the distance of M 81). The most important ones are:
-
•
an extended structure (a super-shell) heated by the detonation of many () supernovae (Miller 1995)
-
•
a compact object (WD, NS or BH) accreting material from a dense cloud of interstellar gas (Miller 1995)
-
•
a background quasar (Ishisaki et al. 1996)
Some important issues, that make understanding this object even more difficult concern its optical appearance and its position. X-9 optical counterpart is not well identified: the only candidate so far is a weak (probably extended) object of . Moreover, the source appears to be isolated, well outside the M81 optical image and there is no evident association with other galaxies in the group, albeit it may belong to the outskirts regions of the HoIX dwarf galaxy.
2 The data
We analysed the available archival data from ROSAT PSPC (12 observation, with 8 pointed on M 81 nucleus for a total exposure time of 146 ksec) and HRI (7 observations pointed on M 81 nucleus for a total exposure time of 135 ksec). We also used a SAX observation pointed on M 81 and one ASCA observation pointed on X-9.
| instr. | ref | sequence nr | live time | start date | off axis |
| ROSAT PSPC | 1P | rp600101a00 | 9296 | 25/03/91 | 12.5’ |
| 2P | rp600110a00 | 12717 | 27/03/91 | 38.0’ | |
| 3P | rp600052n00 | 6588 | 18/04/91 | 31.2’ | |
| 4P | rp600110a01 | 12238 | 15/10/91 | 38.0’ | |
| 5P | rp600101a01 | 11085 | 16/10/91 | 12.5’ | |
| 6P | rp600382n00 | 27120 | 29/09/92 | 12.5’ | |
| 7P | rp180015n00 | 17938 | 03/04/93 | 12.5’ | |
| 8P | rp180015a01 | 8731 | 04/05/93 | 12.5’ | |
| 9P | wp600576n00 | 16412 | 29/09/93 | 32.0’ | |
| 10P | rp180035n00 | 17800 | 01/11/93 | 12.5’ | |
| 11P | rp180035a01 | 4234 | 07/11/93 | 12.5’ | |
| 12P | rp180050n00 | 1849 | 31/03/94 | 12.5’ | |
| ROSAT HRI | 1H | rh600247n00 | 26320 | 23/10/92 | 12.5’ |
| 2H | rh180015n00 | 1688 | 16/04/93 | 12.5’ | |
| 3H | rh600247a01 | 21071 | 17/04/93 | 12.5’ | |
| 4H | rh600739n00 | 19902 | 19/10/94 | 12.5’ | |
| 5H | rh600740n00 | 18984 | 13/04/95 | 12.5’ | |
| 6H | rh600881n00 | 14826 | 12/10/95 | 12.5’ | |
| 7H | rh601002n00 | 19776 | 30/09/97 | 12.5’ | |
| 8H | rh601095n00 | 12590 | 25/03/98 | 12.5’ | |
| BeppoSAX | MECS | 40732001 | 100287 | 04/06/98 | 13’ |
| LECS | 43931 | ||||
| ASCA | SIS | 57048000 | 33000 | 06/04/99 | - |
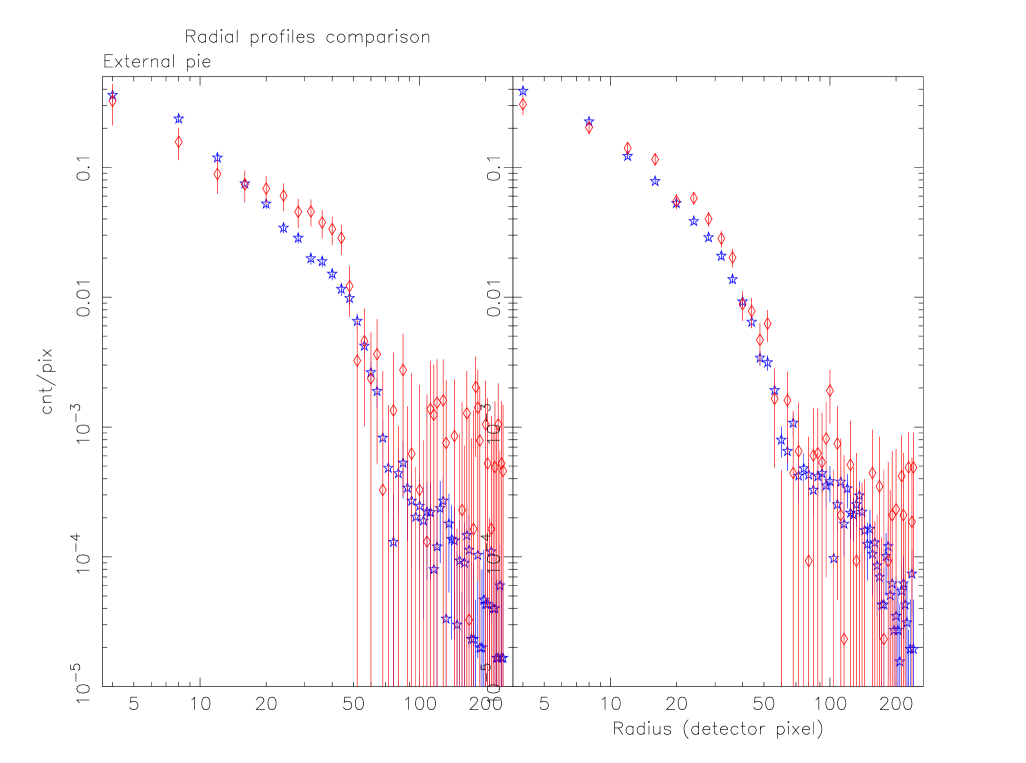
3 Spatial structure of the X-ray emission
The X-9 radial profile derived from HRI observations has been compared with
that of an HRI
calibration source (HZ43) observed at the same off axis angle.
As the calibration profile is visibly asymmetric, we divided the source image
into two pie slices (external/internal, see Figure 3) with respect
to the direction of the detector center. In the figure, X-9 has
been rotated to have the same orientation has the calibration source. We
derived the radial profile for each
slice both for the calibration source and for X-9.
Figure 3 shows the radial profile along the two directions. The right
panel shows that X-9
(diamonds) has a significant emission excess between 10 and 25 arcsec away
from the center with respect to the calibration source (stars).
HRI data then suggest a very bright point-like source but also
the presence of an extended component.
4 Source variability
For each observation we calculated the source flux in the [0.5-2.4] keV energy
band using the parameters that best fit the PSPC spectra (see next Section)
Results are reported in Figure 5, where each data point corresponds
to one individual observation. Here we note that, in spite of the fact that they
are taken with different instruments, HRI and PSPC data are in
good agreement, and this is particularly evident in the period that covers
April 1992. Moreover SAX data are consistent with the
trend shown by the last HRI observations, while the ASCA point shows a much
higher emission. The source flux
is clearly variable: variability on time scales of months as well as a
descending trend on longer time scale are evident in Figure 5. The
data do not
show any hint of periodical variability. A flare or a change in the physical
status of the source could be responsible for the flux increase shown by
the ASCA observation.
We also looked for spectral variability in PSPC data, by evaluating two
different hardness ratios, both defined as
HR =
using the energy bands showed in
Table 2. We decided to use two different definitions of
hardness ratio because the second (HR2) allows us a coarse spectral analysis
of the high energy part of the ROSAT/PSPC band, appropriate for harder sources.
We plotted both hardness ratios in Figure 5, along with PSPC counts rate.
We found very little evidence of variability, with only one point showing
a softer spectrum (observation 4P).
These results seem to exclude the hypothesis of a Supernovae shell: this
scenario could not explain the variability we observe unless we suppose a large
number of Supernovae explosions during the seven years covered by the observing
period, but no
event of this kind has been observed in other wavelenght bands.
Instead, the light curve points to a compact source or an AGN.
| Soft | Hard | ||
|---|---|---|---|
| Whole band | HR1 | 0.11-0.42 KeV | 0.52-2.02 KeV |
| Hard band | HR2 | 0.52-0.91 KeV | 0.91-2.02 KeV |


5 Spectral analysis
We analysed spectral data derived from ROSAT/PSPC, SAX/LECS, SAX/MECS and ASCA/SIS (GIS data were not used because of the contamination from M 81 nucleus) In order to test the different hypotheses on the nature of X-9 we used the following models:
-
•
an absorbed power-law (implying the hypothesis of a quasar or of a compact object);
-
•
a Raymond spectrum with one or two temperatures (related to the supershell hypothesis);
-
•
a multi-color black body disk (MCBB - adequate to a black hole hypothesis - Makishima et al., 2000).
The Raymond model fails to fit the observed spectra. The best fit results are shown in Table 3. Here we note that while SAX/LECS and ROSAT spectra appear very similar (in both cases the MCBB best fit has been obtained using SAX/MECS to fix the hard power-law component), ASCA data show a considerably different behaviour, with a higher temperature disk and no evidence for the presence of a power-law or of a line.
| Instruments | nH() | T (keV) | (Prob) | |||
|---|---|---|---|---|---|---|
| 1 | MECS | - | - | 1.11 (0.27) | ||
| 2 | MECS | - | 1.03 (0.42) | |||
| 2 | MECS+LECS | - | 1.04 (0.38) | |||
| 3 | MECS+LECS | 0.91 (0.66) | ||||
| 3 | MECS+PSPC | 0.84 (0.83) | ||||
| 4 | ASCA SIS | - | - | 1.13(0.05) |


6 Final considerations
-
•
HRI emission centroid is well coincident with a faint object in the POSS II image
-
•
The source flux is strongly variable on relatively short time scales: this fact is at odds with the hypothesis of a Supernovae super shell and suggests that X-9 is a compact accreting source
-
•
An extended component can however exist (as suggested by HRI data).
-
•
If at M81 distance, the average X-ray luminosity of the source is erg/sec, well above the Eddington limit for a 1M accreting object
-
•
The results of the spectral fitting, supporting the MCBB model, seem to confirm the Super-Eddington nature of X-9: MCBB is the model used to fit the X-ray spectrum of Super-Eddington sources, and the temperature values we find are compatible with those of Galactic Black Hole candidates (Makishima et al. 1999)
-
•
A definite spectral variation is evident between SAX/PSPC and ASCA observations.
A more detailed description of the analysis, as well as the interpretation of
the results will appear in La Parola et al. (2000), in preparation.
This work was supported in part by NASA grant NAG5-2946 and NASA contract NAS8-39073(CXC) and in part by MURST. This research has made use of the HEASARC online database and of the ESO online DSS.
7 Reference
Fabbiano G., 1988, ApJ, 325, 544
Ishisaki Y. et al. 1996, PASJ, 48, 237
La Parola V., Fabbiano G., Kim D.W., Peres G., Bocchino F., 2001, in preparation
Makishima K. et al. 2000, ApJ, 535, 632
Miller B. W., 1995, ApJ, 446, L75